

The impact of agrochemical pollutant mixtures on the selection of insecticide resistance in the malaria vector Anopheles gambiae: insights from experimental evolution and transcriptomics
- PMID: 38443984
- PMCID: PMC10916200
- DOI: 10.1186/s12936-023-04791-0
The impact of agrochemical pollutant mixtures on the selection of insecticide resistance in the malaria vector Anopheles gambiae: insights from experimental evolution and transcriptomics
Abstract
Background: There are several indications that pesticides used in agriculture contribute to the emergence and spread of resistance of mosquitoes to vector control insecticides. However, the impact of such an indirect selection pressure has rarely been quantified and the molecular mechanisms involved are still poorly characterized. In this context, experimental selection with different agrochemical mixtures was conducted in Anopheles gambiae. The multi-generational impact of agrochemicals on insecticide resistance was evaluated by phenotypic and molecular approaches.
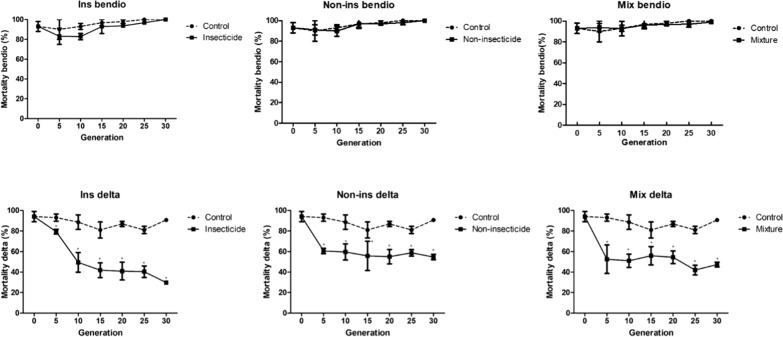
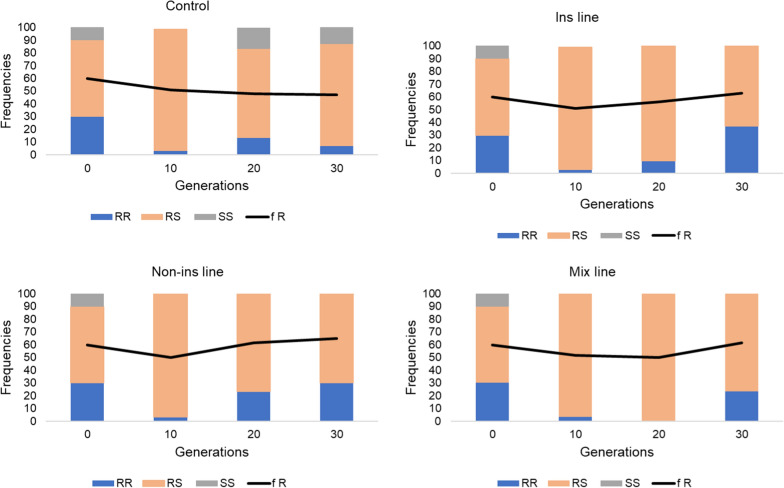
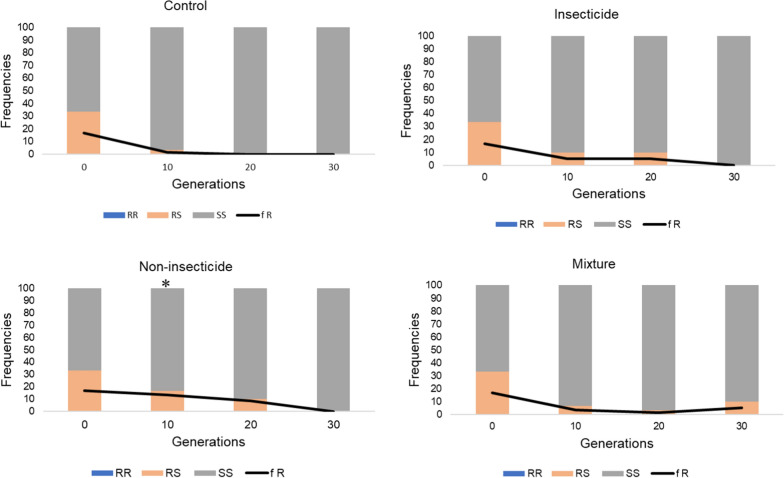
Methods: Mosquito larvae were selected for 30 generations with three different agrochemical mixtures containing (i) insecticides, (ii) non-insecticides compounds, and (iii) both insecticide and non-insecticide compounds. Every five generations, the resistance of adults to deltamethrin and bendiocarb was monitored using bioassays. The frequencies of the kdr (L995F) and ace1 (G119S) target-site mutations were monitored every 10 generations. RNAseq was performed on all lines at generation 30 in order to identify gene transcription level variations and polymorphisms associated with each selection regime.
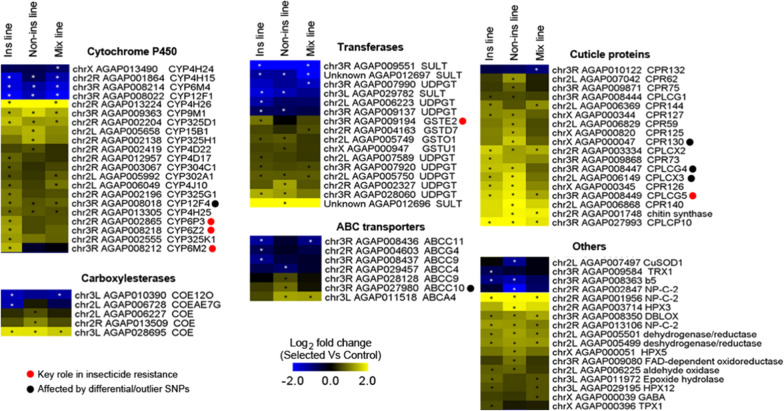
Results: Larval selection with agrochemical mixtures did not affect bendiocarb resistance and did not select for ace1 mutation. Contrastingly, an increased deltamethrin resistance was observed in the three selected lines. Such increased resistance was not majorly associated with the presence of kdr L995F mutation in selected lines. RNA-seq identified 63 candidate resistance genes over-transcribed in at least one selected line. These include genes coding for detoxification enzymes or cuticular proteins previously associated with insecticide resistance, and other genes potentially associated with chemical stress response. Combining an allele frequency filtering with a Bayesian FST-based genome scan allowed to identify genes under selection across multiple genomic loci, supporting a multigenic adaptive response to agrochemical mixtures.
Conclusion: This study supports the role of agrochemical contaminants as a significant larval selection pressure favouring insecticide resistance in malaria vectors. Such selection pressures likely impact kdr mutations and detoxification enzymes, but also more generalist mechanisms such as cuticle resistance, which could potentially lead to cross-tolerance to unrelated insecticide compounds. Such indirect effect of global landscape pollution on mosquito resistance to public health insecticides deserves further attention since it can affect the nature and dynamics of resistance alleles circulating in malaria vectors and impact the efficacy of control vector strategies.
Keywords: Anopheles gambiae; Agrochemical pesticides; Metabolic resistance; Resistance selection; Transcriptomics.
© 2024. The Author(s).
Conflict of interest statement
The authors declare that they have no competing interests.
Figures

References
-
- Wolie RZ, Koffi AA, Ahoua Alou LP, Sternberg ED, N’Nan-Alla O, Dahounto A, et al. Evaluation of the interaction between insecticide resistance-associated genes and malaria transmission in Anopheles gambiae sensu lato in central Côte d’Ivoire. Parasit Vectors. 2021;14:581. doi: 10.1186/s13071-021-05079-5. - DOI - PMC - PubMed
-
- WHO . World malaria report 2022. Geneva: World Health Organization; 2022.
MeSH terms
Substances
Grants and funding
LinkOut - more resources
Full Text Sources
Medical
Miscellaneous
