. 2024 Mar 5;15(1):68.
doi: 10.1186/s13287-023-03624-w.

Mesenchymal stem/stromal cells from human pluripotent stem cell-derived brain organoid enhance the ex vivo expansion and maintenance of hematopoietic stem/progenitor cells

Affiliations

Mesenchymal stem/stromal cells from human pluripotent stem cell-derived brain organoid enhance the ex vivo expansion and maintenance of hematopoietic stem/progenitor cells

Ya Zhou et al. Stem Cell Res Ther. .

Abstract

Background: Mesenchymal stem/stromal cells (MSCs) are of great therapeutic value due to their role in maintaining the function of hematopoietic stem/progenitor cells (HSPCs). MSCs derived from human pluripotent stem cells represent an ideal alternative because of their unlimited supply. However, the role of MSCs with neural crest origin derived from HPSCs on the maintenance of HSPCs has not been reported.

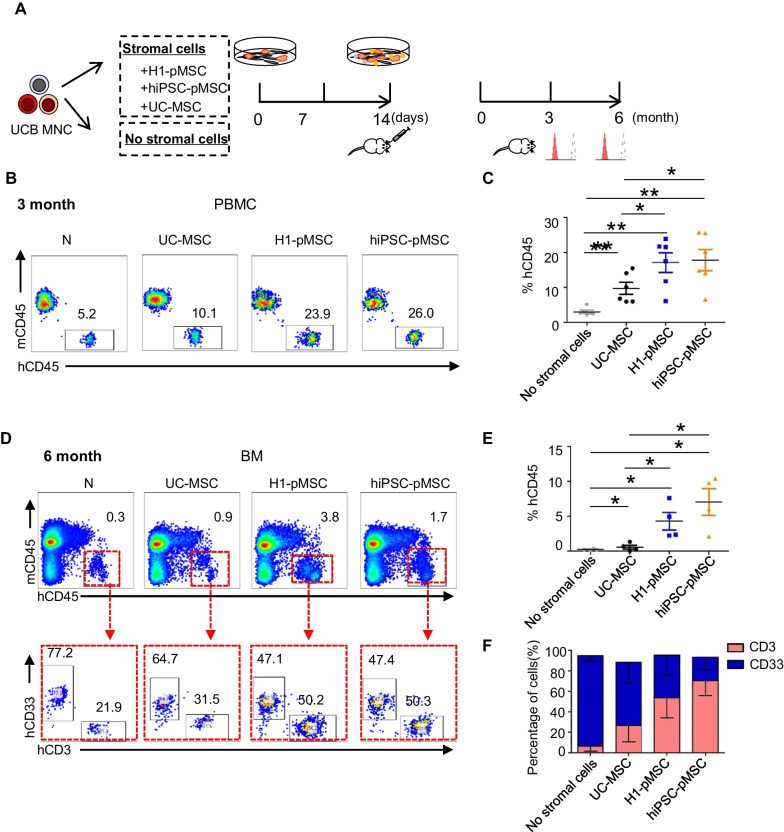
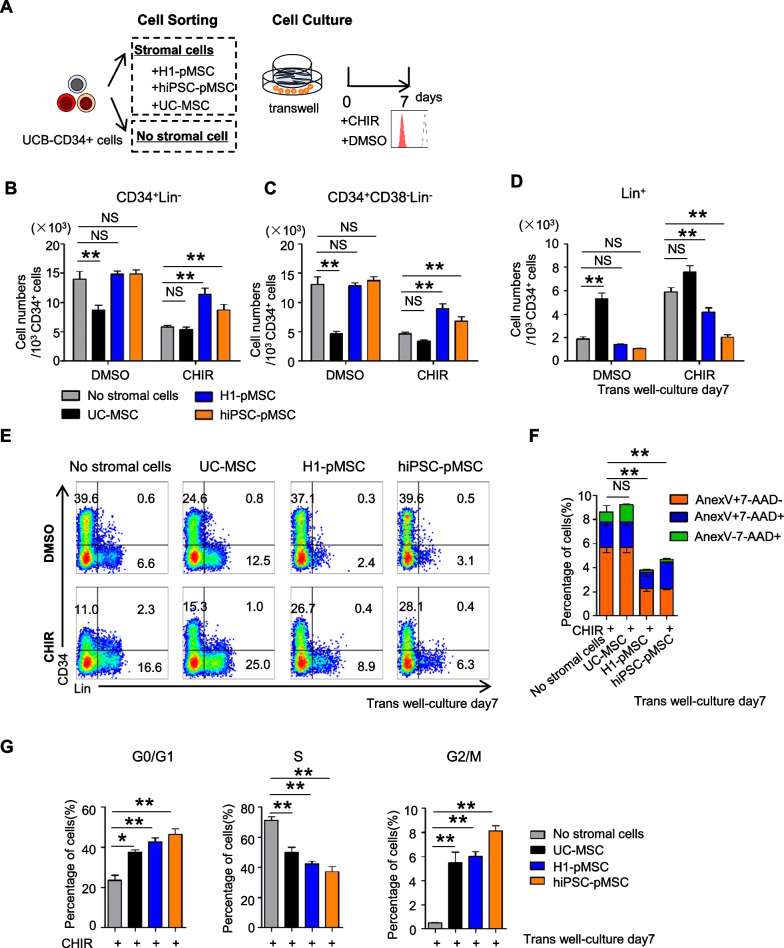
Methods: Flow cytometric analysis, RNA sequencing and differentiation ability were applied to detect the characteristics of stromal cells from 3D human brain organoids. Human umbilical cord blood CD34+ (UCB-CD34+) cells were cultured in different coculture conditions composed of stromal cells and umbilical cord MSCs (UC-MSCs) with or without a cytokine cocktail. The hematopoietic stroma capacity of stromal cells was tested in vitro with the LTC-IC assay and in vivo by cotransplantation of cord blood nucleated cells and stroma cells into immunodeficient mice. RNA and proteomic sequencing were used to detect the role of MSCs on HSPCs.

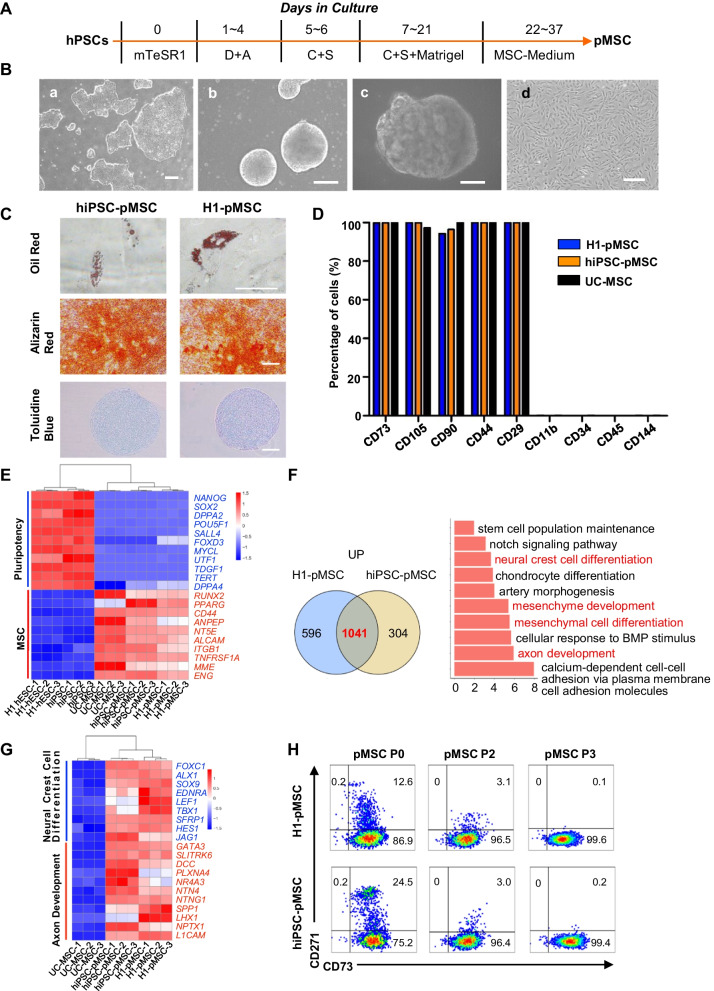
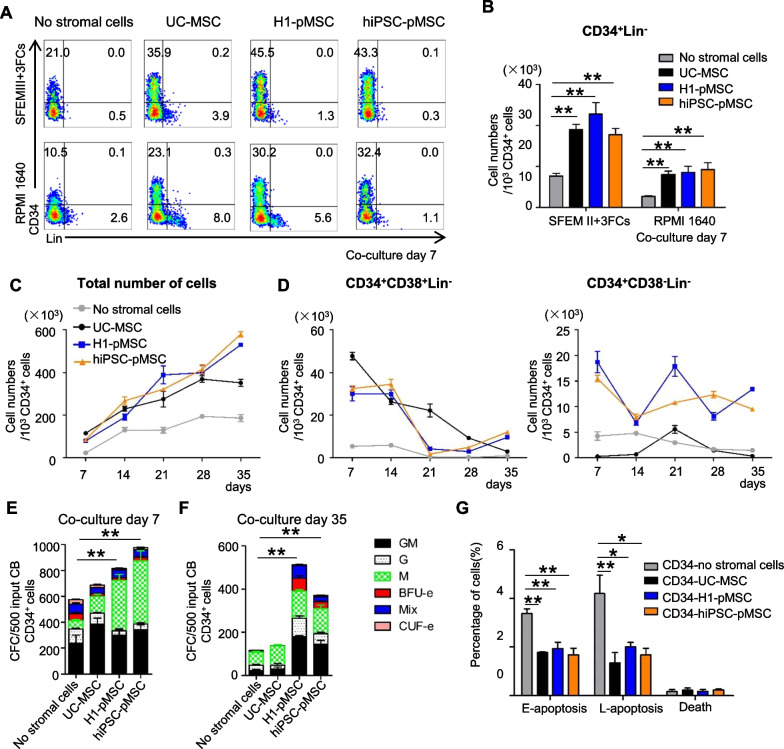
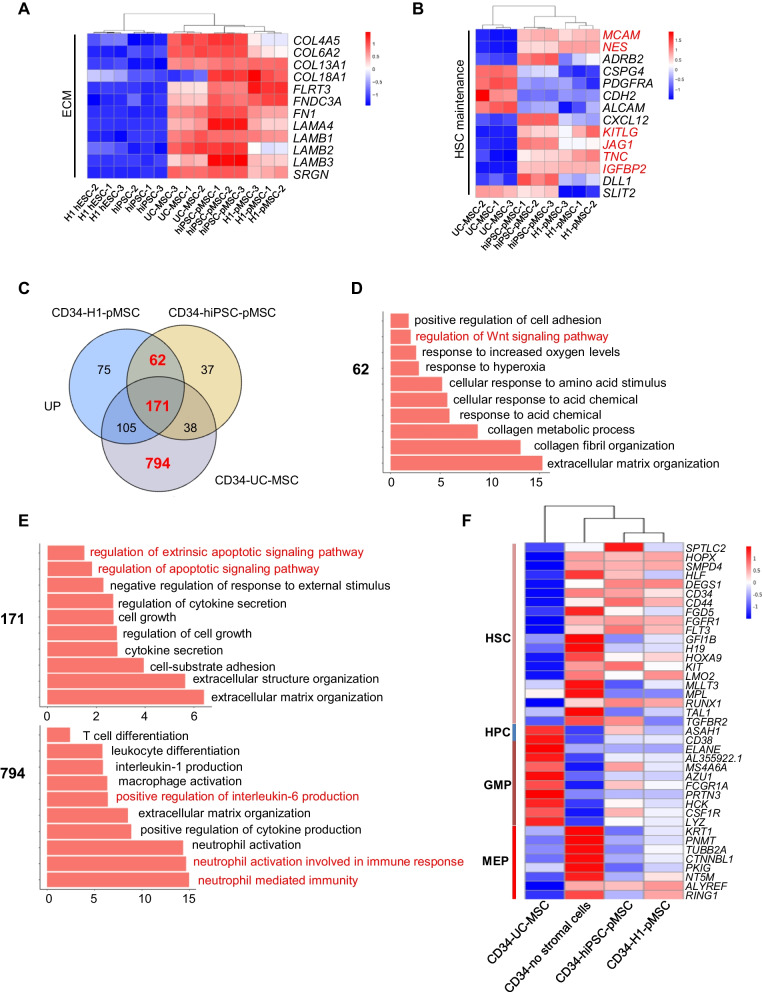
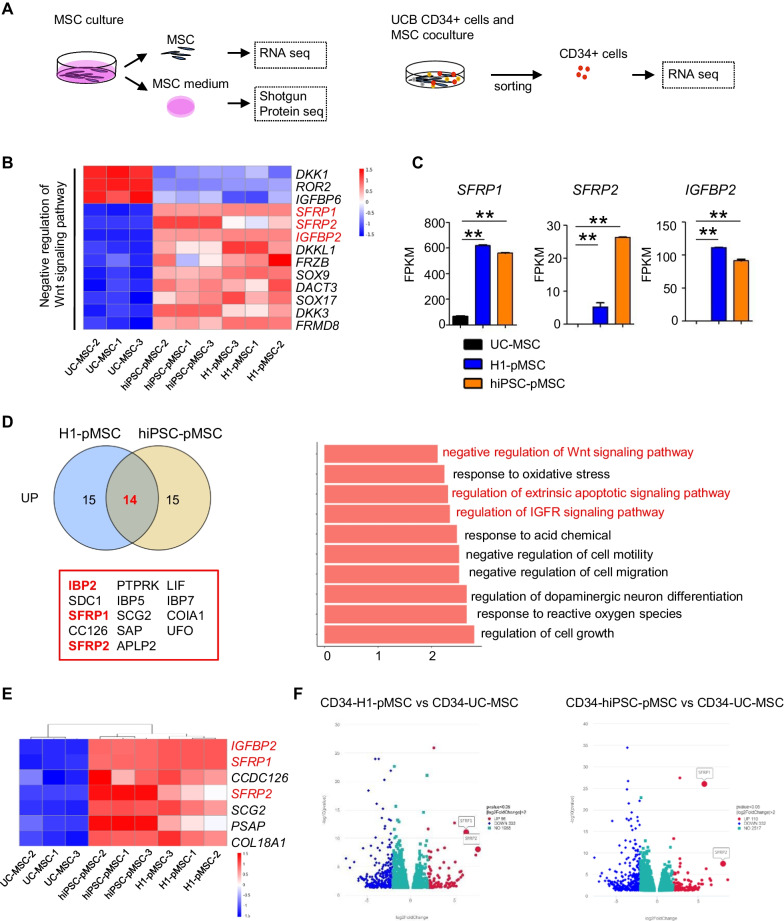
Results: The stromal cells, derived from both H1-hESCs and human induced pluripotent stem cells forebrain organoids, were capable of differentiating into the classical mesenchymal-derived cells (osteoblasts, chondrocytes, and adipocytes). These cells expressed MSC markers, thus named pluripotent stem cell-derived MSCs (pMSCs). The pMSCs showed neural crest origin with CD271 expression in the early stage. When human UCB-CD34+ HSPCs were cocultured on UC-MSCs or pMSCs, the latter resulted in robust expansion of UCB-CD34+ HSPCs in long-term culture and efficient maintenance of their transplantability. Comparison by RNA sequencing indicated that coculture of human UCB-CD34+ HSPCs with pMSCs provided an improved microenvironment for HSC maintenance. The pMSCs highly expressed the Wnt signaling inhibitors SFRP1 and SFRP2, indicating that they may help to modulate the cell cycle to promote the maintenance of UCB-CD34+ HSPCs by antagonizing Wnt activation.

Conclusions: A novel method for harvesting MSCs with neural crest origin from 3D human brain organoids under serum-free culture conditions was reported. We demonstrate that the pMSCs support human UCB-HSPC expansion in vitro in a long-term culture and the maintenance of their transplantable ability. RNA and proteomic sequencing indicated that pMSCs provided an improved microenvironment for HSC maintenance via mechanisms involving cell-cell contact and secreted factors and suppression of Wnt signaling. This represents a novel method for large-scale production of MSCs of neural crest origin and provides a potential approach for development of human hematopoietic stromal cell therapy for treatment of dyshematopoiesis.

Keywords: HSC transplantation; HSCs; Human brain organoids; MSCs; Wnt signaling pathway.


Conflict of interest statement

The authors declare no competing interests.

Figures

Fig. 1
Fig. 1
Human pluripotent stem cell-derived mesenchymal stem cells (pMSCs) reveal transcriptionally distinct populations. A Derivation of pMSCs from human brain-specific organoids. B Representative micrographs showing the typical cell morphology observed during the differentiation of hPSC to pMSCs. a: Day 0: hPSC colonies prior to differentiation; b: Differentiation of hESC into EB; c: human brain-specific organoids; d: pMSCs derived from hPSCs; scale bar, 200 µm. C Multilineage differentiation of pMSCs. After 2 weeks of corresponding induction, differentiated pMSCs were stained for mineralization with Alizarin Red, for chondrocytes with Toluidine Blue, or for lipid drops with Oil Red. D Percentage of surface markers in H1-MSCs, hiPSC-MSCs, and UC-MSCs. E Heatmaps showing genes related to pluripotency and MSC that were differentially expressed in H1-hESCs, hiPSCs, H1-MSCs, hiPSC-MSCs, and UC-MSCs. F Venn diagram and GO term analysis showing the number of common and distinct upregulated genes in the H1-MSCs and hiPSC-MSCs compared with UC-MSCs. G Heatmaps showing genes related to axon development and neural crest cell differentiation that were differentially expressed in H1-MSCs, hiPSC-MSCs, and UC-MSCs. H FACS analysis of surface markers of CD271 and CD73 in pMSCs from P0 to P3
Fig. 2
Fig. 2
pMSCs support ex vivo maintenance and CFC expansion of UCB-CD34+ HSPCs. A Representative FACS analysis of UCB-CD34+ cells cocultured with and without H1-MSCs, hiPSC-MSCs, and UC-MSCs in 5% serum without added cytokines or SFEM medium with SCF, TPO, and FLT-3L for 7 days. B Cell yield of CD34+ Lin recovered from day 7 cocultures in 5% serum without added cytokines or SFEM medium with SCF, TPO, and FLT-3L. C, D Cell yield of total number of cells, CD34+CD38+ Lin, CD34+CD38Lin from days 7–35 after coculture with and without H1-MSCs, hiPSC-MSCs, and UC-MSCs, respectively. E, F CFC assay results of UCB CD34+ HSCs following 7 or 35 days coculture with and without H1-MSCs, hiPSC-MSCs, and UC-MSCs, respectively. Morphology of hematopoietic colonies after 14 days of culture in semisolid culture media based on methylcellulose at 37℃ and 5% CO2. G Quantification of apoptosis of hematopoietic cells on 4 culture conditions by AnnexinV/PI staining. The data in the bar graphs in panels BG represent the mean ± SD. N = 3–4 replicates
Fig. 3
Fig. 3
pMSCs improve human hematopoietic cell engraftment in NDG mice. A Scheme of the experiment design. Human cord mononuclear cells were cocultured with and without pMSCs and UC-MSCs for 2 weeks and transplanted into sublethally irradiated BNDG mice. Flow cytometry analysis was used to detect the chimerism of human blood cells in the recipient mice's peripheral blood or bone marrow at 3 or 6 months post-transplantation. B Representative flow plots of human cells (hCD45+) engraftment in PBMC of BNDG mice 3 months post-transplantation with human mononuclear cells cocultured with and without UCB-MSCs or pMSCs. C Engraftment (percent of human CD45+ cells) of mice 3 months after transplants. D Representative flow plots of human cells (hCD45+) engraftment in PBMC of BNDG mice 6 months post-transplantation with human mononuclear cells cocultured with and without UCB-MSCs and pMSCs. E, F Engraftment (percent of human CD45+ cells) and multilineage differentiation (CD33+ myeloid cells and CD3+T cells) of mice 6 months after transplants. The data in the bar graphs in panels C, E, F represent the mean ± SD. N = 4–6 replicates
Fig. 4
Fig. 4
Transcriptome analysis for hematopoietic cells and MSCs. A Heatmaps showing genes related to ECM that were differentially expressed in H1-hESC, hiPSC, H1-MSCs, hiPSC-MSCs, and UC-MSCs. B Heatmaps showing genes related to HSC maintenance were differentially expressed in H1-MSCs, hiPSC-MSCs, and UC-MSCs. C Venn diagram showing the number of common and distinct upregulated genes in the CD34+ cells cocultured with H1-MSCs, hiPSC-MSCs, and UC-MSCs compared with that without stromal cells. D, E GO term analysis for common and distinct upregulated genes in the CD34+ cells cocultured with H1-MSCs, hiPSC-MSCs, and UC-MSCs compared with that without stromal cells. F HSC, HPC, GMP, and MEP signature gene expression in CD34+ cells cocultured with and without H1MSCs, hiPSC-MSCs, and UC-MSCs
Fig. 5
Fig. 5
Wnt inhibitors of SFRP1 and SFRP2 are highly expressed in pMSCs and UCB-CD34+ cocultured with pMSCs. A Workflow of the experiment design with RNA and proteomic sequencing. Transcriptome of pMSCs and UC-MSCs were compared using RNA-seq analysis. Culture medium supernatant from pMSCs and UC-MSCs were compared by proteomic sequencing analysis. Transcriptome of UCB-CD34+ cells cocultured with and without MSCs for 7 days were compared using RNA-seq analysis. B Heatmaps showing genes related to negative regulation of Wnt signaling pathway were differentially expressed in H1-MSCs, hiPSC-MSCs, and UC-MSCs. C FPKM of SFRP1, SFRP2, and IGFBP2 expressed in H1-MSCs, hiPSC-MSCs, and UC-MSCs. D Venn diagram and GO term analysis showing the number of common and distinct upregulated proteins in culture medium supernatant of H1-MSCs and hiPSC-MSCs compared with UC-MSCs. E Heatmaps showing genes coupregulated in H1-MSCs and hiPSC-MSCs both in RNA-seq and proteomics analysis. F Volcano Plot showing SFRP1 and SFRP2 upregulated in UCB CD34+ cells cocultured with H1-MSCs or hiPSC-MSCs compared that with UC-MSCs for 7 days. The data in the bar graphs in panels B represent the mean ± SD. N = 3–4 replicates
Fig. 6
Fig. 6
pMSCs antagonize Wnt signaling pathway activation and modulate the cell cycle of UCB-CD34+ cells. A Scheme of the experiment design. UCB-CD34 + cells transwell cocultured with and without pMSCs and UC-MSCs by addition of 3 µM CHIR99021 or DMSO. BD CD34 + Lin-, CD34+ CD38 Lin, and Lin+ cell numbers after activation of Wnt signaling by addition of 3 µM CHIR99021 and DMSO. E Representative FACS analysis of CD34+ Lin cells at day 7 after coculture with and without H1-MSCs, hiPSC-MSCs, and UC-MSCs with addition of 3 µM CHIR99021 or DMSO. F The percentages of live, early apoptotic (E-apoptosis), late apoptotic (L-apoptosis), and dead cells in CD34+Lin cells at day 7 after coculture with and without H1-MSCs, hiPSC-MSCs, or UC-MSCs after activation of Wnt signaling by addition of 3 µM CHIR99021. G Representative flow cytometric analysis and quantification of BrdU incorporation and 7-AAD staining to determine the cell cycle distribution of 34+Lin HSPCs on day 7 of transwell culture after activation of Wnt signaling by addition of 3 µM CHIR99021. The data in the bar graphs in panels BG represent the mean ± SD. N = 3–4 replicates

Similar articles

Cited by

References

    1. Dzierzak E, Bigas A. Blood development: hematopoietic stem cell dependence and independence. Cell Stem Cell. 2018;22(5):639–651. doi: 10.1016/j.stem.2018.04.015. - DOI - PubMed
    1. Li Z, Lan Y, He W, Chen D, Wang J, Zhou F, Wang Y, Sun H, Chen X, Xu C, et al. Mouse embryonic head as a site for hematopoietic stem cell development. Cell Stem Cell. 2012;11(5):663–675. doi: 10.1016/j.stem.2012.07.004. - DOI - PubMed
    1. Pinho S, Frenette PS. Haematopoietic stem cell activity and interactions with the niche. Nat Rev Mol Cell Biol. 2019;20(5):303–320. doi: 10.1038/s41580-019-0103-9. - DOI - PMC - PubMed
    1. Moore KA, Ema H, Lemischka IR. In vitro maintenance of highly purified, transplantable hematopoietic stem cells. Blood. 1997;89(12):4337–4347. doi: 10.1182/blood.V89.12.4337. - DOI - PubMed
    1. Oostendorp RA, Harvey KN, Kusadasi N, de Bruijn MF, Saris C, Ploemacher RE, Medvinsky AL, Dzierzak EA. Stromal cell lines from mouse aorta-gonads-mesonephros subregions are potent supporters of hematopoietic stem cell activity. Blood. 2002;99(4):1183–1189. doi: 10.1182/blood.V99.4.1183. - DOI - PubMed

Publication types