. 2024 Jan 23;4(1):vbae011.
doi: 10.1093/bioadv/vbae011. eCollection 2024.

SPREd: a simulation-supervised neural network tool for gene regulatory network reconstruction

Affiliations

SPREd: a simulation-supervised neural network tool for gene regulatory network reconstruction

Zijun Wu et al. Bioinform Adv. .

Abstract

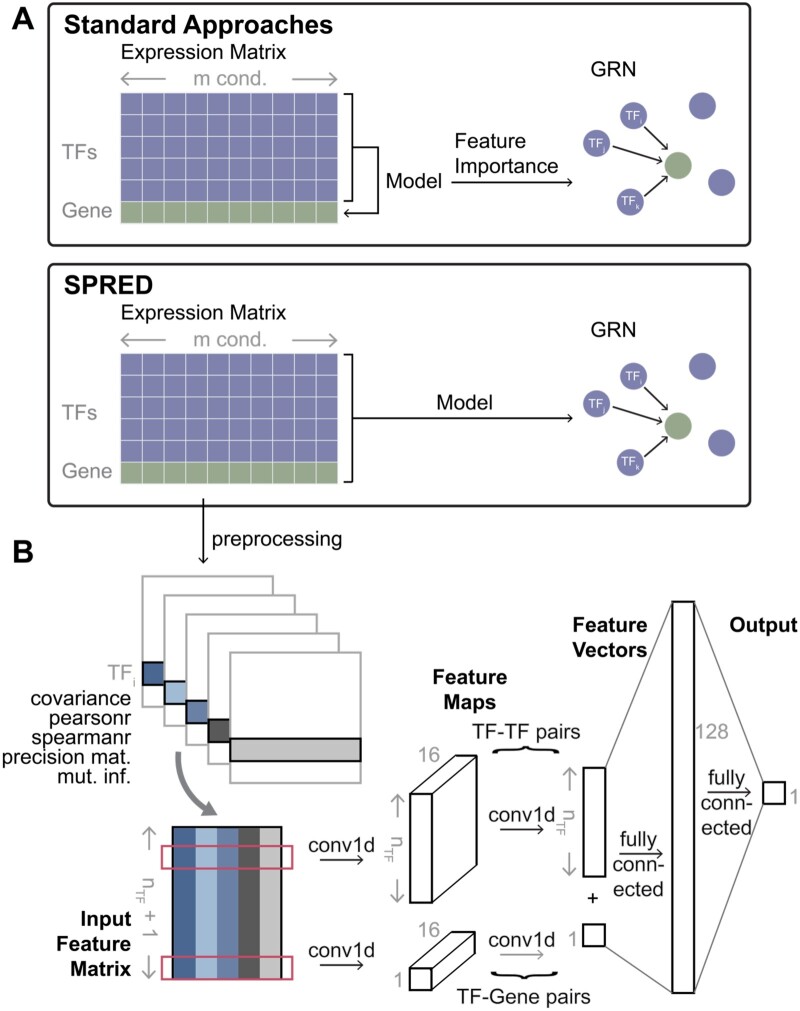
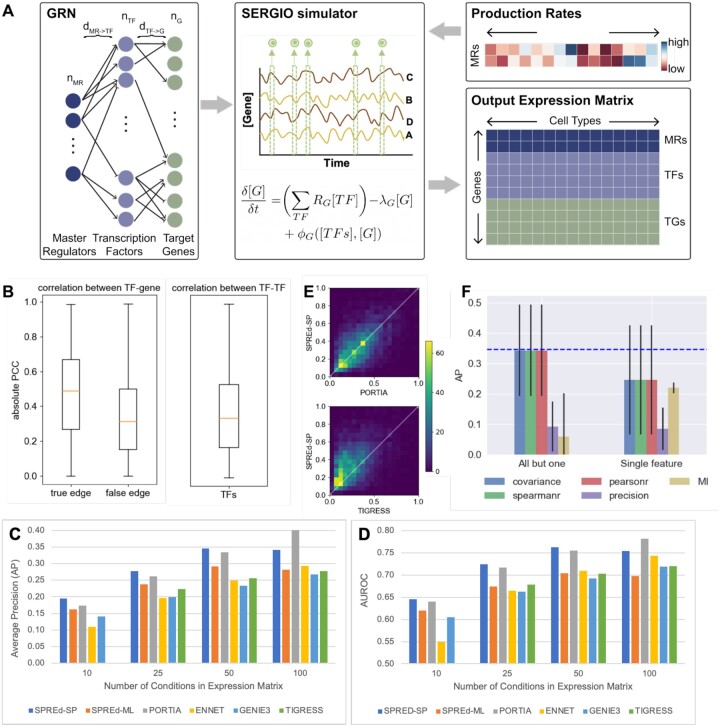
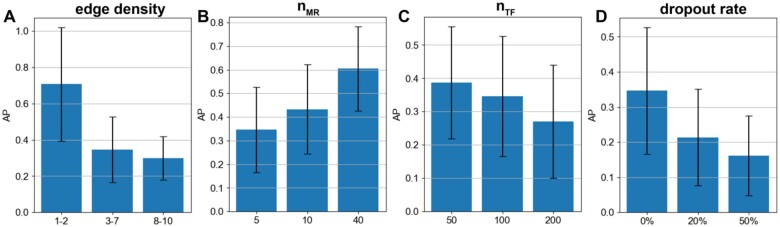
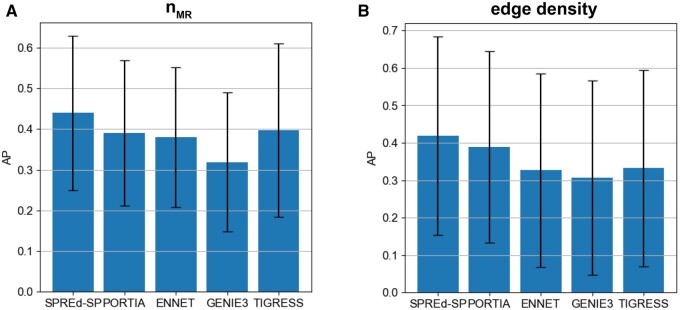
Summary: Reconstruction of gene regulatory networks (GRNs) from expression data is a significant open problem. Common approaches train a machine learning (ML) model to predict a gene's expression using transcription factors' (TFs') expression as features and designate important features/TFs as regulators of the gene. Here, we present an entirely different paradigm, where GRN edges are directly predicted by the ML model. The new approach, named "SPREd," is a simulation-supervised neural network for GRN inference. Its inputs comprise expression relationships (e.g. correlation, mutual information) between the target gene and each TF and between pairs of TFs. The output includes binary labels indicating whether each TF regulates the target gene. We train the neural network model using synthetic expression data generated by a biophysics-inspired simulation model that incorporates linear as well as non-linear TF-gene relationships and diverse GRN configurations. We show SPREd to outperform state-of-the-art GRN reconstruction tools GENIE3, ENNET, PORTIA, and TIGRESS on synthetic datasets with high co-expression among TFs, similar to that seen in real data. A key advantage of the new approach is its robustness to relatively small numbers of conditions (columns) in the expression matrix, which is a common problem faced by existing methods. Finally, we evaluate SPREd on real data sets in yeast that represent gold-standard benchmarks of GRN reconstruction and show it to perform significantly better than or comparably to existing methods. In addition to its high accuracy and speed, SPREd marks a first step toward incorporating biophysics principles of gene regulation into ML-based approaches to GRN reconstruction.

Availability and implementation: Data and code are available from https://github.com/iiiime/SPREd.


Conflict of interest statement

None declared.

Figures

Figure 1.
Figure 1.
SPRED: a simulation-supervised learning framework for gene regulatory network (GRN) inference. (A) Standard approaches typically build ML models of the target genes using the expression levels of TFs as features. GRNs are then constructed based on the feature importance of TFs (features) in the model trained for a target gene. In SPREd, an ML model is trained to directly predict TFs regulating a target gene, based on expression matrix of all TFs and the target gene. The ML model is trained on simulated expression matrix-GRN pairs and can then be used to predict the GRN for any expression matrix. (B) Architecture of SPRED-SP neural network model. Given an expression matrix whose rows represent nTF TFs and one target gene (panel A), the preprocessing step creates five matrices of pairwise relations (features) for each TF–TF pair and each TF–target gene pair. These features include covariance, Pearson correlation, Spearman correlation, mutual information, and precision matrix entry corresponding to the TF–TF or TF–target gene pair. The five features of every gene pair involving a particular TF (say TFi) then serve as the inputs of a 1D convolutional neural network (CNN) (input feature matrix, size nTF+1×5). The feature map resulting from the first layer of convolution (out channel=16) is of dimensions (nTF+1)×16, and feeds into a second convolution layer, whose outputs are fully connected to a hidden layer, which finally connect to the output layer. The output layer consists of a binary label indicating if TFi is a regulator of the target gene (details shown in Section 2).
Figure 2.
Figure 2.
SPRED exhibits superior performance on synthetic datasets. (A) Schematic of synthetic data generation. Each synthetic data set comprises a GRN (left) and an expression matrix (bottom right). The GRN has three “layers”—master regulators (MR), transcription factors (TF), and target genes, with regulatory edges from one layer to the next. The MRs are included as the first layer so as to induce co-expression among TFs, mimicking real data. Parameters describing the GRN include the number of MRs (nMR), the number of transcription factors (nTF), the number of target genes (nG), the number of incoming edges to each target gene (dTFG), and the number of incoming edges to each TF (dMRTF). A GRN is sampled at random while respecting these parameters and is used by SERGIO (middle), a biophysics-based model, to simulate the expression profiles of different artificial biological conditions, each of which is described by the production rates of MRs (top right), thus generating an expression matrix whose rows include target genes, TFs and MRs and columns represent biological conditions. (B) Co-expression statistics of synthetic expression data. Absolute value of Pearson correlation coefficient (PCC) of TF–gene pairs (left) that comprise GRN edges (“true edges”) and those that do not (“false edges”) and of TF–TF pairs (right). Results are from simulations using GRNs in default configuration. (C, D) Average precision or “AP” (C) and AUROC (D) of the six evaluated methods—SPREd-SP, SPREd-ML, PORTIA, ENNET, GENIE3, and TIGRESS—on data sets with varying numbers of conditions (columns in expression matrix). Each performance metric (AP or AUROC) is calculated for individual target genes, and results summarized over 5000 genes from 50 GRNs (100 genes in each GRN). (E) Direct comparison of average precision (AP) between SPRED and PORTIA (top) or TIGRESS (bottom), for expression data with 50 conditions. (F) AP of SPREd-SP when using all but one (left) or only one (right) of the five features describing each TF–gene or TF–TF pair. AP when using all five features is shown by blue dashed line.
Figure 3.
Figure 3.
Effect of benchmark parameters on GRN reconstruction. Performance (average precision) of SPREd-SP with varying edge density (dTFG) of 1–2, 3–7, and 8–10 TFs per target gene (A), varying numbers of MRs (nMR) (B), varying numbers of TFs (nTF) (C), and varying levels of dropout added to the synthetic expression matrix (D).
Figure 4.
Figure 4.
Performance comparison on heterogeneous benchmarks. AP comparison of SPRED-SP, SPRED-ML, PORTIA, ENNET, GENIE3, and TIGRESS on heterogeneous datasets comprising GRNs with (A) nMR =5, 10 and 40 (in equal numbers) and (B) with dTFG = 1, 2, … 10 (in equal numbers).

Update of

Similar articles

Cited by

References

    1. Aibar S, González-Blas CB, Moerman T. et al. SCENIC: single-cell regulatory network inference and clustering. Nat Methods 2017;14:1083–6. - PMC - PubMed
    1. Box GE, Cox DR.. An analysis of transformations. J R Stat Soc Ser B Stat Methodol 1964;26:211–43.
    1. Bravo González-Blas C, De Winter S, Hulselmans G. et al. SCENIC+: single-cell multiomic inference of enhancers and gene regulatory networks. Nat Methods 2023;20:1355–67. - PMC - PubMed
    1. Chan TE, Stumpf MPH, Babtie AC.. Gene regulatory network inference from single-cell data using multivariate information measures. Cell Syst 2017;5:251–67 e253. - PMC - PubMed
    1. Chen J, Cheong C, Lan L et al. DeepDRIM: a deep neural network to reconstruct cell-type-specific gene regulatory network using single-cell RNA-seq data. Brief Bioinform 2021;22. - PMC - PubMed