Intra-colony spatial variance of oxyregulation and hypoxic thresholds for key Acropora coral species
- PMID: 38444722
- PMCID: PMC10914553
- DOI: 10.1002/ece3.11100
Intra-colony spatial variance of oxyregulation and hypoxic thresholds for key Acropora coral species
Abstract
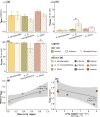
Oxygen (O2) availability is essential for healthy coral reef functioning, yet how continued loss of dissolved O2 via ocean deoxygenation impacts performance of reef building corals remains unclear. Here, we examine how intra-colony spatial geometry of important Great Barrier Reef (GBR) coral species Acropora may influence variation in hypoxic thresholds for upregulation, to better understand capacity to tolerate future reductions in O2 availability. We first evaluate the application of more streamlined models used to parameterise Hypoxia Response Curve data, models that have been used historically to identify variable oxyregulatory capacity. Using closed-system respirometry to analyse O2 drawdown rate, we show that a two-parameter model returns similar outputs as previous 12th-order models for descriptive statistics such as the average oxyregulation capacity (Tpos) and the ambient O2 level at which the coral exerts maximum regulation effort (Pcmax), for diverse Acropora species. Following an experiment to evaluate whether stress induced by coral fragmentation for respirometry affected O2 drawdown rate, we subsequently identify differences in hypoxic response for the interior and exterior colony locations for the species Acropora abrotanoides, Acropora cf. microphthalma and Acropora elseyi. Average regulation capacity across species was greater (0.78-1.03 ± SE 0.08) at the colony interior compared with exterior (0.60-0.85 ± SE 0.08). Moreover, Pcmax occurred at relatively low pO2 of <30% (±1.24; SE) air saturation for all species, across the colony. When compared against ambient O2 availability, these factors corresponded to differences in mean intra-colony oxyregulation, suggesting that lower variation in dissolved O2 corresponds with higher capacity for oxyregulation. Collectively, our data show that intra-colony spatial variation affects coral oxyregulation hypoxic thresholds, potentially driving differences in Acropora oxyregulatory capacity.
Keywords: Climate change; Coral oxyregulator; Coral reefs; Hypoxia Response Curves; Hypoxic tolerance; Ocean deoxygenation.
© 2024 The Authors. Ecology and Evolution published by John Wiley & Sons Ltd.
Conflict of interest statement
No competing interests declared.
Figures


Similar articles
-
Widespread oxyregulation in tropical corals under hypoxia.Mar Pollut Bull. 2022 Jun;179:113722. doi: 10.1016/j.marpolbul.2022.113722. Epub 2022 May 7. Mar Pollut Bull. 2022. PMID: 35537305
-
Divergent expression of hypoxia response systems under deoxygenation in reef-forming corals aligns with bleaching susceptibility.Glob Chang Biol. 2021 Jan;27(2):312-326. doi: 10.1111/gcb.15436. Epub 2020 Nov 16. Glob Chang Biol. 2021. PMID: 33197302
-
Differential susceptibility of reef-building corals to deoxygenation reveals remarkable hypoxia tolerance.Sci Rep. 2021 Nov 30;11(1):23168. doi: 10.1038/s41598-021-01078-9. Sci Rep. 2021. PMID: 34848743 Free PMC article.
-
Colonies of Acropora formosa with greater survival potential have reduced calcification rates.PLoS One. 2022 Jun 9;17(6):e0269526. doi: 10.1371/journal.pone.0269526. eCollection 2022. PLoS One. 2022. PMID: 35679252 Free PMC article.
-
Climate change impacts on coral reefs: synergies with local effects, possibilities for acclimation, and management implications.Mar Pollut Bull. 2013 Sep 30;74(2):526-39. doi: 10.1016/j.marpolbul.2013.06.011. Epub 2013 Jun 28. Mar Pollut Bull. 2013. PMID: 23816307 Review.
Cited by
-
Hypoxia disrupts metabolism in coral and sea anemone larvae.J Exp Biol. 2025 Jun 15;228(12):jeb250372. doi: 10.1242/jeb.250372. Epub 2025 Jun 27. J Exp Biol. 2025. PMID: 40452587 Free PMC article.
-
Spatially restricted coral bleaching as an ecological manifestation of within-colony heterogeneity.Commun Biol. 2025 May 13;8(1):740. doi: 10.1038/s42003-025-08150-4. Commun Biol. 2025. PMID: 40360784 Free PMC article. Review.
References
-
- Alderdice, R. , Suggett, D. , Cardenas, A. , Hughes, D. , Kühl, M. , Pernice, M. , & Voolstra, C. (2021). Divergent expression of hypoxia response systems under deoxygenation in reef‐forming corals aligns with bleaching susceptibility. Global Change Biology, 27, 1–15. 10.1111/gcb.15436 - DOI - PubMed
-
- Allaire, J. , Xie, Y. , McPherson, J. , Luraschi, J. , Ushey, K. , Atkins, A. , Wickham, H. , Cheng, J. , Chang, W. , & Iannone, R. (2023). rmarkdown: Dynamic Documents for r . R package version 2.25.3. https://github.com/rstudio/rmarkdown
Associated data
LinkOut - more resources
Full Text Sources
Other Literature Sources

