

Microvascular disease not type 2 diabetes is associated with increased cortical porosity: A study of cortical bone microstructure and intracortical vessel characteristics
- PMID: 38444830
- PMCID: PMC10912053
- DOI: 10.1016/j.bonr.2024.101745
Microvascular disease not type 2 diabetes is associated with increased cortical porosity: A study of cortical bone microstructure and intracortical vessel characteristics
Abstract
Introduction: Fracture risk is elevated in type 2 diabetes (T2D) despite normal or even high bone mineral density (BMD). Microvascular disease (MVD) is a diabetic complication, but also associated with other diseases, for example chronic kidney disease. We hypothesize that increased fracture risk in T2D could be due to increased cortical porosity (Ct.Po) driven by expansion of the vascular network in MVD. The purpose of this study was to investigate associations of T2D and MVD with cortical microstructure and intracortical vessel parameters.
Methods: The study group consisted of 75 participants (38 with T2D and 37 without T2D). High-resolution peripheral quantitative CT (HR-pQCT) and dynamic contrast-enhanced MRI (DCE-MRI) of the ultra-distal tibia were performed to assess cortical bone and intracortical vessels (outcomes). MVD was defined as ≥1 manifestation including neuropathy, nephropathy, or retinopathy based on clinical exams in all participants. Adjusted means of outcomes were compared between groups with/without T2D or between participants with/without MVD in both groups using linear regression models adjusting for age, sex, BMI, and T2D as applicable.
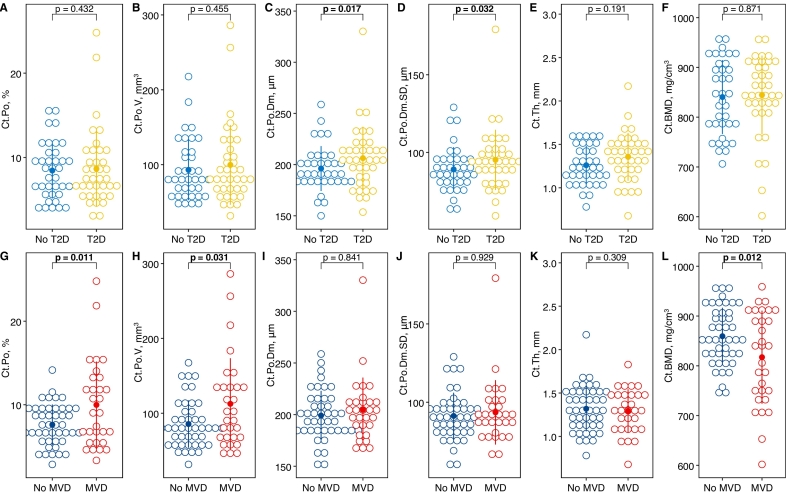
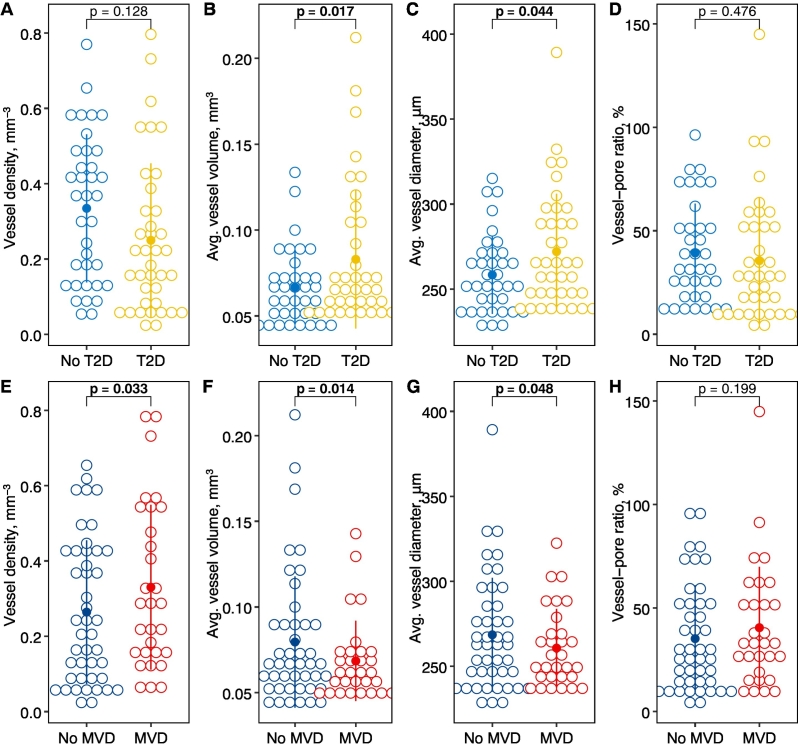
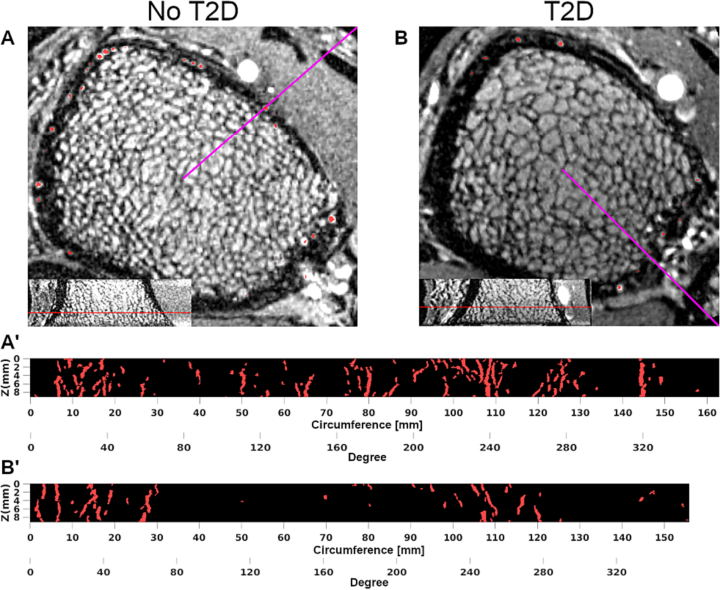
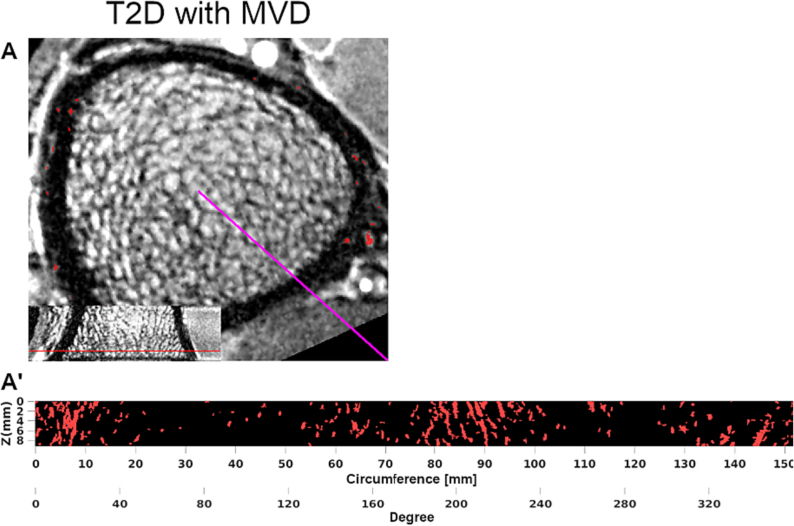
Results: MVD was found in 21 (55 %) participants with T2D and in 9 (24 %) participants without T2D. In T2D, cortical pore diameter (Ct.Po.Dm) and diameter distribution (Ct.Po.Dm.SD) were significantly higher by 14.6 μm (3.6 %, 95 % confidence interval [CI]: 2.70, 26.5 μm, p = 0.017) and by 8.73 μm (4.8 %, CI: 0.79, 16.7 μm, p = 0.032), respectively. In MVD, but not in T2D, cortical porosity was significantly higher by 2.25 % (relative increase = 12.9 %, CI: 0.53, 3.97 %, p = 0.011) and cortical BMD (Ct.BMD) was significantly lower by -43.6 mg/cm3 (2.6 %, CI: -77.4, -9.81 mg/cm3, p = 0.012). In T2D, vessel volume and vessel diameter were significantly higher by 0.02 mm3 (13.3 %, CI: 0.004, 0.04 mm3, p = 0.017) and 15.4 μm (2.9 %, CI: 0.42, 30.4 μm, p = 0.044), respectively. In MVD, vessel density was significantly higher by 0.11 mm-3 (17.8 %, CI: 0.01, 0.21 mm-3, p = 0.033) and vessel volume and diameter were significantly lower by -0.02 mm3 (13.7 %, CI: -0.04, -0.004 mm3, p = 0.015) and - 14.6 μm (2.8 %, CI: -29.1, -0.11 μm, p = 0.048), respectively.
Conclusions: The presence of MVD, rather than T2D, was associated with increased cortical porosity. Increased porosity in MVD was coupled with a larger number of smaller vessels, which could indicate upregulation of neovascularization triggered by ischemia. It is unclear why higher variability and average diameters of pores in T2D were accompanied by larger vessels.
Keywords: Cortical bone; Dynamic contrast-enhanced MRI; HR-pQCT; Microvascular disease; Porosity; Type 2 diabetes.
© 2024 Published by Elsevier Inc.
Conflict of interest statement
The authors declare the following financial interests/personal relationships which may be considered as potential competing interests: Galateia J. Kazakia reports financial support was provided by the 10.13039/100000002National Institutes of Health.
Figures
References
-
- Arthur D., Vassilvitskii S. k-means++: The Advantages of Careful Seeding. 2006. http://ilpubs.stanford.edu:8090/778/ (accessed September 18, 2022)
-
- Bala Y., Zebaze R., Ghasem-Zadeh A., Atkinson E.J., Iuliano S., Peterson J.M., Amin S., Bjørnerem Å., Melton L.J., Johansson H., Kanis J.A., Khosla S., Seeman E. Cortical porosity identifies women with osteopenia at increased risk for forearm fractures. J. Bone Miner. Res. Off. J. Am. Soc. Bone Miner. Res. 2014;29:1356–1362. doi: 10.1002/jbmr.2167. - DOI - PMC - PubMed
-
- Barrett E.J., Liu Z., Khamaisi M., King G.L., Klein R., Klein B.E.K., Hughes T.M., Craft S., Freedman B.I., Bowden D.W., Vinik A.I., Casellini C.M. Diabetic microvascular disease: an Endocrine Society scientific statement. J. Clin. Endocrinol. Metab. 2017;102:4343–4410. doi: 10.1210/jc.2017-01922. - DOI - PMC - PubMed
Grants and funding
LinkOut - more resources
Full Text Sources
