. 2024 Feb 20:15:1282754.
doi: 10.3389/fimmu.2024.1282754. eCollection 2024.

Immunological signatures unveiled by integrative systems vaccinology characterization of dengue vaccination trials and natural infection

Affiliations

Immunological signatures unveiled by integrative systems vaccinology characterization of dengue vaccination trials and natural infection

Desirée Rodrigues Plaça et al. Front Immunol. .

Abstract

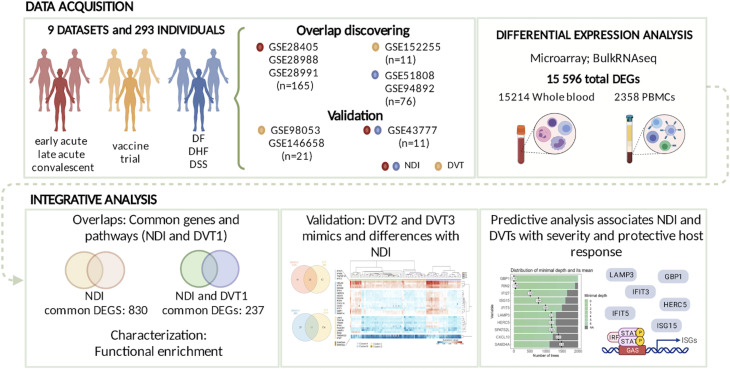
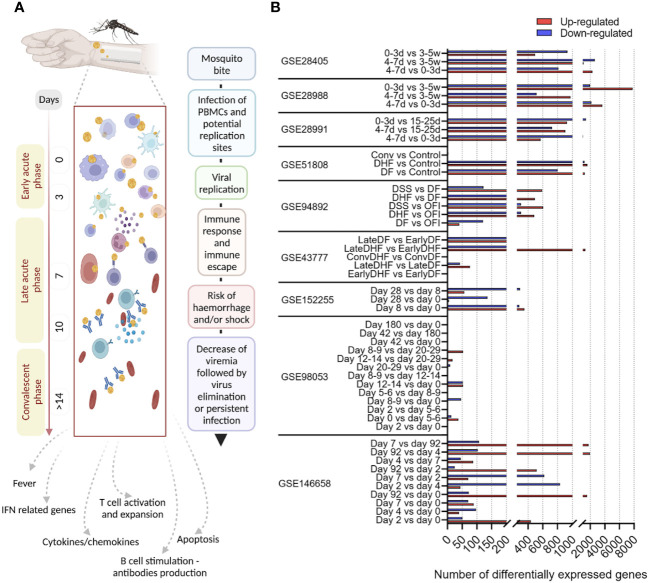
Introduction: Dengue virus infection is a global health problem lacking specific therapy, requiring an improved understanding of DENV immunity and vaccine responses. Considering the recent emerging of new dengue vaccines, here we performed an integrative systems vaccinology characterization of molecular signatures triggered by the natural DENV infection (NDI) and attenuated dengue virus infection models (DVTs).

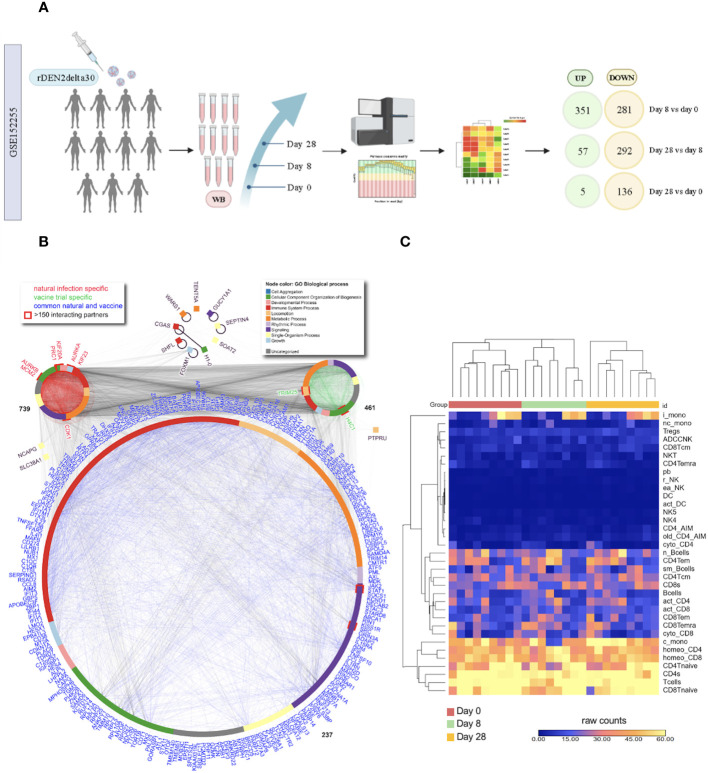
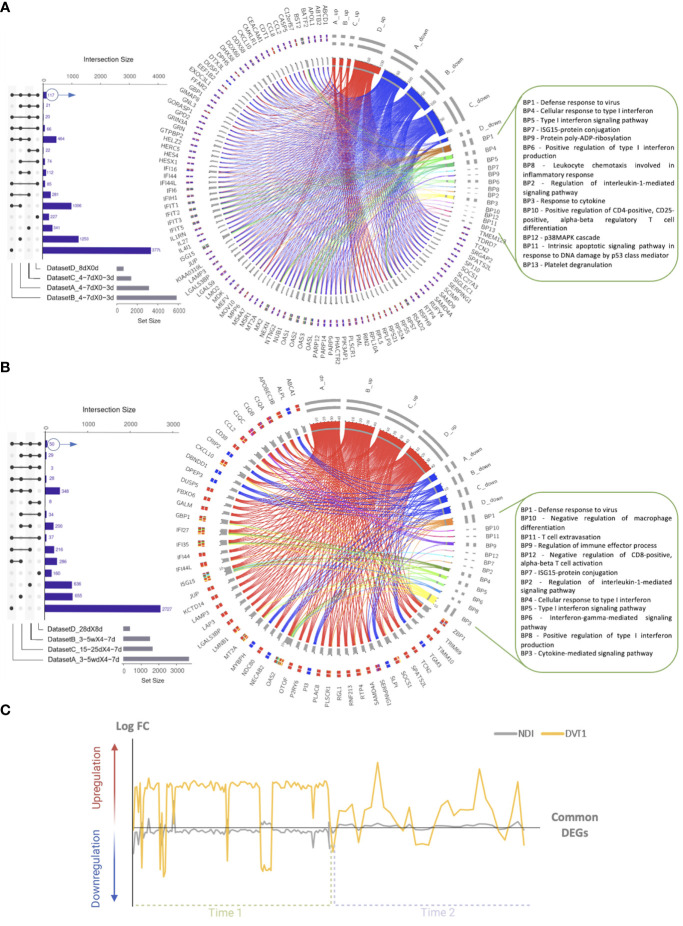
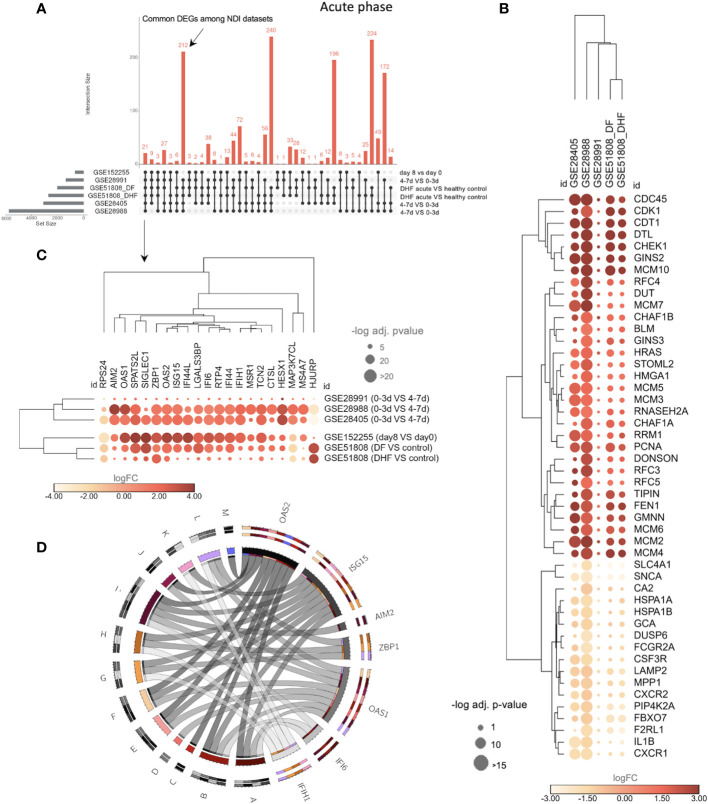
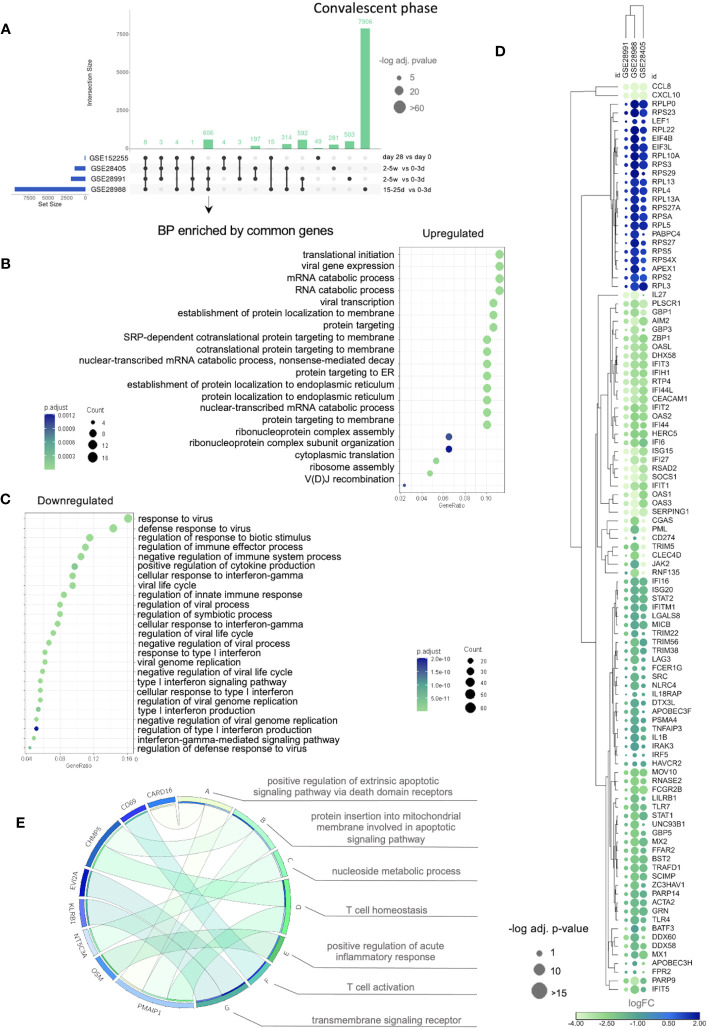
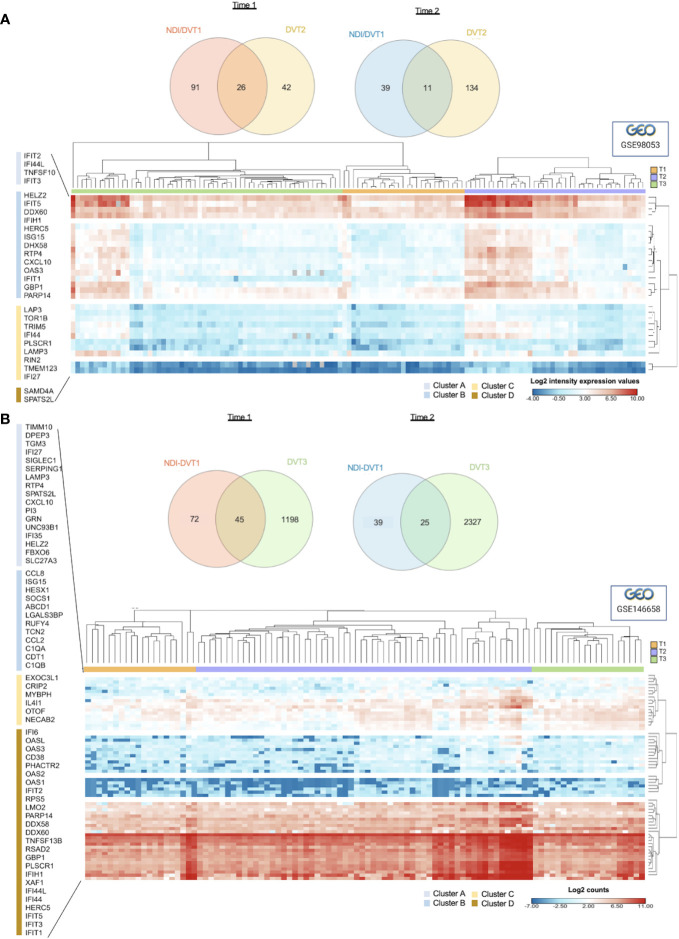
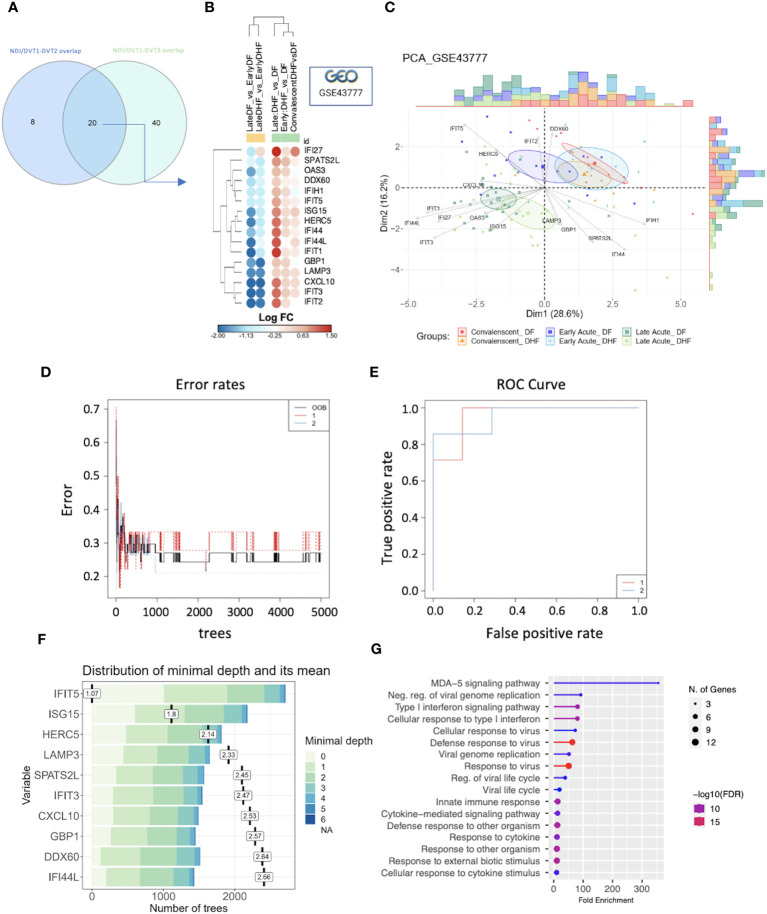
Methods and results: We analyzed 955 samples of transcriptomic datasets of patients with NDI and attenuated dengue virus infection trials (DVT1, DVT2, and DVT3) using a systems vaccinology approach. Differential expression analysis identified 237 common differentially expressed genes (DEGs) between DVTs and NDI. Among them, 28 and 60 DEGs were up or downregulated by dengue vaccination during DVT2 and DVT3, respectively, with 20 DEGs intersecting across all three DVTs. Enriched biological processes of these genes included type I/II interferon signaling, cytokine regulation, apoptosis, and T-cell differentiation. Principal component analysis based on 20 common DEGs (overlapping between DVTs and our NDI validation dataset) distinguished dengue patients by disease severity, particularly in the late acute phase. Machine learning analysis ranked the ten most critical predictors of disease severity in NDI, crucial for the anti-viral immune response.

Conclusion: This work provides insights into the NDI and vaccine-induced overlapping immune response and suggests molecular markers (e.g., IFIT5, ISG15, and HERC5) for anti-dengue-specific therapies and effective vaccination development.

Keywords: dengue; immune response; systems vaccinology; transcriptional signature; vaccine.


Conflict of interest statement

The authors declare that the research was conducted in the absence of any commercial or financial relationships that could be construed as a potential conflict of interest. This study received funding from IBM. The funder had the following involvement in the study: production of figures, revision, and manuscript editing. The author(s) declared that they were an editorial board member of Frontiers, at the time of submission. This had no impact on the peer review process and the final decision.

Figures

Figure 1
Figure 1
Study workflow. Overview of study workflow and results obtained. NDI, natural DENV infection; DVT, Dengue vaccine trial; DF, dengue fever; DHF, dengue hemorrhagic fever; DSS, Dengue Shock Syndrome.
Figure 2
Figure 2
Dynamics of dengue infection and disease progression, and differentially expressed genes across the study cohorts. (A) Schematic overview of dengue phases and progression over time, showing the immunological processes and clinical manifestations1–3. (B) Graphic showing the number of differentially expressed genes (DEGs) by all data sets included in our study. The data sets are shown according to their Gene Expression Omnibus (GEO) IDs. Time points of sample collection and disease severity groups are shown for each data set according to the original studies.
Figure 3
Figure 3
General transcriptional overlap between natural dengue infection and dengue vaccine trial. (A) The vaccine challenge design scheme shows the number of patients, days of sample collection, and the number of differentially expressed genes (DEGs) found in each comparison; (B) Protein-protein interaction network of common (overlap) DEGs between NDI and DVT1 (largest network) as well as specific DEGs of NDIs (in common across 3 NDI data sets) and the DVT1; (C) Heatmap of cell counts at different times of the DVT1 data set. Each column represents an individual, and rows indicate different cell populations. Bcells, B cells; pb, plasmablasts; sm_Bcells, switched memory B cells; n_Bcells, naïve B cells; c_mono, classical monocytes; i_mono, intermediate monocytes; nc_mono, non-classic monocytes; NKT, NK T cells; r_NK, resting NK; ea_NK, early activated NK; ADCCNK, ADCC NK; NK4, CD3–CD56intCD16– NK activated; NK5, CD3–CD56–CD16+ NK post-activation; DC, Dendritic Cells; act_DC, Activated DCs; Tcells, T cells; Tregs, regulatory T cells; CD4Tnaive, naïve CD4 T cells; CD4Tcm, central memory CD4 T cells; CD4Tem, effector memory CD4 T cells; CD4Temra, effector memory re-expression CD45RA CD4 T cells; homeo_CD4, homeostatic CD4 T cells; cyto_CD4, cytotoxic CD4 T cells; act_CD4, activated CD4 T cells; CD8Tnaive, naïve CD48 T cells; CD8Tcm, central memory CD8 T cells; CD8Tem, effector memory CD8 T cells; CD8Temra, effector memory re-expression CD45RA CD8 T cells; homeo_CD8, homeostatic CD8 T cells; cyto_CD8, cytotoxic CD8 T cells; act_CD8, activated CD8 T cells; CD4_AIM, AIM+ CD4 T cells; old_CD4_AIM, old AIM+ CD4 T cells.
Figure 4
Figure 4
Longitudinal transcriptional overlap between the natural dengue infection and the dengue vaccine trial. Upset plots displaying overlapping differentially expressed genes (DEGs) from the comparison of the (A) initial (total of 117 DEGs; only 100 are exhibited in the circos plot) or (B) late (total of 50 DEGs) days of sample collection in NDI data sets [(A) GSE28405, (B) GSE28988, (C) GSE28991] and the DVT1 data set [(D) GSE152255]. Circos plots illustrate the functional relationships (shown by edges) between the DEGs and biological processes (BPs), denoted by letters. Colors denote up- (red) and downregulation (blue) of DEGs. The complete list of enriched BPs is provided in Supplementary Tables S4A , S5 . (C) The graphic provides an overview of whether DEGs are up or downregulated (by relative log FC on the y-axis) during the initial (Time 1) or late (Time 2) days of sample collection. Variables = genes.
Figure 5
Figure 5
The transcriptional overlap between NDI at acute phase with disease severity and DVT1 information. (A) The upset plot showing the transcriptional intersection among all datasets of the NDI acute phase is as follows. GSE28988 and GSE28405: late acute (4-7 days or d) vs. early acute (0-3d); GSE51808: DF or DHF acute (2-9d) vs. healthy controls; GSE28991: late acute (4-7d) vs early acute (0-3d); GSE152255 (DVT1): first days of infection (8d) vs (day 0). DF, dengue fever; DHF, dengue hemorrhagic fever. The dataset GSE94892 was not included in this comparison because there is no information on time points for the different disease severity states (DF, DHF, and DSS) ( Supplementary Table S6 ). (B) Bubble heatmap showing 48 common genes enriching the top 11 (1 term, 31 genes, from upregulated common DEGs enrichment and 10 terms, 17 genes, from downregulated common DEGs enrichment, based on adjusted p-value and number of genes, Supplementary Tables S7, S8 ) gene ontology (GO) biological processes (BP) among the NDI datasets. (C) Bubble heatmap of 21 common genes across all datasets. The color of the circles corresponds to log2 fold change (log2FC), and their size is proportional to the -log10 of the adjusted p-value. (D) Circos plot indicating the relationships between 7 of the 21 genes [shown in (C)] and statistically significant BPs (denoted by letters) resulting from enrichment analysis of the 21 genes using Enrich R4. The size of the rectangles in the outer circles is proportional to the involvement of each gene in multiple pathways. The size of rectangles forming the inner circle represents genes and pathways with more connections to each other. Colors (chosen randomly to discriminate each variable) on the outer circles denote pleiotropy and gene-pathway associations. A, cellular response to type I interferon; B, type I interferon signaling pathway; C, regulation of nuclease activity; D, negative regulation of viral genome replication; E, negative regulation of viral life cycle; F, regulation of viral genome replication; G, regulation of type I interferon production; H, regulation of cytokine production; I, cytokine-mediated signaling pathway; J, regulation of RNA metabolic process; K, negative regulation of type I interferon production; L, positive regulation of type I interferon production; M, interferon-gamma-mediated signaling pathway. The complete list of enriched BPs is provided in Supplementary Table S9 .
Figure 6
Figure 6
The transcriptional divergence between NDI and DVT1 during the convalescent phase. Data sets (GSE28405, GSE28988, and GSE28991). Since the GSE51808, which contains information regarding disease severity, did show only four DEGs during the convalescent phase, it was not included here. (A) Upset plot shows the intersections between datasets of the convalescent phase from the NDI data sets (DEGs obtained from the comparison between 3-5 weeks vs. 0-3 days) and the vaccine trial (DVT1) (sample collected 28 vs 0 day) ( Supplementary Table S10 ). (B) Dotplots of BPs enriched by upregulated ( Supplementary Table S11 ) and (C) downregulated common genes ( Supplementary Table S12 ) across NDI datasets. (D) Bubble heatmap showing clusters of up- and downregulated genes enriching the most significant BPs shown in (B, C) (based on adjusted p-value and number of genes). The circle sizes and color are proportional to the log fold change (log FC) and -log10 adjusted p-value (-log10 adj. p-value), respectively. (E) Circos plot indicating the relationship between the 8 common DEGs across all NDI and DVT1 data sets [shown in (A)] and statistically significant BPs enriched by these genes. The complete list of enriched BPs is provided in Supplementary Table S13 .
Figure 7
Figure 7
Validation of transcriptional overlap and immune response dynamics between NDI and DVT1 using two additional vaccine trials (GSE98053 and GSE146658). (A) Venn diagrams (upper graphics) showing the intersections of common differentially expressed genes (DEGs) from NDI/DVT1 and DVT2 datasets at acute (Time 1) and convalescent phases (Time 2). Complex heatmap (lower graphics) with hierarchical clustering (using Euclidian distance metric) of expression intensity values (GSE98053) of 28 genes that overlap between NDI/DVT1 and DVT2 data sets through time 1 (T1, from 0 to 5 days), time 2 (T2, from 6 to 9 days), and time 3 (T3, 12 or more days), respectively, resulting in 4 clusters (Cluster A to D). (B) Venn diagrams (upper graphics) showing the intersection of common DEGs from NDI/DVT1 and DVT3 data sets at acute (Time 1) and convalescent phases (Time 2). Complex heatmap (lower graphic) with hierarchical clustering (using Euclidian distance metric) of log2 counts (GSE146658) of 60 genes that overlap between NDI/DVT1 and DVT3 data sets at different time points as described in (A).
Figure 8
Figure 8
GSE43777 validates NDI-DVTs overlap and predicts important genes for distinguishing disease severity and establishing host protection through a machine learning model. (A) Venn diagram showing the intersection (20 genes) between common genes from NDI/DVT1-DVT2 and NDI/DVT1-DVT3 overlaps. (B) Bubble heatmap with hierarchical clustering using Euclidian metric of 16 of these 20 genes, which were differentially expressed genes (DEGs) when comparing groups of disease phases (yellow cluster) and severities (green cluster) of the data set GSE43777. The colors of the circles are proportional to log FC, indicating downregulation(blue) or upregulation(red) of each gene. (C) Principal component analysis (PCA) from the 16 DEGs stratifying late acute phases from the other disease phases (n=10 patients in each group). (D) Stable curve showing the number of trees and an error rate of random forest model for ranking predictors of disease severity in GSE43777 with out-of-the-bag (OOB) of 27.03% and class error of 33,33% and 21,05% for group 1 (DF) and group 2 (DHF), respectively. (E) Receiver operating characteristics (ROC) curve of the random forest model with an area under the curve (AUC) of 95,92% for two groups of severity. (F) Variable predictors scores plot for classification of dengue infection according to severity. The variables are shown according to minimal depth and number of trees. The color scale bar ranges from 0 to 6 and represents the minimal and maximum minimal depth. The small dark vertical bars represent the mean of minimal depth for each variable. (G) Lollipop graph showing biological process gene ontology (GO) terms enriched by the 10 genes classified as most predictors of dengue severity.
Figure 9
Figure 9
Commonalities in IFN-related genes across different viral infections. Bubble heatmap with hierarchical clustering using Euclidian metric of 16 IFN-related genes comparing dengue and other viral (COVID-19 and influenza) infections.

Similar articles

Cited by

References

    1. Zhang Q, Liu Z, Moncada-Velez M, Chen J, Ogishi M, Bigio B, et al. . Inborn errors of type I IFN immunity in patients with life-threatening COVID-19. Science (2020) 370:eabd4570. doi: 10.1126/science.abd4570 - DOI - PMC - PubMed
    1. Diamond MS, Ledgerwood JE, Pierson TC. Zika virus vaccine development: progress in the face of new challenges. Annu Rev Med (2019) 70:121–35. doi: 10.1146/ANNUREV-MED-040717-051127 - DOI - PubMed
    1. Redoni M, Yacoub S, Rivino L, Giacobbe DR, Luzzati R, Di Bella S. Dengue: Status of current and under-development vaccines. Rev Med Virol (2020) 30:e2101. doi: 10.1002/RMV.2101 - DOI - PubMed
    1. World Health Organization . Dengue and Severe Dengue: WHO; (2015), online. Available at: https://www.who.int/news-room/fact-sheets/detail/dengue-and-severe-dengue.
    1. Aguiar M, Stollenwerk N. Dengvaxia: age as surrogate for serostatus. Lancet Infect Dis (2018) 18:245. doi: 10.1016/S1473-3099(17)30752-1/ATTACHMENT/0939B4A4-FD49-4C33-9E7E-CD501CCB4274/MMC1.PDF - DOI - PubMed

Publication types