. 2024 Feb 20:15:1354297.
doi: 10.3389/fimmu.2024.1354297. eCollection 2024.

Oral administration of Manuka honey induces IFNγ-dependent resistance to tumor growth that correlates with beneficial modulation of gut microbiota composition

Affiliations

Oral administration of Manuka honey induces IFNγ-dependent resistance to tumor growth that correlates with beneficial modulation of gut microbiota composition

Razan J Masad et al. Front Immunol. .

Abstract

Background: To investigate the potential of Manuka honey (MH) as an immunomodulatory agent in colorectal cancer (CRC) and dissect the underlying molecular and cellular mechanisms.

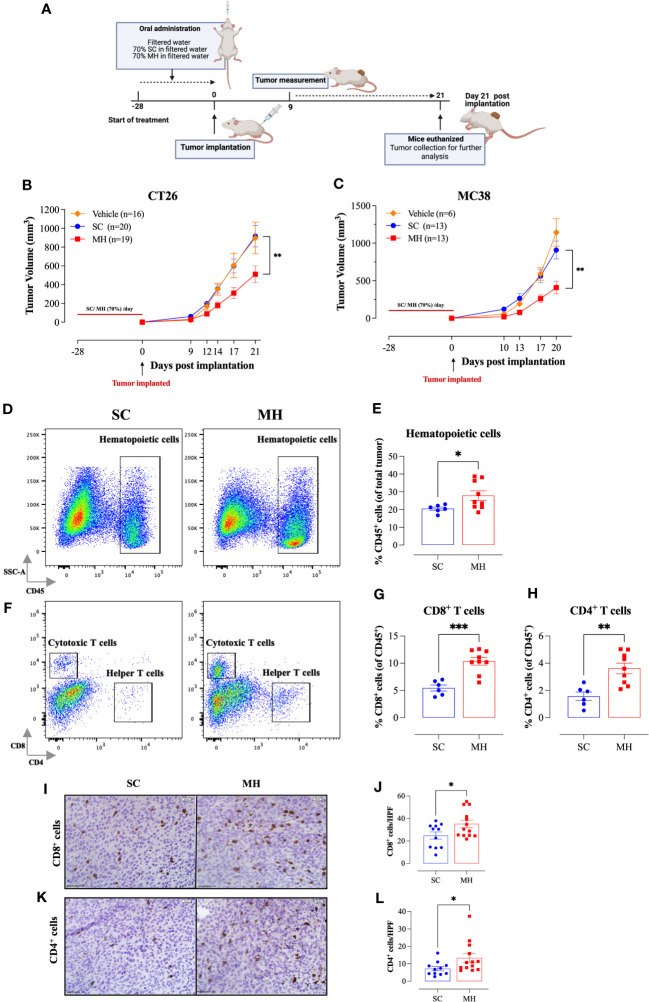
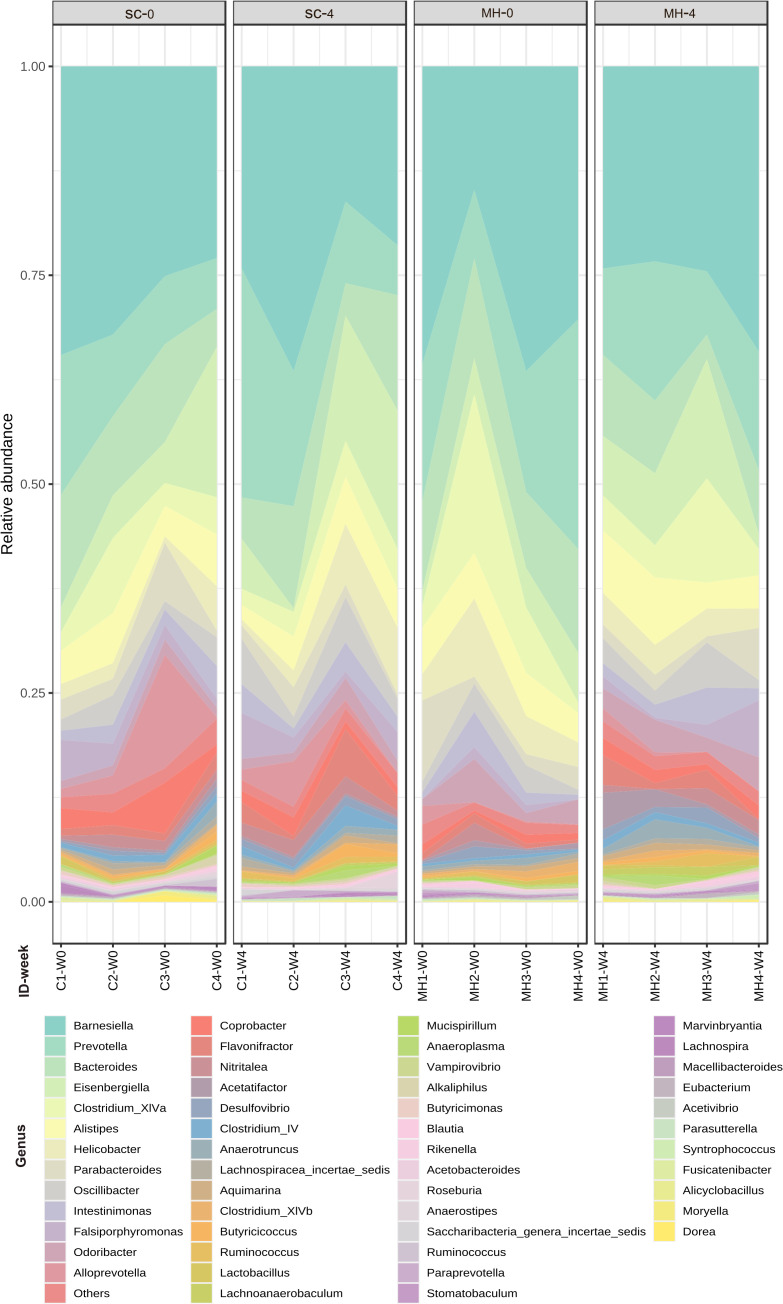
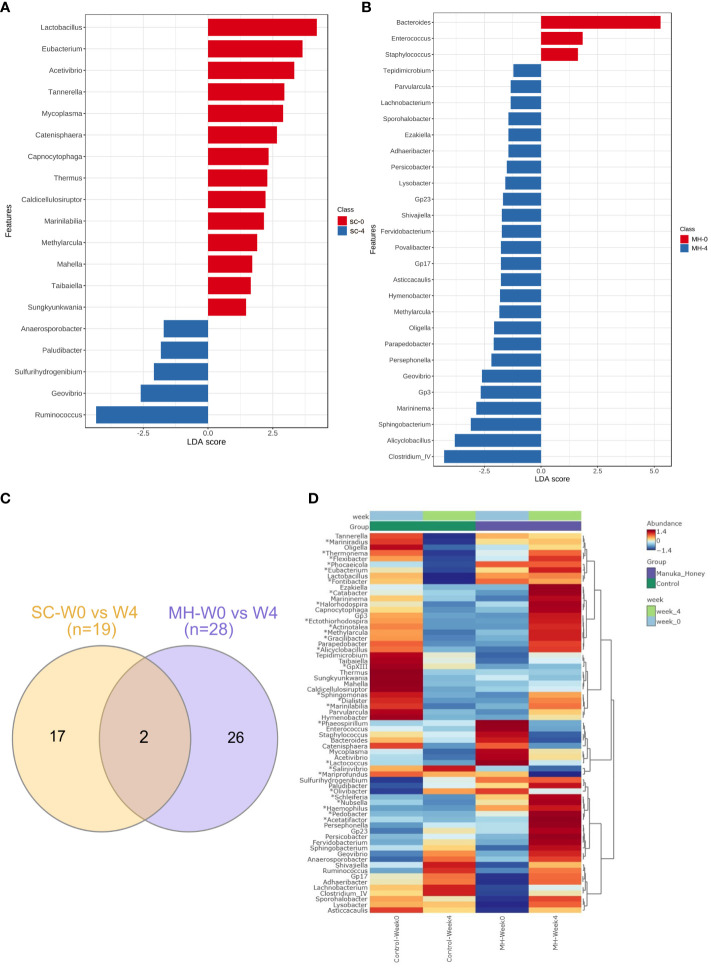
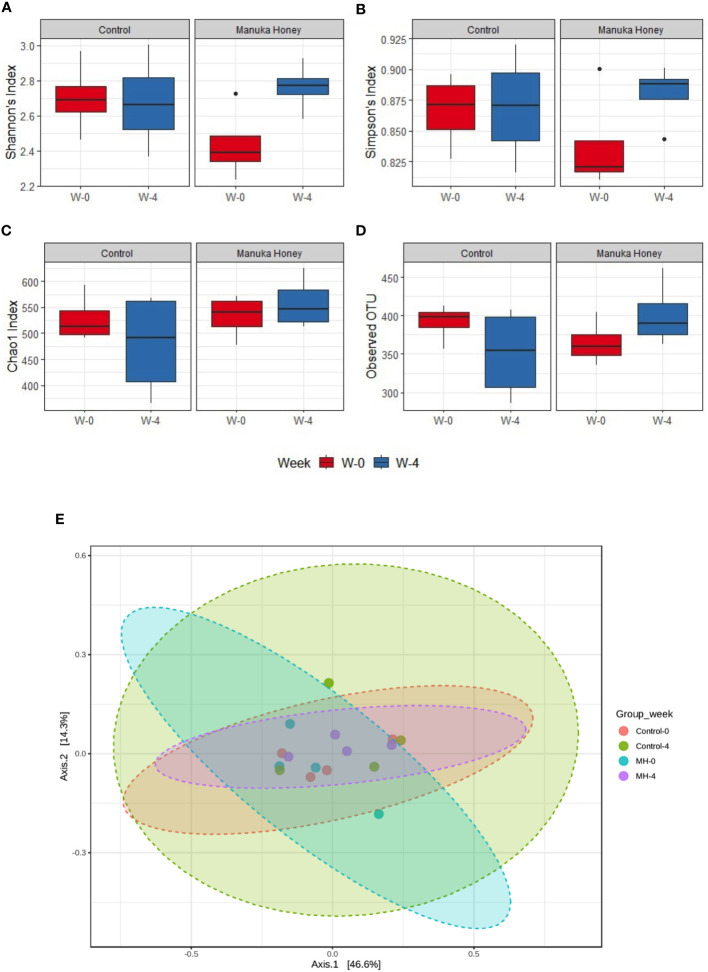
Methods: MH was administered orally over a 4 week-period. The effect of MH treatment on microbiota composition was studied using 16S rRNA sequencing of fecal pellets collected before and after treatment. Pretreated mice were implanted with CRC cells and followed for tumor growth. Tumors and lymphoid organs were analyzed by flow cytometry (FACS), immunohistochemistry and qRT-PCR. Efficacy of MH was also assessed in a therapeutic setting, with oral treatment initiated after tumor implantation. We utilized IFNγ-deficient mice to determine the importance of interferon signaling in MH-induced immunomodulation.

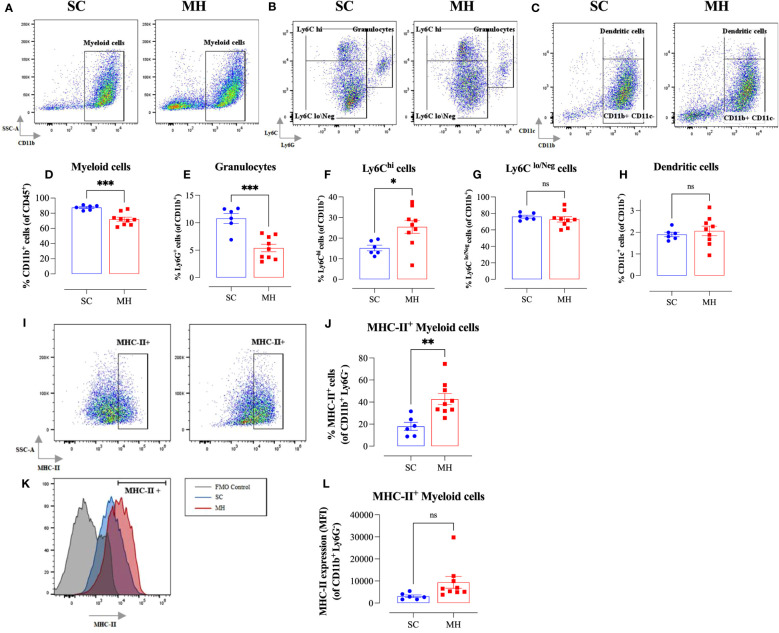
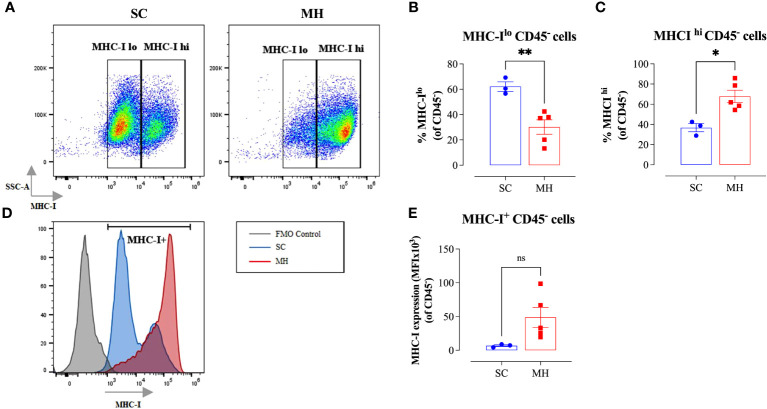
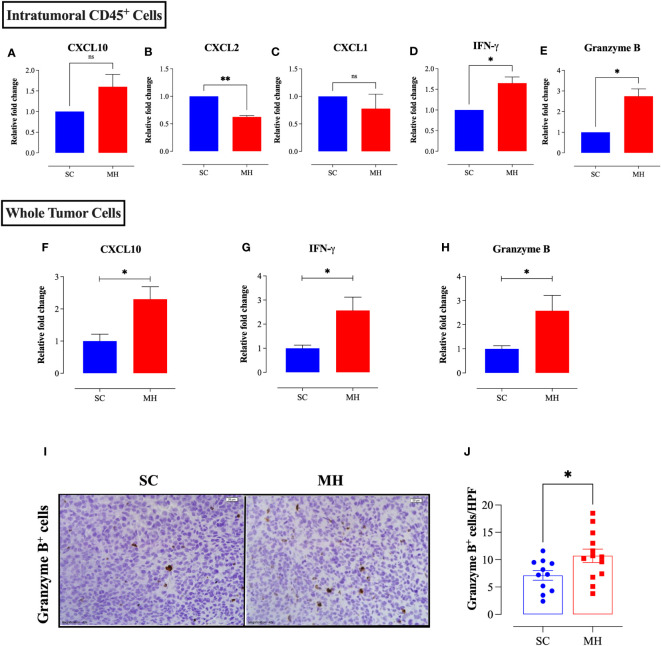
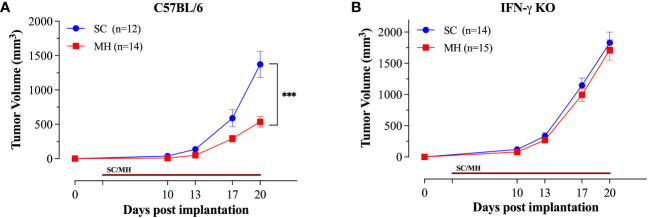
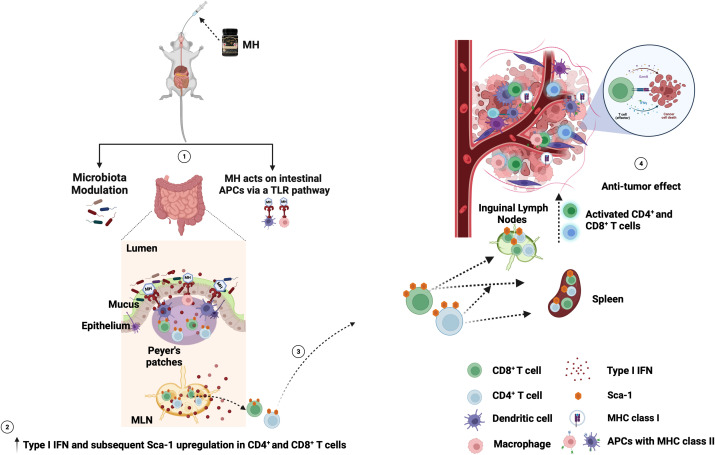
Results: Pretreatment with MH enhanced anti-tumor responses leading to suppression of tumor growth. Evidence for enhanced tumor immunogenicity included upregulated MHC class-II on intratumoral macrophages, enhanced MHC class-I expression on tumor cells and increased infiltration of effector T cells into the tumor microenvironment. Importantly, oral MH was also effective in retarding tumor growth when given therapeutically. Transcriptomic analysis of tumor tissue highlighted changes in the expression of various chemokines and inflammatory cytokines that drive the observed changes in tumor immunogenicity. The immunomodulatory capacity of MH was abrogated in IFNγ-deficient mice. Finally, bacterial 16S rRNA sequencing demonstrated that oral MH treatment induced unique changes in gut microbiota that may well underlie the IFN-dependent enhancement in tumor immunogenicity.

Conclusion: Our findings highlight the immunostimulatory properties of MH and demonstrate its potential utilization in cancer prevention and treatment.

Keywords: Manuka honey; colorectal cancer; immunomodulation; tumor immunogenicity; type I/II IFN.


Conflict of interest statement

The authors declare that the research was conducted in the absence of any commercial or financial relationships that could be construed as a potential conflict of interest.

Figures

Figure 1
Figure 1
Lymphocyte activation in lymphoid tissues following MH treatment. BALB/c mice were orally gavaged with either SC or MH for 4 weeks. Following treatment, lymphoid organs were processed for flow cytometry analysis. Cells from MLNs (A–C), ILNs (D–F), and spleens (G–I) were analyzed to quantify the percentage of Sca-1+ CD8+ T cells (B, E, H), and Sca-1+ CD4+ T cells (C, F, I). Representative dot plots are shown in (A, D, G). The values for individual mice and mean ± SEM are shown. The data is pooled from 5 (A–C), 4 (D–F), and 3 independent experiments (G–I). p values were calculated using the unpaired Student’s t-test, * (p ≤ 0.05), and ** (p ≤ 0.01).
Figure 2
Figure 2
Retardation of tumor growth in MH pre-treated mice correlates with enhanced tumor infiltration by immune cells. (A) A schematic diagram describing the preventative model treatment protocol. Mice were orally gavaged daily with filtered water, 70% SC or 70% MH for 4 consecutive weeks. Following the treatment period, CT26 or MC38 CRC cells were implanted and tumor growth was followed for the subsequent 3 weeks. Mice were euthanized on day 21 post-implantation, and tumors were excised and processed for further analysis. Tumor growth curves of CT26 (B) or MC38 tumor (C) in water-treated, SC-treated, and MH-treated mice are shown. Each data point represents the mean ± SEM of 16-20 mice, pooled from 3 individual experiments. Asterisks denote statistically significant differences between the SC-treated and MH-treated groups. p values were calculated using 2-way ANOVA. Resected tumors were analyzed for the extent of intratumoral immune cells by flow cytometry (D–H) and immunohistochemistry (I–L). Representative dot plots and quantification of percentage of CD45+ immune cells (D, E), CD8+ cytotoxic T cells (F, G), and CD4+ helper T cells (F, H). The values for individual mice and mean ± SEM are shown (SC: n=6, MH: n=9), pooled from 2 independent experiments. (I–L) Tissue sections were analyzed by immunohistochemistry to quantify the number of CD8+ and CD4+ cells. Representative images at 40× magnification (scale bar 20 μm), and the quantitative estimation of the number of CD8+ cells (I, J) and CD4+ cells (K, L) per HPF (high-power field) are presented for each group. The values for individual mice and mean ± SEM are shown (SC: n=11, MH: n=13), pooled from 3 independent experiments. Asterisks denote statistically significant differences between the MH-treated and SC-treated groups. p values were calculated using the unpaired Student’s t-test, * (p ≤ 0.05), ** (p ≤ 0.01), and *** (p ≤ 0.001).
Figure 3
Figure 3
MH treatment alters intratumoral myeloid subpopulations and enhances expression of MHC class II on macrophages. BALB/c mice were orally gavaged with either 70% SC or 70% MH for 4 consecutive weeks, then implanted with CT26 tumor cells. Mice were euthanized on day 21 post-implantation, their tumors were resected, and the percentages of intratumoral myeloid cells were determined by flow cytometry. Representative dot plots and the quantification of the percentages of CD11b+ myeloid cells (A, D), Ly6G+ granulocytes (B, E), Ly6Chi cells (B, F), Ly6Clo/Neg cells (B, G), and CD11c+ dendritic cells (C, H). The values for individual mice and mean ± SEM are shown (SC: n=6, MH: n=9), pooled from 2 independent experiments. Analysis of MHC class II protein expression (I–L). Representative flow plots (I) and the quantification (J) of the percentage of MHC-II+ cells (gated on CD11b+ Ly6G- cells) in SC-treated and MH-treated mice. (K) Representative overlay histograms showing MHC-II expression on CD11b+ Ly6G- myeloid cells of SC-treated and MH-treated mice. The grey histogram indicates staining with FMO control. (L) Median fluorescence intensity of MHC-II+ CD11b+ Ly6G- in SC-treated and MH-treated groups. The values for individual mice and mean ± SEM are shown (SC: n=6, MH: n=9), pooled from 2 independent experiments. Asterisks denote statistically significant differences between the MH-treated and SC-treated groups. p values were calculated using the unpaired Student’s t-test, * (p ≤ 0.05), ** (p ≤ 0.01), *** (p ≤ 0.001), and ns (no statistical significance, p > 0.05).
Figure 4
Figure 4
Enhancement in tumor immunogenicity as a consequence of MH administration. (A–C) Representative flow plots (A) and quantification of the percentage of MHC-Ilo (B) and MHC-Ihi (C) (gated on CD45- cells) in SC-treated and MH-treated mice. (D) Representative overlay histograms showing MHC-I expression on CD45- cells of SC-treated and MH-treated mice. The grey histogram indicates staining with FMO control (E) Median fluorescence intensity of MHC-I+ CD45- cells in SC-treated and MH-treated groups. The values for individual mice and mean ± SEM are shown (SC: n=3, MH: n=5), obtained from 1 experiment. Asterisks denote statistically significant differences between MH-treated and SC-treated groups. p values were calculated using the unpaired Student’s t-test, * (p ≤ 0.05), ** (p ≤ 0.01), and ns (no statistical significance, p > 0.05).
Figure 5
Figure 5
MH treatment alters the expression of chemokines and anti-tumor effector molecules within the tumor microenvironment. CT26 tumor tissues were excised from SC-treated and MH-treated mice on day 21 post-implantation. CD45+ cells were purified from a pool of tumor cells obtained from 4 tumors per group. RNA was extracted from the purified CD45+ cells and used to assess the mRNA levels of CXCL10 (A), CXCL2 (B), CXCL1 (C), IFN-γ (D), and granzyme B (E). The data are expressed as means ± SEM of 2 replicates per group and are representative of 2 independent experiments. (F–H) RNA was extracted from whole tumor tissue and assessed for the relative expression of CXCL10 (F), IFNγ (G) and granzyme B (H) genes. (I, J) Tissue sections were analyzed by immunohistochemistry to quantify the number of granzyme B+ cells. Representative images at 40× magnification (scale bar 20 μm) are presented for each group (I). Quantitative estimation of the number of granzyme B+ cells/HPF (high-power field) is shown in panel (J). The values for individual mice and mean ± SEM are shown (SC: n=11, MH: n=13), pooled from 3 independent experiments. Asterisks denote statistically significant differences between the MH-treated and SC-treated groups. p values were calculated using the unpaired Student’s t-test, * (p ≤ 0.05), ** (p ≤ 0.01), and ns (no statistical significance, p > 0.05).
Figure 6
Figure 6
Therapeutic treatment with oral MH retards tumor growth in an IFNγ-dependent manner. Normal C57BL/6 (A) or IFNγ-deficient (B) mice were implanted with tumor cells and were orally gavaged daily starting on day 3 post implantation with 70% SC or 70% MH for 3 consecutive weeks. Each data point represents the mean ± SEM of the indicated mice within each experimental group, pooled from 2 independent experiments. Asterisks denote statistically significant differences between the SC-treated and MH-treated groups. p values were calculated using 2-way ANOVA, *** (p ≤ 0.001).
Figure 7
Figure 7
Relative abundance of genera detected at the baseline (week 0 before treatment) and in week 4 after treatment with SC or MH. Data shown represent the relative abundance of the genera listed, in each mouse investigated in this study before and after treatment.
Figure 8
Figure 8
Microbiota variations after 4-week treatment. LDA analysis comparing genera pre and post-treatment with CS (A) and MH (B) showed depleted (red) and enriched (blue) in week 4 post-treatment. Venn diagram (C) of shared and unique genera that were significantly different pre- and post-treatment for each of the SC and MH groups. The heatmap (D) shows microbiota fingerprints in each group before and after treatment, with significantly altered genera. Asterisks (*) represent genera with significant differences between MH and CS after 4 weeks of treatment, while the rest are those with significant difference in week 0 compared to week 4 in either treatment group.
Figure 9
Figure 9
Microbiome diversity. (A–D) Show alpha diversity comparison between samples grouped based on treatment type and duration, using Shannon’s index (A); Simpson’s index (B); Chao1 index (C), and observed species (D). Box plots show Q1-median-Q3 with data range. Black dots are outlier values. Principal coordinates (PCo) analysis plots of beta diversity measured by Bray Curtis index (E) for control group and MH group in week 0 vs week 4. All groups are color-coded, and each dot represents an experimental mouse in each group. Although the difference was not statistically significant, (PERMANOVA: F-value: 0.92753; R-squared: 0.13389; p-value: 0.461), week 4 (post-treatment) was distinct from week 0 (pre-treatment) in the MH group.
Figure 10
Figure 10
Schematic diagram of the proposed mechanism of oral MH on anti-tumor immune response. (1) MH treatment either modulates the gut microbiota or induces the TLR pathway. This leads to (2) the enrichment of type I IFN and the subsequent upregulation of Sca-1 on the CD4+ and CD8+ T cells in the gut environment. (3) The Sca-1+ CD4+ and CD8+ T cells migrate from the gut to the periphery (spleen and ILNs). (4) these preactivated T cells then migrate to the TME and induce anti-tumor immune responses. Figure adapted from (61) and created with BioRender.com.

Similar articles

Cited by

References

    1. WHO . Cancer(2022). Available online at: https://www.who.int/news-room/fact-sheets/detail/cancer.
    1. Schreiber RD, Old LJ, Smyth MJ. Cancer immunoediting: integrating immunity’s roles in cancer suppression and promotion. Science. (2011) 331:1565–70. doi: 10.1126/science.1203486 - DOI - PubMed
    1. Thorsson V, Gibbs DL, Brown SD, Wolf D, Bortone DS, Ou Yang TH, et al. . The immune landscape of cancer. Immunity. (2018) 48:812–30 e14. doi: 10.1016/j.immuni.2018.03.023 - DOI - PMC - PubMed
    1. Burnet FM. The concept of immunological surveillance. Prog Exp Tumor Res. (1970) 13:1–27. doi: 10.1159/000386035 - DOI - PubMed
    1. Dunn GP, Old LJ, Schreiber RD. The three Es of cancer immunoediting. Annu Rev Immunol. (2004) 22:329–60. doi: 10.1146/annurev.immunol.22.012703.104803 - DOI - PubMed

Publication types

Substances