

Impact of prenatal marijuana exposure on adolescent brain structural and functional connectivity and behavioural outcomes
- PMID: 38444906
- PMCID: PMC10914455
- DOI: 10.1093/braincomms/fcae001
Impact of prenatal marijuana exposure on adolescent brain structural and functional connectivity and behavioural outcomes
Abstract
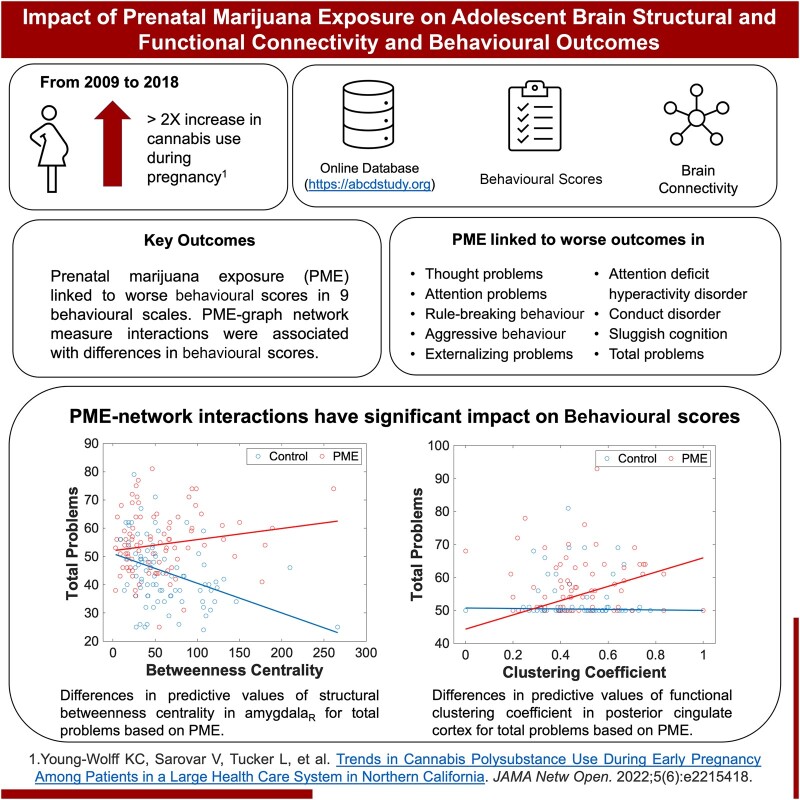
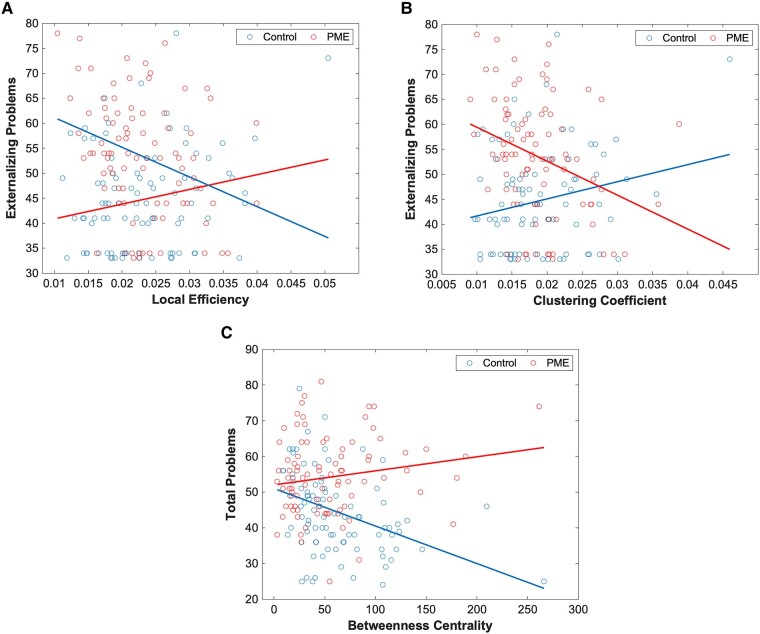
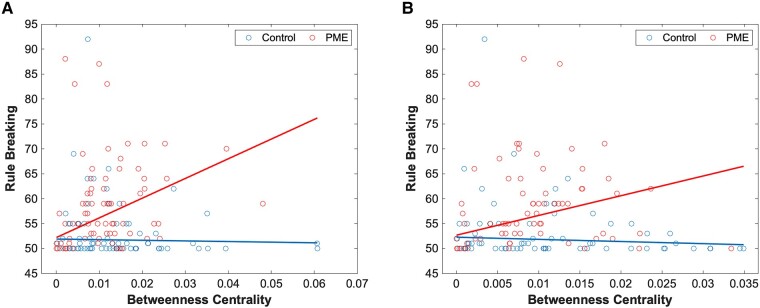
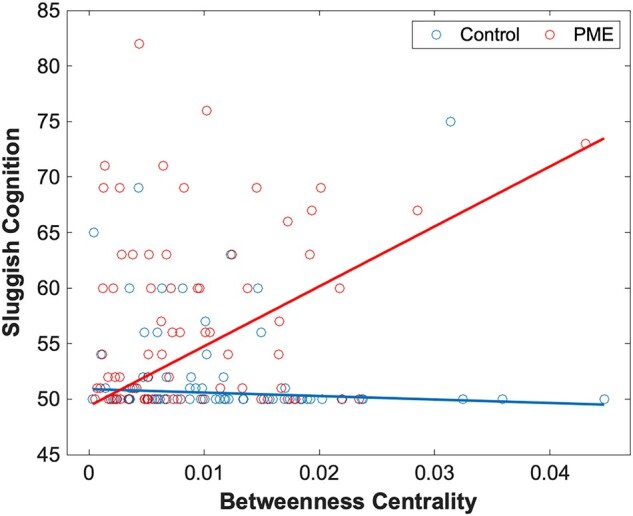
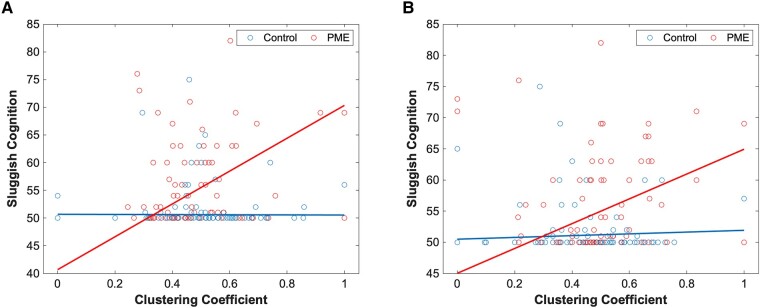
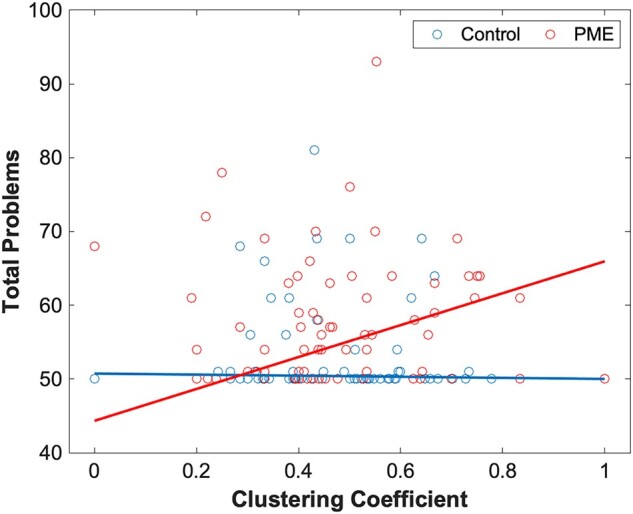
There has been an increase in the number of women using marijuana whilst pregnant. Previous studies have shown that children with prenatal marijuana exposure have developmental deficits in memory and decreased attentiveness. In this study, we assess whether prenatal marijuana exposure is associated with alterations in brain regional morphometry and functional and structural connectivity in adolescents. We downloaded behavioural scores and subject image files from the Adolescent Brain Cognitive DevelopmentSM Study. A total of 178 anatomical and diffusion magnetic resonance imaging files (88 prenatal marijuana exposure and 90 age- and gender-matched controls) and 152 resting-state functional magnetic resonance imaging files (76 prenatal marijuana exposure and 76 controls) were obtained. Behavioural metrics based on the parent-reported child behavioural checklist were also obtained for each subject. The associations of prenatal marijuana exposure with 17 subscales of the child behavioural checklist were calculated. We assessed differences in brain morphometry based on voxel-based and surface-based morphometry in adolescents with prenatal marijuana exposure versus controls. We also evaluated group differences in structural and functional connectivity in adolescents for region-to-region connectivity and graph theoretical metrics. Interactions of prenatal marijuana exposure and graph networks were assessed for impact on behavioural scores. Multiple comparison correction was performed as appropriate. Adolescents with prenatal marijuana exposure had greater abnormal or borderline child behavioural checklist scores in 9 out of 17 subscales. There were no significant differences in voxel- or surface-based morphometry, structural connectivity or functional connectivity between prenatal marijuana exposure and controls. However, there were significant differences in prenatal marijuana exposure-graph network interactions with respect to behavioural scores. There were three structural prenatal marijuana exposure-graph network interactions and seven functional prenatal marijuana exposure-graph network interactions that were significantly associated with behavioural scores. Whilst this study was not able to confirm anatomical or functional differences between prenatal marijuana exposure and unexposed pre-adolescent children, there were prenatal marijuana exposure-brain structural and functional graph network interactions that were significantly associated with behavioural scores. This suggests that altered brain networks may underlie behavioural outcomes in adolescents with prenatal marijuana exposure. More work needs to be conducted to better understand the prognostic value of brain structural and functional network measures in prenatal marijuana exposure.
Keywords: ABCD; functional connectivity; graph networks; prenatal marijuana exposure; structural connectivity.
© The Author(s) 2024. Published by Oxford University Press on behalf of the Guarantors of Brain.
Conflict of interest statement
The authors have conducted this research in the absence of any commercial, financial or personal relationships that would be considered a conflict of interest.
Figures
References
-
- Tavella RA, DE Abreu VOM, Muccillo-Baisch AL, DA Silva Junior FMR. Prevalence of illicit drug use during pregnancy: A global perspective. An Acad Bras Cienc. 2020;92(4):e20200302. - PubMed
-
- Stickrath E. Marijuana use in pregnancy: An updated look at marijuana use and its impact on pregnancy. Clin Obstet Gynecol. 2019;62(1):185–190. - PubMed
-
- Conner SN, Bedell V, Lipsey K, Macones GA, Cahill AG, Tuuli MG. Maternal marijuana use and adverse neonatal outcomes. Obstet Gynecol. 2016;128(4):713–723. - PubMed
Grants and funding
- U24 DA041147/DA/NIDA NIH HHS/United States
- U01 DA051039/DA/NIDA NIH HHS/United States
- U01 DA041120/DA/NIDA NIH HHS/United States
- U01 DA051018/DA/NIDA NIH HHS/United States
- U24 DA041123/DA/NIDA NIH HHS/United States
- U01 DA051038/DA/NIDA NIH HHS/United States
- U01 DA051037/DA/NIDA NIH HHS/United States
- U01 DA041106/DA/NIDA NIH HHS/United States
- U01 DA041117/DA/NIDA NIH HHS/United States
- U01 DA041148/DA/NIDA NIH HHS/United States
- U01 DA041174/DA/NIDA NIH HHS/United States
- UL1 TR002529/TR/NCATS NIH HHS/United States
- U01 DA041093/DA/NIDA NIH HHS/United States
- U01 DA041134/DA/NIDA NIH HHS/United States
- U01 DA041022/DA/NIDA NIH HHS/United States
- U01 DA041156/DA/NIDA NIH HHS/United States
- U01 DA050987/DA/NIDA NIH HHS/United States
- U01 DA051016/DA/NIDA NIH HHS/United States
- R01 MH126970/MH/NIMH NIH HHS/United States
- U01 DA041025/DA/NIDA NIH HHS/United States
- U01 DA050989/DA/NIDA NIH HHS/United States
- U01 DA041089/DA/NIDA NIH HHS/United States
- U01 DA050988/DA/NIDA NIH HHS/United States
- U01 DA041028/DA/NIDA NIH HHS/United States
- U01 DA041048/DA/NIDA NIH HHS/United States
LinkOut - more resources
Full Text Sources