

Staging of progressive supranuclear palsy-Richardson syndrome using MRI brain charts for the human lifespan
- PMID: 38444913
- PMCID: PMC10914441
- DOI: 10.1093/braincomms/fcae055
Staging of progressive supranuclear palsy-Richardson syndrome using MRI brain charts for the human lifespan
Abstract
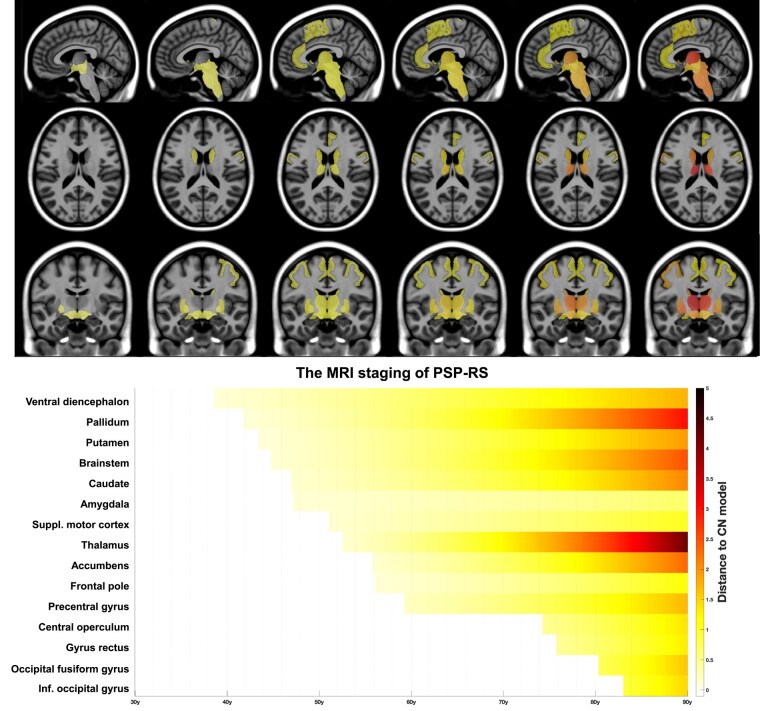
Brain charts for the human lifespan have been recently proposed to build dynamic models of brain anatomy in normal aging and various neurological conditions. They offer new possibilities to quantify neuroanatomical changes from preclinical stages to death, where longitudinal MRI data are not available. In this study, we used brain charts to model the progression of brain atrophy in progressive supranuclear palsy-Richardson syndrome. We combined multiple datasets (n = 8170 quality controlled MRI of healthy subjects from 22 cohorts covering the entire lifespan, and n = 62 MRI of progressive supranuclear palsy-Richardson syndrome patients from the Four Repeat Tauopathy Neuroimaging Initiative (4RTNI)) to extrapolate lifetime volumetric models of healthy and progressive supranuclear palsy-Richardson syndrome brain structures. We then mapped in time and space the sequential divergence between healthy and progressive supranuclear palsy-Richardson syndrome charts. We found six major consecutive stages of atrophy progression: (i) ventral diencephalon (including subthalamic nuclei, substantia nigra, and red nuclei), (ii) pallidum, (iii) brainstem, striatum and amygdala, (iv) thalamus, (v) frontal lobe, and (vi) occipital lobe. The three structures with the most severe atrophy over time were the thalamus, followed by the pallidum and the brainstem. These results match the neuropathological staging of tauopathy progression in progressive supranuclear palsy-Richardson syndrome, where the pathology is supposed to start in the pallido-nigro-luysian system and spreads rostrally via the striatum and the amygdala to the cerebral cortex, and caudally to the brainstem. This study supports the use of brain charts for the human lifespan to study the progression of neurodegenerative diseases, especially in the absence of specific biomarkers as in PSP.
Keywords: MRI; Richardson syndrome; brain charts; progressive supranuclear palsy; staging.
© The Author(s) 2024. Published by Oxford University Press on behalf of the Guarantors of Brain.
Conflict of interest statement
During the past 3 years, V.P. was a local unpaid investigator or sub-investigator for clinical trials granted by NovoNordisk, Biogen, TauRx Pharmaceuticals, Janssen, Green Valley Pharmaceuticals and Alector. He received consultant fees for MRI studies in animals from Motac Neuroscience Ltd, outside the submitted work. The other authors declare no competing financial interests relative to this study.
Figures


Similar articles
-
A data-driven model of brain volume changes in progressive supranuclear palsy.Brain Commun. 2022 Apr 14;4(3):fcac098. doi: 10.1093/braincomms/fcac098. eCollection 2022. Brain Commun. 2022. PMID: 35602649 Free PMC article.
-
Histologic tau lesions and magnetic resonance imaging biomarkers differ across two progressive supranuclear palsy variants.Brain Commun. 2024 Apr 5;6(2):fcae113. doi: 10.1093/braincomms/fcae113. eCollection 2024. Brain Commun. 2024. PMID: 38660629 Free PMC article.
-
Distribution patterns of tau pathology in progressive supranuclear palsy.Acta Neuropathol. 2020 Aug;140(2):99-119. doi: 10.1007/s00401-020-02158-2. Epub 2020 May 7. Acta Neuropathol. 2020. PMID: 32383020 Free PMC article.
-
Brainstem and cerebellar radiological findings in progressive supranuclear palsy.Brain Commun. 2025 Feb 5;7(1):fcaf051. doi: 10.1093/braincomms/fcaf051. eCollection 2025. Brain Commun. 2025. PMID: 39958262 Free PMC article. Review.
-
Clinical Approach to Progressive Supranuclear Palsy.J Mov Disord. 2016 Jan;9(1):3-13. doi: 10.14802/jmd.15060. Epub 2016 Jan 25. J Mov Disord. 2016. PMID: 26828211 Free PMC article. Review.
Cited by
-
Magnetic Resonance Imaging in the Neuroimaging of Progressive Supranuclear Palsy-Parkinsonism Predominant: Limitations and Strengths in Clinical Evaluation.Diagnostics (Basel). 2025 Apr 8;15(8):945. doi: 10.3390/diagnostics15080945. Diagnostics (Basel). 2025. PMID: 40310371 Free PMC article.
-
The associations between common neuroimaging parameters of Progressive Supranuclear Palsy in magnetic resonance imaging and non-specific inflammatory factors - pilot study.Front Immunol. 2024 Aug 8;15:1458713. doi: 10.3389/fimmu.2024.1458713. eCollection 2024. Front Immunol. 2024. PMID: 39176092 Free PMC article.
-
Comprehensive mapping of synaptic vesicle protein 2A (SV2A) in health and neurodegenerative diseases: a comparative analysis with synaptophysin and ground truth for PET-imaging interpretation.Acta Neuropathol. 2024 Oct 30;148(1):58. doi: 10.1007/s00401-024-02816-9. Acta Neuropathol. 2024. PMID: 39476256
-
The Genetic Background of the Immunological and Inflammatory Aspects of Progressive Supranuclear Palsy.Int J Mol Sci. 2025 Apr 22;26(9):3927. doi: 10.3390/ijms26093927. Int J Mol Sci. 2025. PMID: 40362170 Free PMC article. Review.
References
Grants and funding
LinkOut - more resources
Full Text Sources
Miscellaneous