Development of Serum Lactate Level-Based Nomograms for Predicting Diabetic Kidney Disease in Type 2 Diabetes Mellitus Patients
- PMID: 38445169
- PMCID: PMC10913800
- DOI: 10.2147/DMSO.S453543
Development of Serum Lactate Level-Based Nomograms for Predicting Diabetic Kidney Disease in Type 2 Diabetes Mellitus Patients
Abstract
Purpose: To establish nomograms integrating serum lactate levels and traditional risk factors for predicting diabetic kidney disease (DKD) in type 2 diabetes mellitus (T2DM) patients.
Patients and methods: A total of 570 T2DM patients and 100 healthy subjects were enrolled. T2DM patients were categorized into normal and high lactate groups. Univariate and multivariate logistic regression analyses were employed to identify independent predictors for DKD. Then, nomograms for predicting DKD were established, and the model performance was evaluated using the area under the receiver operating characteristic curve (AUC), calibration, and decision curve analysis (DCA).
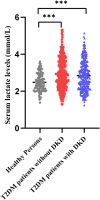
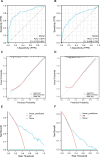
Results: T2DM patients exhibited higher lactate levels compared to those in healthy subjects. Glucose, platelet, uric acid, creatinine, and hypertension were independent factors for DKD in T2DM patients with normal lactate levels, while diabetes duration, creatinine, total cholesterol, and hypertension were indicators in high lactate levels group (P<0.05). The AUC values were 0.834 (95% CI, 0.776 to 0.891) and 0.741 (95% CI, 0.688 to 0.795) for nomograms in both normal lactate and high lactate groups, respectively. The calibration curve demonstrated excellent agreement of fit. Furthermore, the DCA revealed that the threshold probability and highest Net Yield were 17-99% and 0.36, and 24-99% and 0.24 for the models in normal lactate and high lactate groups, respectively.
Conclusion: The serum lactate level-based nomogram models, combined with traditional risk factors, offer an effective tool for predicting DKD probability in T2DM patients. This approach holds promise for early risk assessment and tailored intervention strategies.
Keywords: diabetic kidney disease; nomograms; prediction model; risk factors; serum lactate.
© 2024 Jiang et al.
Conflict of interest statement
The authors declare that they have no competing interests.
Figures


Similar articles
-
Development and validation of a novel nomogram to predict diabetic kidney disease in patients with type 2 diabetic mellitus and proteinuric kidney disease.Int Urol Nephrol. 2023 Jan;55(1):191-200. doi: 10.1007/s11255-022-03299-x. Epub 2022 Jul 23. Int Urol Nephrol. 2023. PMID: 35870041
-
Development and validation of a risk prediction model for diabetic kidney disease in patients with diabetic retinopathy.Front Endocrinol (Lausanne). 2025 May 5;16:1499866. doi: 10.3389/fendo.2025.1499866. eCollection 2025. Front Endocrinol (Lausanne). 2025. PMID: 40391008 Free PMC article.
-
[Blood Lipid Indicators and Different Clinical Classifications of Dyslipidemia and Diabetic Kidney Disease: Correlation and Predictive Value].Sichuan Da Xue Xue Bao Yi Xue Ban. 2023 Sep;54(5):1013-1018. doi: 10.12182/20230960103. Sichuan Da Xue Xue Bao Yi Xue Ban. 2023. PMID: 37866961 Free PMC article. Chinese.
-
Developing screening tools to estimate the risk of diabetic kidney disease in patients with type 2 diabetes mellitus.Technol Health Care. 2024;32(3):1807-1818. doi: 10.3233/THC-230811. Technol Health Care. 2024. PMID: 37980579
-
Construction of a Nomogram-Based Prediction Model for the Risk of Diabetic Kidney Disease in T2DM.Diabetes Metab Syndr Obes. 2024 Jan 12;17:215-225. doi: 10.2147/DMSO.S442925. eCollection 2024. Diabetes Metab Syndr Obes. 2024. PMID: 38229907 Free PMC article.
Cited by
-
Mechanisms for Regulatory Effects of Exercise on Metabolic Diseases from the Lactate-Lactylation Perspective.Int J Mol Sci. 2025 Apr 8;26(8):3469. doi: 10.3390/ijms26083469. Int J Mol Sci. 2025. PMID: 40331975 Free PMC article. Review.
-
Lactate and lactylation in the kidneys: Current advances and prospects (Review).Int J Mol Med. 2025 Aug;56(2):121. doi: 10.3892/ijmm.2025.5562. Epub 2025 Jun 6. Int J Mol Med. 2025. PMID: 40476573 Free PMC article. Review.
References
-
- International Diabetes Federation. IDF Diabetes Atlas, 10th edition; 2021. Available from: https://www.diabetesatlas.org. Accessed February 22, 2024.
LinkOut - more resources
Full Text Sources

