. 2024 Mar;11(2):023501.
doi: 10.1117/1.JMI.11.2.023501. Epub 2024 Mar 4.

Dual-energy computed tomography imaging with megavoltage and kilovoltage X-ray spectra

Affiliations

Dual-energy computed tomography imaging with megavoltage and kilovoltage X-ray spectra

Giavanna Jadick et al. J Med Imaging (Bellingham). 2024 Mar.

Abstract

Purpose: Single-energy computed tomography (CT) often suffers from poor contrast yet remains critical for effective radiotherapy treatment. Modern therapy systems are often equipped with both megavoltage (MV) and kilovoltage (kV) X-ray sources and thus already possess hardware for dual-energy (DE) CT. There is unexplored potential for enhanced image contrast using MV-kV DE-CT in radiotherapy contexts.

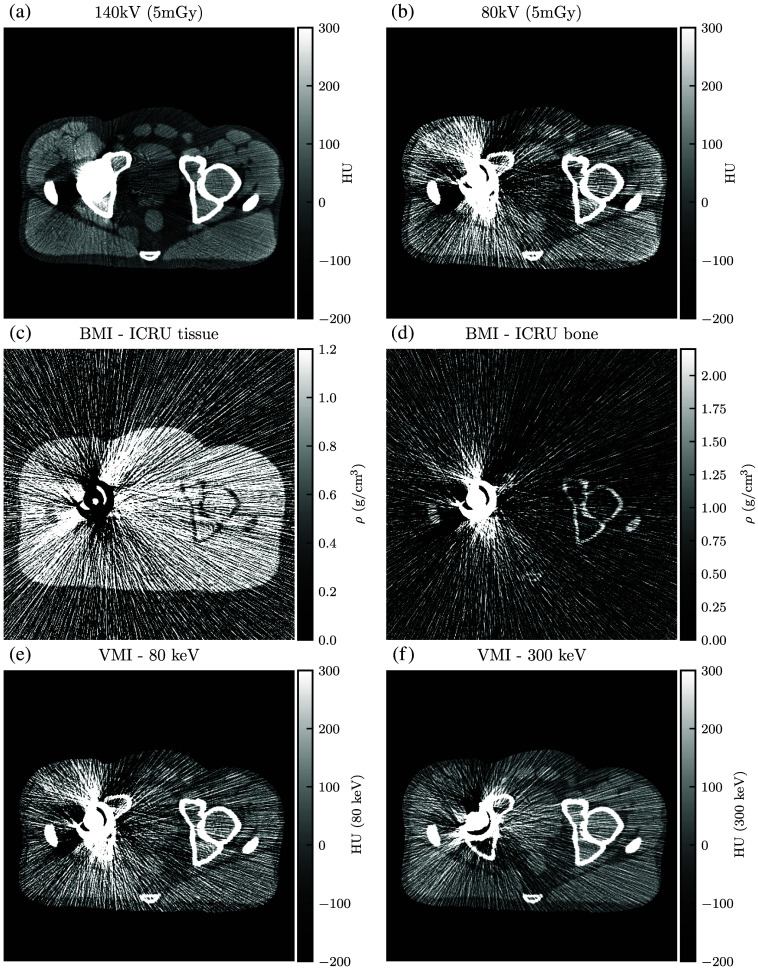
Approach: A single-line integral toy model was designed for computing basis material signal-to-noise ratio (SNR) using estimation theory. Five dose-matched spectra (3 kV, 2 MV) and three variables were considered: spectral combination, spectral dose allocation, and object material composition. The single-line model was extended to a simulated CT acquisition of an anthropomorphic phantom with and without a metal implant. Basis material sinograms were computed and synthesized into virtual monoenergetic images (VMIs). MV-kV and kV-kV VMIs were compared with single-energy images.

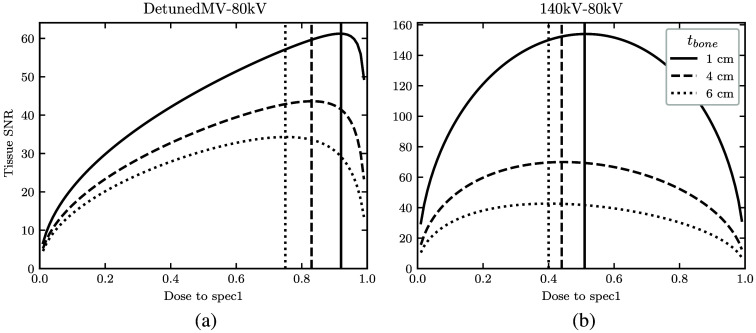
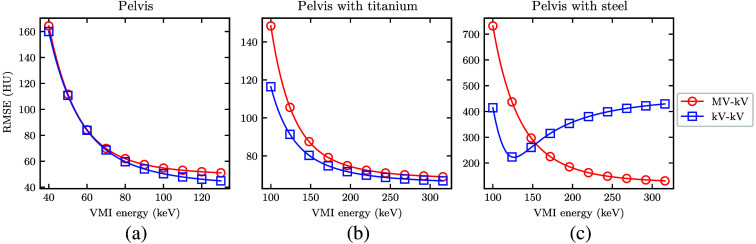
Results: The 80 kV-140 kV pair typically yielded the best SNRs, but for bone thicknesses >8 cm, the detunedMV-80 kV pair surpassed it. Peak MV-kV SNR was achieved with 90% dose allocated to the MV spectrum. In CT simulations of the pelvis with a steel implant, MV-kV VMIs yielded a higher contrast-to-noise ratio (CNR) than single-energy CT and kV-kV DE-CT. Without steel, the MV-kV VMIs produced higher contrast but lower CNR than single-energy CT.

Conclusions: This work analyzes MV-kV DE-CT imaging and assesses its potential advantages. The technique may be used for metal artifact correction and generation of VMIs with higher native contrast than single-energy CT. Improved denoising is generally necessary for greater CNR without metal.

Keywords: basis material decomposition; computed tomography; dual-energy; estimation theory; megavoltage imaging; simulation.


Figures

Fig. 1
Fig. 1
The modeled detective efficiency function η(E).
Fig. 2
Fig. 2
(a) and (b) The five spectra with magnitude scaled to deliver 1  μGy dose.
Fig. 3
Fig. 3
The computational phantom imaged (a) without and (b) with a metal hip replacement as indicated by the arrow. Contrast levels correspond to noiseless 80 keV VMIs. In the modeled hip prosthesis, the femoral head and outer shell were either titanium or stainless steel, and the inner lining was PMMA. CNR was computed using the delineated ROIs, and RMSE was evaluated within the phantom.
Fig. 4
Fig. 4
Linear attenuation coefficients of metals common in modern hip prostheses (cobalt-chromium alloys, titanium alloys, and surgical-grade stainless steel) in (a) the keV energy range and (b) the MeV energy range.
Fig. 5
Fig. 5
Heatmap of peak tissue SNR as a function of bone thickness for all dual-energy spectral combinations.
Fig. 6
Fig. 6
Heatmap of peak bone SNR as a function of bone thickness for all dual-energy spectral combinations.
Fig. 7
Fig. 7
With 1, 4, or 6 cm bone thickness, curve of bone SNR as a function of dose allocated to the high-energy spectrum for (a) the detunedMV-80 kV and (b) 140 kV-80 kV spectral pairs.
Fig. 8
Fig. 8
Maximum SNR for tissue (solid lines, left scale) and bone (dashed lines, right scale) for the 140 kV-80 kV (kV-kV, square marker) and detunedMV-80 kV (MV-kV, circle marker) spectral combinations as a function of bone thickness.
Fig. 9
Fig. 9
(a)–(c) CNR in the detunedMV-80kV (MV-kV) and 140kV-80kV (kV-kV) VMIs as a function of energy, with horizontal lines at the CNR of each kV single-energy CT acquisition. The total dose of the dual-energy scans was equivalent to the dose of the single-energy scans (10 mGy).
Fig. 10
Fig. 10
(a)–(c) Measured contrast (numerator of the CNR) in the detunedMV-80 kV (MV-kV) and 140 kV-80 kV (kV-kV) VMIs as a function of energy, with horizontal lines at the value of each dose-matched kV single-energy CT acquisition.
Fig. 11
Fig. 11
(a)–(c) Measured noise (denominator of the CNR) in the detunedMV-80 kV (MV-kV) and 140 kV-80 kV (kV-kV) VMIs as a function of energy, with horizontal lines at the value of each dose-matched kV single-energy CT acquisition.
Fig. 12
Fig. 12
(a)–(c) RMSE in the detunedMV-80kV (MV-kV) and 140kV-80kV (kV-kV) VMIs as a function of energy. RMSE was calculated relative to the monoenergetic ground truth XCAT.
Fig. 13
Fig. 13
(a) and (b) Single-energy CT images, (c) and (d) BMIs, and (e) and (f) VMIs for the 140 kV-80 kV DE-CT acquisition of the pelvis with no hip replacement. The VMIs correct the beam hardening visible in the single-energy CT images.
Fig. 14
Fig. 14
(a) and (b) Single-energy images, (c) and (d) BMIs, and (e) and (f) VMIs for the detunedMV-80 kV DE-CT acquisition of the pelvis with no hip replacement. VMI synthesis corrects for the beam hardening in the 80 kV single-energy image but results in increased noise from the detunedMV single-energy image.
Fig. 15
Fig. 15
(a) and (b) Single-energy images, (c) and (d) BMIs, and (e) and (f) VMIs for the 140 kV-80 kV DE-CT acquisition with titanium hip replacement. In the VMIs, the beam hardening artifact of the single-energy images has been corrected, but there is residual streaking.
Fig. 16
Fig. 16
(a) and (b) Single-energy images, (c) and (d) BMIs, and (e) and (f) VMIs for the detunedMV-80 kV DE-CT acquisition with titanium hip replacement. The 300 keV VMI does not display streaking or beam hardening artifacts, but it shows a similar noise profile as the detunedMV single-energy image.
Fig. 17
Fig. 17
(a) and (b) Single-energy images, (c) and (d) BMIs, and (e) and (f) VMIs for the 140 kV-80 kV DE-CT acquisition with stainless steel hip replacement. Both single-energy images and VMIs suffer from severe streaking artifacts.
Fig. 18
Fig. 18
(a) and (b) Single-energy images, (c) and (d) BMIs, and (e) and (f) VMIs for the detunedMV-80 kV DE-CT acquisition with stainless steel hip replacement. The 300 keV VMI highly alleviates the streaking artifact.
Fig. 19
Fig. 19
(a)–(i) The dose-matched, beam-hardening corrected SE-CT images for each phantom (column) and kV spectrum (row). Images are shown with a window width of 500 HU and level of 50 HU.

Similar articles

Cited by

References

    1. Pereira G. C., Traughber M., Muzic R. F., “The role of imaging in radiation therapy planning: past, present, and future,” Biomed. Res. Int. 2014, 231090 (2014).10.1155/2014/231090 - DOI - PMC - PubMed
    1. Alaei P., Spezi E., “Imaging dose from cone beam computed tomography in radiation therapy,” Physics Med. 31, 647–658 (2015).PHYME210.1016/j.ejmp.2015.06.003 - DOI - PubMed
    1. Marin D., et al. , “State of the art: dual-energy CT of the abdomen,” Radiology 271, 327–342 (2014).RADLAX10.1148/radiol.14131480 - DOI - PubMed
    1. Rigie D. S., La Rivière P. J., “Optimizing spectral CT parameters for material classification tasks,” Phys. Med. Biol. 61(12), 4599–4622 (2016).PHMBA710.1088/0031-9155/61/12/4599 - DOI - PMC - PubMed
    1. Kruis M. F., “Improving radiation physics, tumor visualisation, and treatment quantification in radiotherapy with spectral or dual-energy CT,” J. Appl. Clin. Med. Phys. 23(1), e13468 (2022)10.1002/acm2.13468 - DOI - PMC - PubMed