. 2024 Jan 18;4(2):100262.
doi: 10.1016/j.xjidi.2024.100262. eCollection 2024 Mar.

Assessing Longitudinal Treatment Efficacies and Alterations in Molecular Markers Associated with Glutamatergic Signaling and Immune Checkpoint Inhibitors in a Spontaneous Melanoma Mouse Model

Affiliations

Assessing Longitudinal Treatment Efficacies and Alterations in Molecular Markers Associated with Glutamatergic Signaling and Immune Checkpoint Inhibitors in a Spontaneous Melanoma Mouse Model

Kevinn Eddy et al. JID Innov. .

Abstract

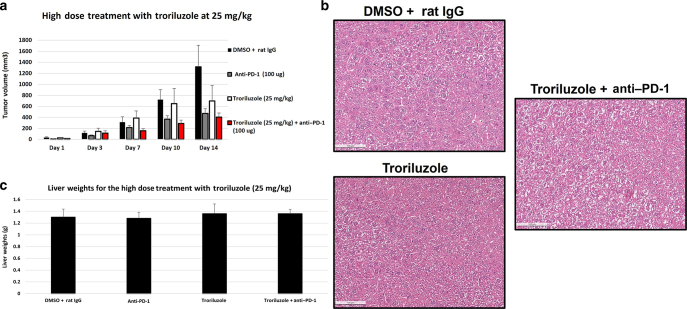
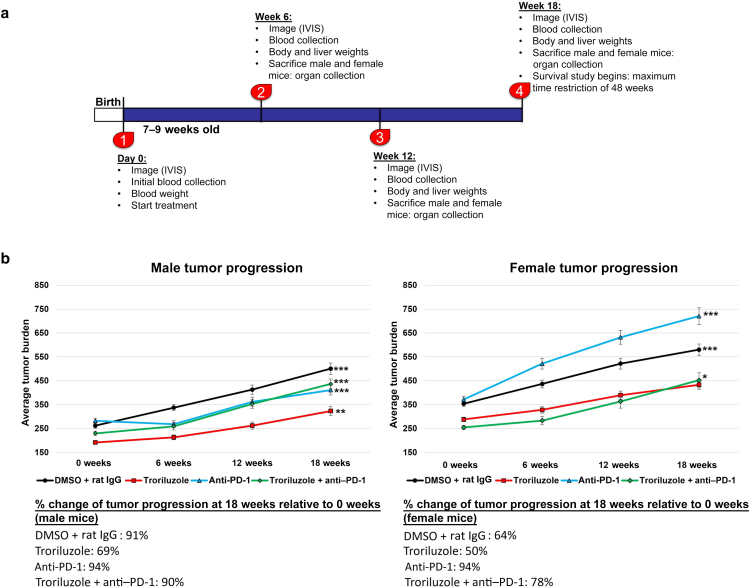
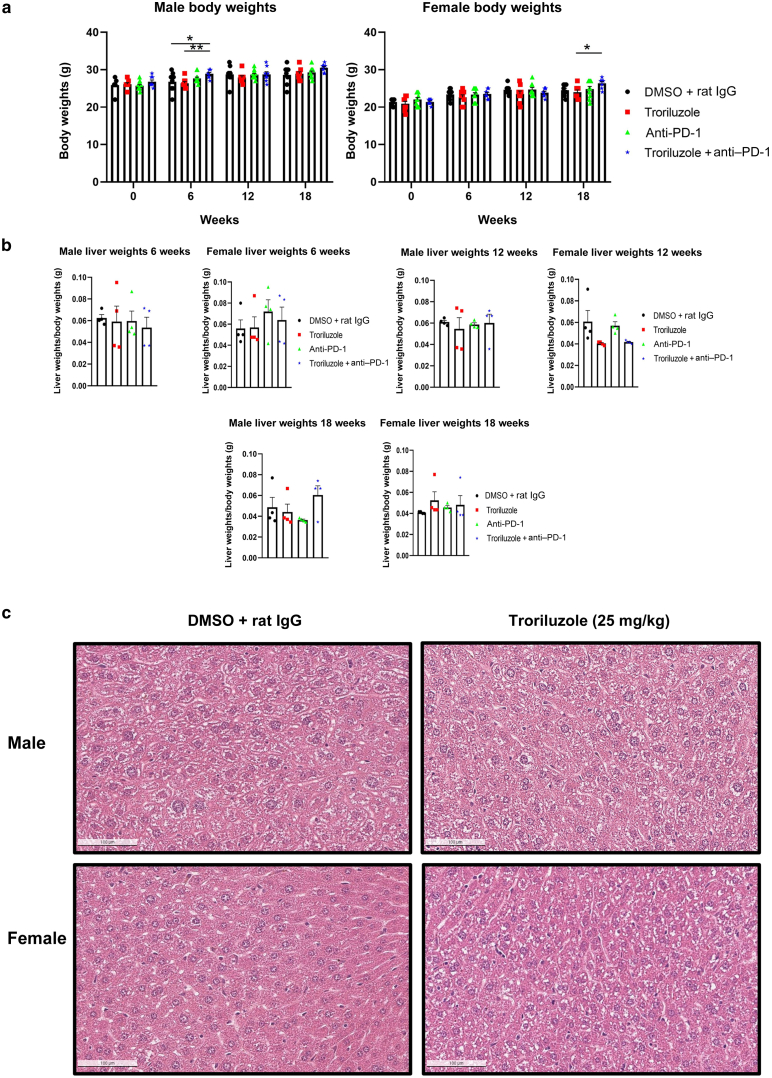
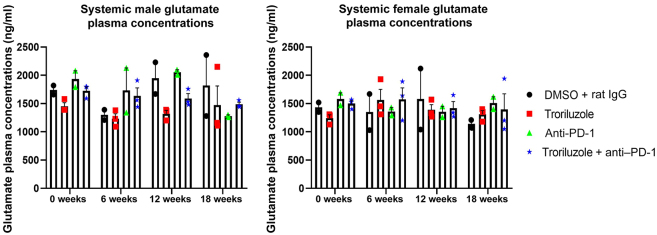
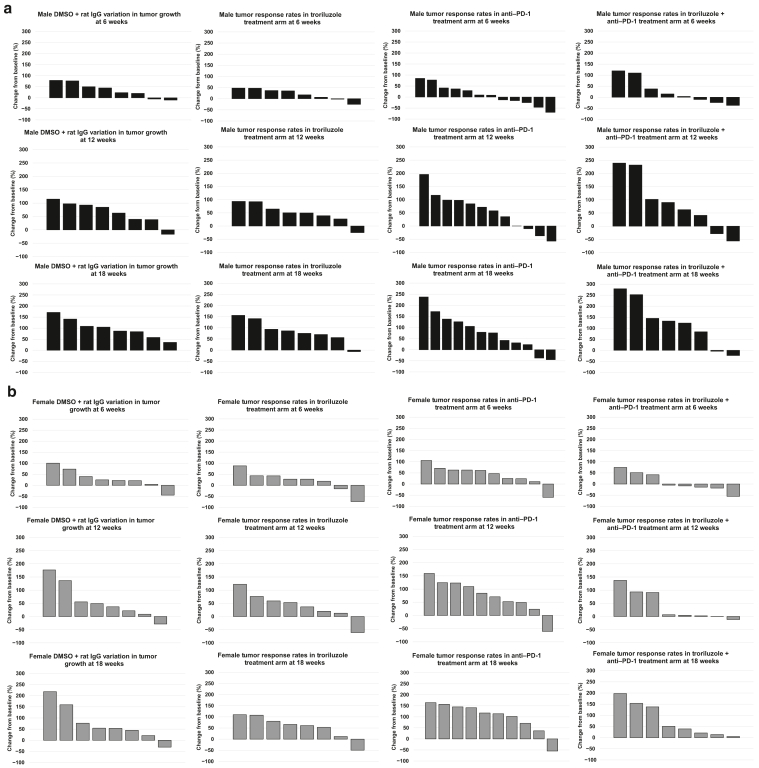
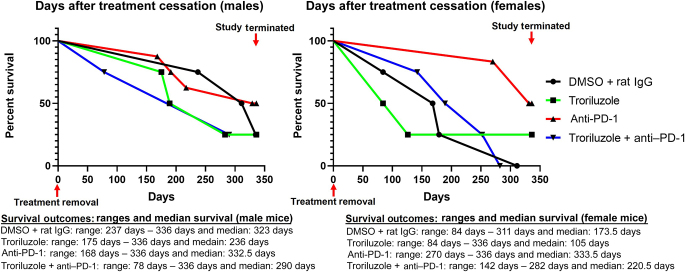
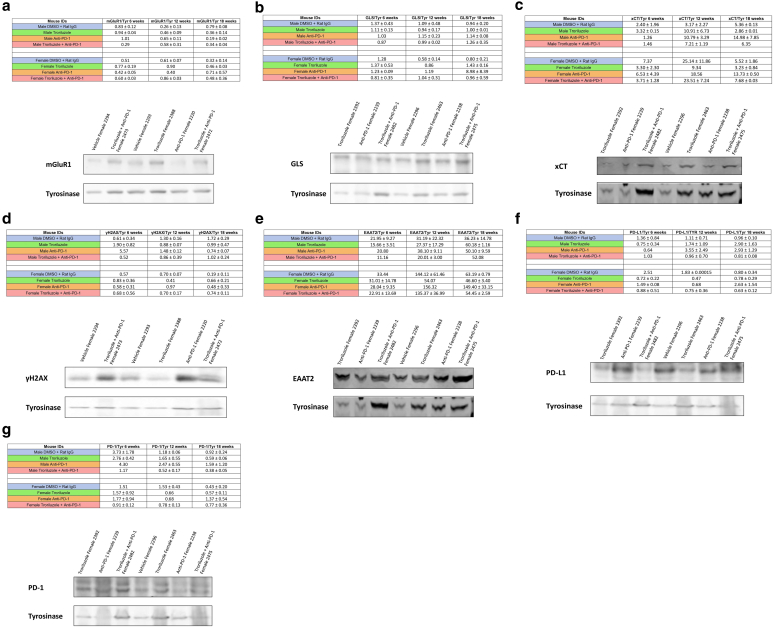
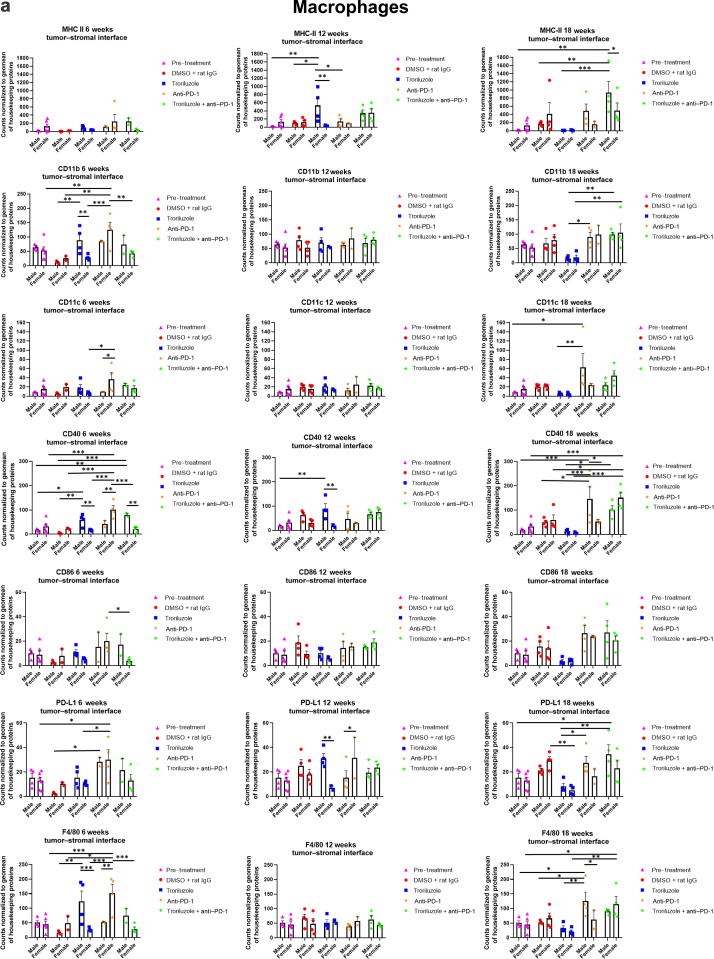
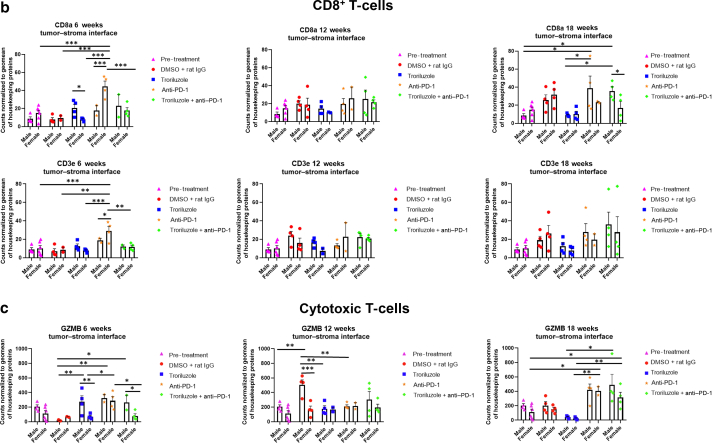
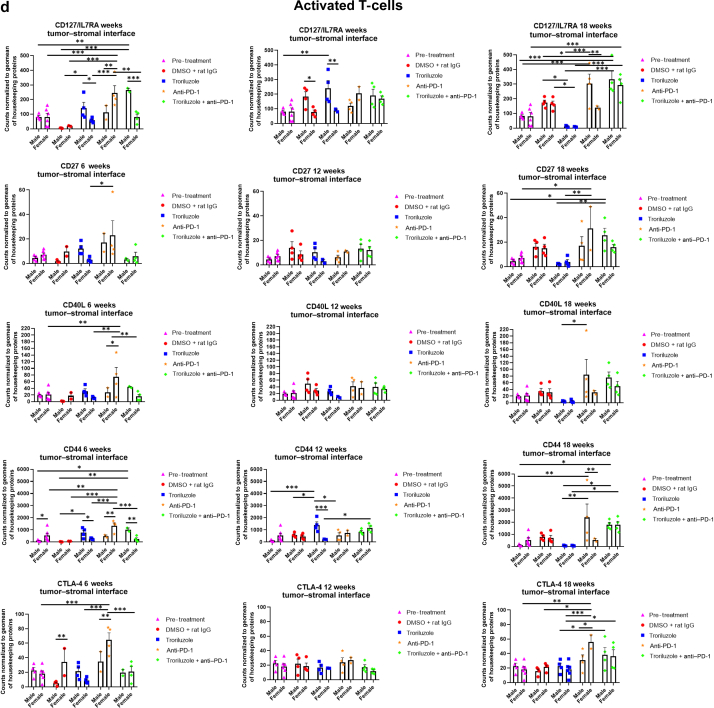
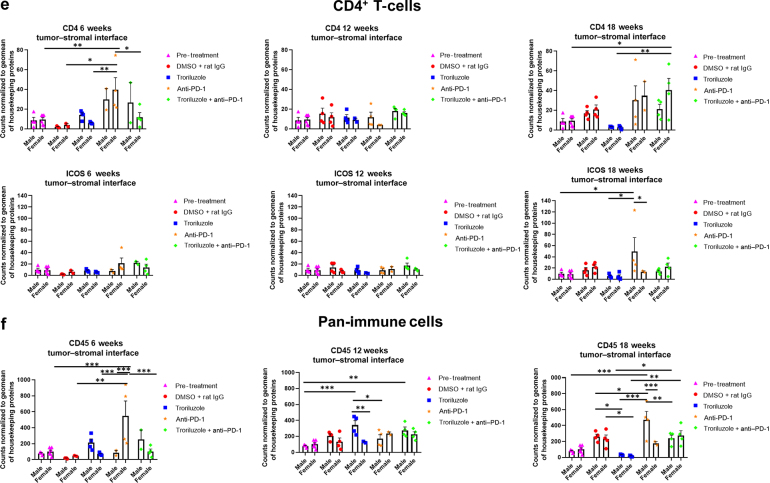
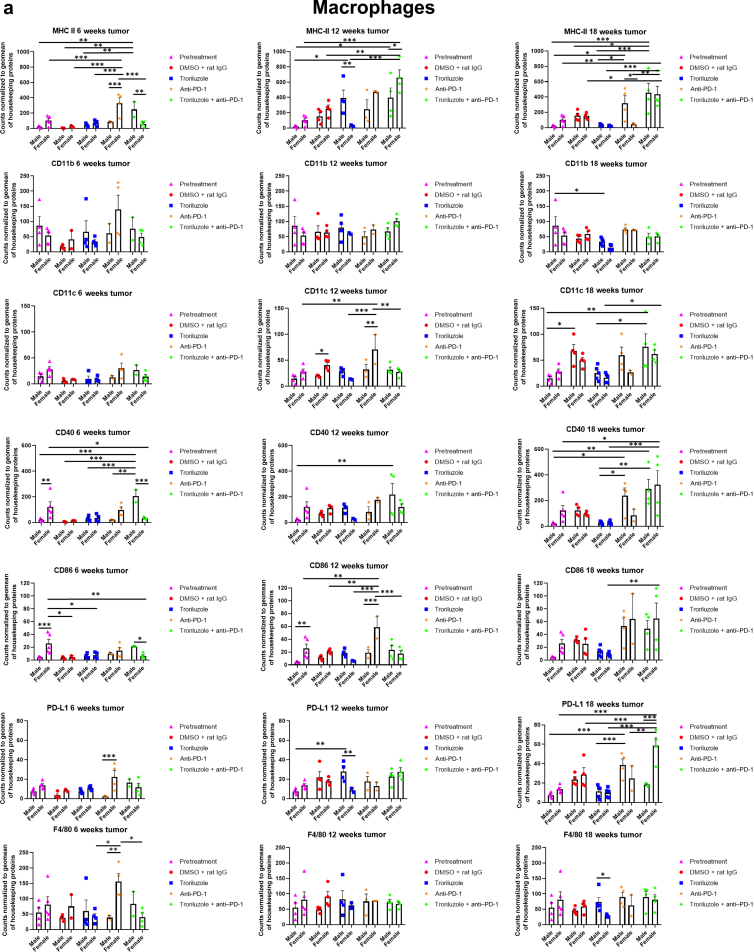
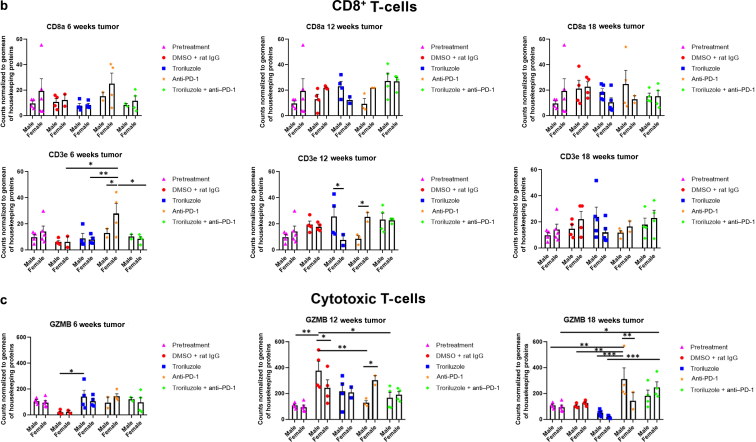
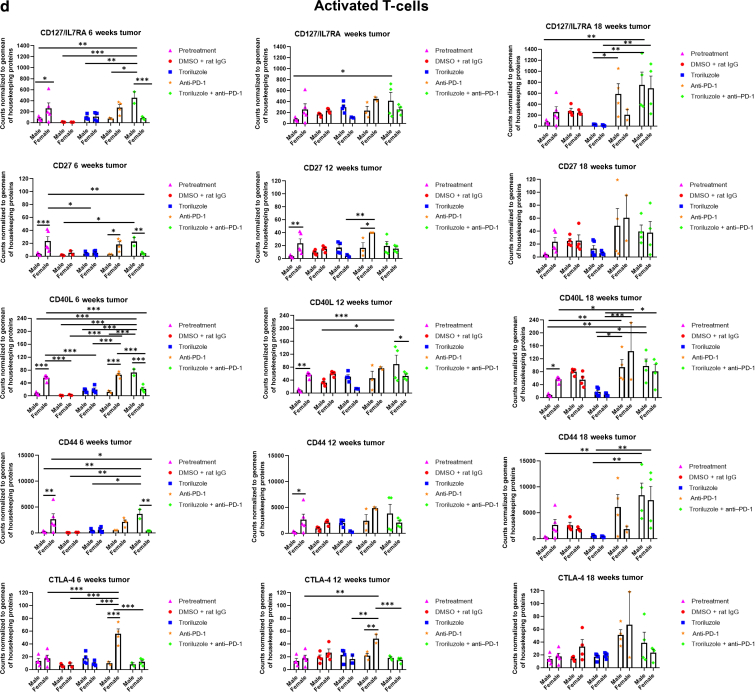
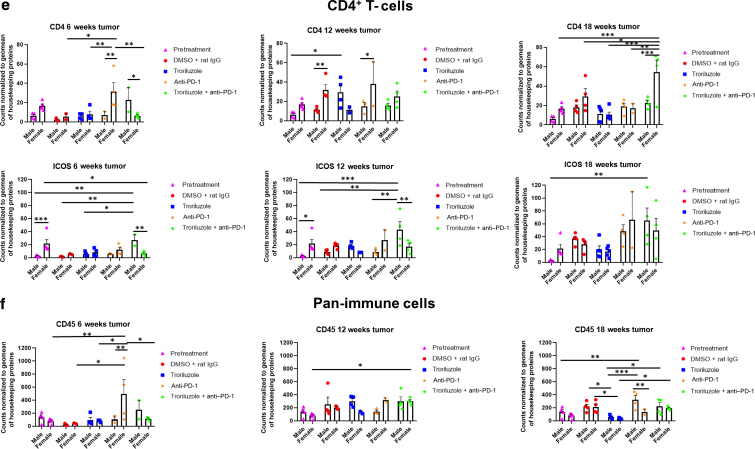
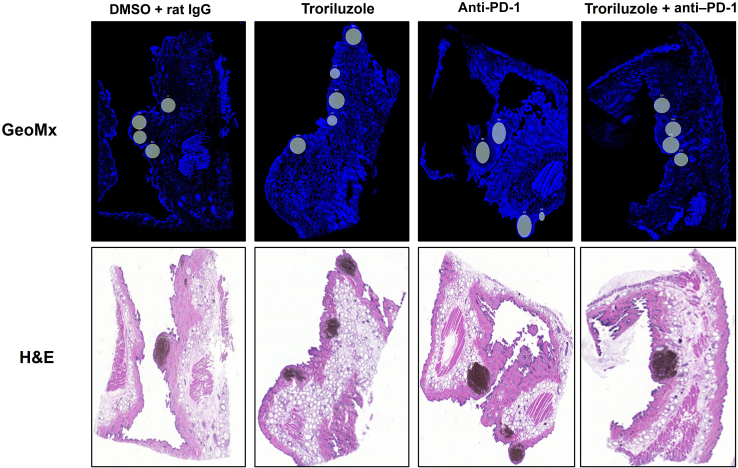
Previous work done by our laboratory described the use of an immunocompetent spontaneous melanoma-prone mouse model, TGS (TG-3/SKH-1), to evaluate treatment outcomes using inhibitors of glutamatergic signaling and immune checkpoint for 18 weeks. We showed a significant therapeutic efficacy with a notable sex-biased response in male mice. In this follow-up 18-week study, the dose of the glutamatergic signaling inhibitor was increased (from 1.7 mg/kg to 25 mg/kg), which resulted in improved responses in female mice but not male mice. The greatest reduction in tumor progression was observed in male mice treated with single-agent troriluzole and anti-PD-1. Furthermore, a randomly selected group of mice was removed from treatment after 18 weeks and maintained for up to an additional 48 weeks demonstrating the utility of the TGS mouse model to perform a ≥1-year preclinical therapeutic study in a physiologically relevant tumor-host environment. Digital spatial imaging analyses were performed in tumors and tumor microenvironments across treatment modalities using antibody panels for immune cell types and immune cell activation. The results suggest that immune cell populations and cytotoxic activities of T cells play critical roles in treatment responses in these mice. Examination of a group of molecular protein markers based on the proposed mechanisms of action of inhibitors of glutamatergic signaling and immune checkpoint showed that alterations in expression levels of xCT, γ-H2AX, EAAT2, PD-L1, and PD-1 are likely associated with the loss of treatment responses. These results suggest the importance of tracking changes in molecular markers associated with the mechanism of action of therapeutics over the course of a longitudinal preclinical therapeutic study in spatial and temporal manners.

Keywords: Cancer biology; Drug development; Melanoma; Methods/tools/techniques; Mouse models.


Figures

Figure 1
Figure 1
Allograft melanoma model. (a) Five C57BL/6 male mice were used for each treatment group. One hundred thousand MASS20 cells were inoculated into both flanks of C57BL/6 mice. When the tumor volumes reached 60–70 mm3, the tumor-bearing mice were randomly divided into DMSO + rat IgG, anti–PD-1 (100 μg/mouse/injection), troriluzole (25 mg/kg), and troriluzole + anti–PD-1 (same dose as single-agent treatments) groups. Treatments were terminated once the tumor burden reached Rutgers University IACUC tumor burden limits (approximately 1200 mm3) in any group. In a, the tumor volume data are shown until day 14 when DMSO + rat IgG treatment arm reached the tumor burden limits. Data are presented as average tumor volume ± SEM. (b) Representative images of liver H&E staining (bar = 100 μM) of DMSO + rat IgG (n = 2 males), troriluzole (n = 3 males), and troriluzole + anti–PD-1 (n = 3 males). (c) Average liver weights ± SEM. Liver samples were taken from all 5 C57BL/6 mice used in the allograft study at the termination of the study. The average liver weights were derived from all mice in the study. The histology of the excised liver samples was performed as described. Livers were harvested from all treatment groups at necropsy and immediately placed in 10% neutral buffered formalin (catalog number HT501128-4L, Sigma-Aldrich). After 72 hours, formalin was replaced with 70% ethanol (catalog number ES753, Azer Scientific, Morgantown, PA). The samples were stored until they were processed to paraffin blocks and H&E stained by HistoWiz (Brooklyn, NY). Representative images of liver H&E were taken from the HistoWiz website (https://home.histowiz.com/), and the liver H&E slides were further evaluated for liver toxicity by the HistoWiz pathologist. IACUC, Institutional Animal Care and Use Committee.
Figure 2
Figure 2
Treatments with inhibitors of glutamatergic signaling (troriluzole) or immune checkpoint (anti–PD-1) reduced the percentage change of tumor progression at 18 weeks relative to that at 0 weeks in males. (a) Experimental design of the study. (b) Data shown included only mice that were on treatment for the entire 18 weeks of study: vehicle (DMSO + rat IgG, n = 8 males, n = 8 females), troriluzole (n = 8 males, n = 8 females), anti–PD-1 (n = 12 males, n = 10 females), and troriluzole + anti–PD-1 (n = 8 males, n = 8 females). Tumor burden (units: pixel2) was defined as the size and pigmentation of the tumors. Percentage change in tumor progression at 18 weeks was calculated as a percentage change between 0 and 18 weeks for each respective treatment arm. Statistical significance was determined using 2-way ANOVA tests with Bonferroni posthoc comparisons for each sex where the exposure variables were treatments and time points (0, 6, 12, and 18 weeks), and the outcome variable was tumor burden. Comparisons between 0 and 18 weeks male mice for vehicle (DMSO + Rat IgG) (P = 1.11E-8), troriluzole (P = .003), anti–PD-1 (P = .0002), and troriluzole + anti–PD-1 (P = 7.20E-7) was performed. Comparisons between 0 and 18 weeks female mice for vehicle (P = .001), anti–PD-1 (P = 5.47E-9), and troriluzole + anti–PD-1 (P = .007). ∗P < .05, ∗∗P < .005, and ∗∗∗P < .001. IVIS, In Vivo Imaging System.
Figure 3
Figure 3
Evaluation of treatment toxicity. (a) Average body weight ± SEM. Treatment arms and sample sizes are the same as in Figure 2. (b) Average liver weights normalized to their respective body weights ± SEM. Four male and 4 female mice were randomly killed at 0, 6, 12, and 18 weeks, and these mice were not included in the analysis for tumor growth (Figure 2) and glutamate analysis (Figure 4). Livers were weighed from mice from all treatment groups at necropsy at 0, 6, 12, and 18 weeks. (c) Representative images of liver H&E staining (bar = 100 μM). DMSO + rat IgG (n = 3 males, n = 3 females) and troriluzole (n = 3 males, n = 1 females). Statistical significance between treated pairs was conducted for each sex using either a 1-way or 2-way ANOVA test depending on the variable(s) being tested, and Bonferroni posthoc analysis was used during 2-way ANOVA. The exposure and outcome variables for the 1-way ANOVA were treatment groups and liver weights normalized to body weights, respectively, whereas for the 2-way ANOVA, the exposure and outcome variables were treatments and time points (0, 6, 12, and 18 weeks) and body weights, respectively. ∗P < .05 and ∗∗P < .01.
Figure 4
Figure 4
Systemically circulating glutamate levels over the course of treatments in male and female mice. Pharmacokinetic bioanalyses were conducted by LC-MS/MS on blood plasma collected at 0, 6, 12, and 18 weeks from the same mouse. Blood plasma was collected through retroorbital bleeding at least 20 hours after treatment. Averages values were determined from at least 2–3 different mice and are shown as average glutamate levels ± SEM. Statistical analyses were conducted for each sex using a 2-way ANOVA test with Bonferroni posthoc comparisons to determine statistical significance between treated pairs where the exposure variables were treatments and time points (0, 6, 12, and 18 weeks), whereas the outcome variable was glutamate concentration. LC-MS/MS, liquid chromatography–tandem mass spectrometry.
Figure 5
Figure 5
Changes in tumor response over the course of 6, 12, and 18 weeks in male and female mice treated with troriluzole and/or anti–PD-1. All mice were monitored throughout the 18-week study, and tumor responses were calculated using the percentage change from baseline at (0 weeks) to 6, 12, and 18 weeks. Treatment arms: vehicle (DMSO + rat IgG, n = 8 males, n = 8 females), troriluzole (n = 8 males, n = 8 females), anti–PD-1 (n = 12 males, n = 10 females), and troriluzole + anti–PD-1 (n = 8 males, n = 8 females). (a) Black bars represent male mice. The top panel represents tumor response rates at 6 weeks, the middle panel represents tumor response rates at 12 weeks, and the bottom panel represents tumor response rates at 18 weeks. (b) Gray bars represent female mice. The top panel represents tumor response rates at 6 weeks, the middle panel represents tumor response rates at 12 weeks, and the bottom panel represents tumor response rates at 18 weeks.
Figure 6
Figure 6
Survival outcomes in male and female mice after treatment cessation. After 18 weeks of treatment, a random subset of male and female TGS mice in each treatment arm was taken off treatment to determine their survival outcomes. Treatment arms: vehicle (DMSO + rat IgG, n = 4 males, n = 4 females), troriluzole (n = 4 males, n = 4 females), anti–PD-1 (n = 8 males, n = 6 females), and troriluzole + anti–PD-1 (n = 4 males, n = 4 females). The Log-rank (Mantel–Cox) and Gehan–Breslow–Wilcoxon statistical tests were used to evaluate the significance of each treatment compared with the vehicle group, DMSO + rat IgG, and also the significance of the monotherapies with the combination therapies. Both statistical tests showed similar outcomes. The Gehan–Breslow–Wilcoxon statistical test was the primary test used because of the crossing of the survival curves. The Bonferroni’s adjusted alpha value used was 0.002.
Figure 7
Figure 7
Quantifications and representative western immunoblots for the expression profiles of the molecular markers in melanomas. (a) mGluR1, (b) GLS, (c) xCT, (d) γ-H2AX, (e) EAAT2, (f) PD-L1, and (g) PD-1 bands were normalized to their respective tyrosinase bands, and these values were used for subsequent data analyses. The values in the table represent the average intensity of the protein band normalized to their respective tyrosinase band ± SEM. Below the tables are representative western blots associated with their respective proteins, where for mGluR1 and γ-H2AX, the immunoblots represent 12 weeks female mice, and for the GLS, xCT, EAAT2, PD-L1, and PD-1, the immunoblots represent 6 weeks female mice. The threshold used to define change/no change is associated with quantitative changes of 40–50% in protein expression observed between 6 and 18 weeks. At least 2 male and 2 female mice were used except for 6 weeks (male, anti–PD-1 and troriluzole + anti–PD-1; female, DMSO + rat IgG), 12 weeks (female, troriluzole and anti–PD-1), and 18 weeks xCT and EAAT2 (male, troriluzole + anti–PD-1) where only 1 mouse was used. These mice were randomly selected to be killed at 0, 6, 12, and 18 weeks to harvest livers and pigmented tumors. When pigmented tumors were harvested from each mouse, each specimen contained at least 4–6 pieces of independent tumors from that mouse, and western immunoblots were normalized to tyrosinase to consider only melanocytes/melanomas and not other cell types. To note, although we cannot completely exclude the contributions of melanocytes/nonmelanomas in the samples, we ensured during tumor harvest that only pigmented tumors were harvested with little to no adjacent normal skin present. GLS, glutaminase.
Figure 8
Figure 8
GeoMx digital spatial imaging profiles were performed to assess changes in the immune cell populations in the tumor–stromal interfaces over time. (a) Macrophages, (b) CD8+ T cells, (c) cytotoxic T cells, (d) activated T cells, (e) CD4+ T cells, (f) pan-immune cells. Values were average marker counts normalized to the geomean of the housekeeping gene ± SEM. The housekeeping proteins used for the normalization were histone H3 and S6 and were chosen because they correlated well with each other. The geomean of these markers was used for normalization because they take into consideration and control for outliers, whereas arithmetic mean does not. Pretreatment samples are skin specimens taken from male (n = 2) and female (n = 3) TGS mice aged 8 weeks that contain both dysplastic nevi (slightly raised pigmented lesions) and normal skin (no pigmented lesion) within the same skin specimen. The onset of melanoma in heterozygous TGS mice is 17–21 weeks, and prior to this, the nevi present are slightly raised ones—dysplastic nevi and flat pigmented lesions. As TGS mice aged, most of the slightly raised pigmented lesions became larger and thicker and are considered tumors. The pretreatment samples represent baseline levels of markers before treatment initiation, and the same values were used in the subsequent comparisons with 6-, 12-, and 18-week graphs. The threshold used to define change/no change for each marker and treatment arm took into consideration both the statistical analyses and the distribution of data points. At least 2 male and 2 female mice were used for each treatment arm except for 6 weeks (male, anti–PD-1 and troriluzole + anti–PD-1; female, DMSO + rat IgG), 12 weeks (female, troriluzole and anti–PD-1), and 18 weeks (female, anti–PD-1) where only 1 mouse was used. For each mouse specimen, at least 1–2 regions were selected. In the groups where only 1 mouse was used, 2 regions were selected from that sample. Regions of interest on the slides were selected by 3–4 individuals, with no specific criteria used to select regions from tumors and tumor–stromal interfaces. We had to include one of the individuals from the core facility at the University of Pittsburg Medical Center Cytometry Core because he had to label the samples each time. These specimens were made from tissue samples derived from mice randomly selected at each time point to be killed. Statistical analysis was conducted using a 2-way ANOVA test with Bonferroni posthoc comparisons to determine statistical significance between treated pairs at each time point, where the exposure variables were treatment groups and sex, and the outcome variable was marker values. To evaluate the statistical difference between 6 and 18 weeks for each marker and sex, a 2-way ANOVA was performed where the exposure variables were treatment groups and time points (6 and 18 weeks), and the outcome variable was marker value. ∗P < .05, ∗∗P < .01, and ∗∗∗P < .001. Markers used for immune profiling were chosen on the basis of whether the signal was above negative controls—Rb IgG, Rt IgG2a, and Rt IgG2b. The markers are as follows: MHC II, CD11b, CD11c, CD40, CD86, PD-L1, and F4/80 for macrophages; CD8a and CD3ε for CD8+ T cells; GZMB for cytotoxic T cells; CD127/IL7RA, CD27, CD40L, CD44, and CTLA-4 for activated T cells; CD4, ICOS, and CD3ε for CD4+ T cells; and CD45 for pan-immune cells. MHC II, major histocompatibility complex class II.
Figure 8
Figure 8
GeoMx digital spatial imaging profiles were performed to assess changes in the immune cell populations in the tumor–stromal interfaces over time. (a) Macrophages, (b) CD8+ T cells, (c) cytotoxic T cells, (d) activated T cells, (e) CD4+ T cells, (f) pan-immune cells. Values were average marker counts normalized to the geomean of the housekeeping gene ± SEM. The housekeeping proteins used for the normalization were histone H3 and S6 and were chosen because they correlated well with each other. The geomean of these markers was used for normalization because they take into consideration and control for outliers, whereas arithmetic mean does not. Pretreatment samples are skin specimens taken from male (n = 2) and female (n = 3) TGS mice aged 8 weeks that contain both dysplastic nevi (slightly raised pigmented lesions) and normal skin (no pigmented lesion) within the same skin specimen. The onset of melanoma in heterozygous TGS mice is 17–21 weeks, and prior to this, the nevi present are slightly raised ones—dysplastic nevi and flat pigmented lesions. As TGS mice aged, most of the slightly raised pigmented lesions became larger and thicker and are considered tumors. The pretreatment samples represent baseline levels of markers before treatment initiation, and the same values were used in the subsequent comparisons with 6-, 12-, and 18-week graphs. The threshold used to define change/no change for each marker and treatment arm took into consideration both the statistical analyses and the distribution of data points. At least 2 male and 2 female mice were used for each treatment arm except for 6 weeks (male, anti–PD-1 and troriluzole + anti–PD-1; female, DMSO + rat IgG), 12 weeks (female, troriluzole and anti–PD-1), and 18 weeks (female, anti–PD-1) where only 1 mouse was used. For each mouse specimen, at least 1–2 regions were selected. In the groups where only 1 mouse was used, 2 regions were selected from that sample. Regions of interest on the slides were selected by 3–4 individuals, with no specific criteria used to select regions from tumors and tumor–stromal interfaces. We had to include one of the individuals from the core facility at the University of Pittsburg Medical Center Cytometry Core because he had to label the samples each time. These specimens were made from tissue samples derived from mice randomly selected at each time point to be killed. Statistical analysis was conducted using a 2-way ANOVA test with Bonferroni posthoc comparisons to determine statistical significance between treated pairs at each time point, where the exposure variables were treatment groups and sex, and the outcome variable was marker values. To evaluate the statistical difference between 6 and 18 weeks for each marker and sex, a 2-way ANOVA was performed where the exposure variables were treatment groups and time points (6 and 18 weeks), and the outcome variable was marker value. ∗P < .05, ∗∗P < .01, and ∗∗∗P < .001. Markers used for immune profiling were chosen on the basis of whether the signal was above negative controls—Rb IgG, Rt IgG2a, and Rt IgG2b. The markers are as follows: MHC II, CD11b, CD11c, CD40, CD86, PD-L1, and F4/80 for macrophages; CD8a and CD3ε for CD8+ T cells; GZMB for cytotoxic T cells; CD127/IL7RA, CD27, CD40L, CD44, and CTLA-4 for activated T cells; CD4, ICOS, and CD3ε for CD4+ T cells; and CD45 for pan-immune cells. MHC II, major histocompatibility complex class II.
Figure 9
Figure 9
GeoMx digital spatial imaging profiles were performed to assess changes in the immune cell populations in the tumors over time. We followed the same process here as described in Figure 8, and the same slides were used as in Figure 8. Values were average marker counts normalized to geomean of housekeeping gene ± SEM. The housekeeping proteins used for the normalization were histone H3 and S6 and were chosen because they correlated well with each other. The geomean of these markers was used for normalization because they take into consideration and control for outliers, whereas arithmetic mean does not. Markers used for immune profiling were chosen on the basis of whether the signal was above negative controls—Rb IgG, Rt IgG2a, and Rt IgG2b. The threshold used to define change/no change for each marker and treatment arm took into consideration both the statistical analyses and the distribution of data points. MHC II, major histocompatibility complex class II.
Figure 9
Figure 9
GeoMx digital spatial imaging profiles were performed to assess changes in the immune cell populations in the tumors over time. We followed the same process here as described in Figure 8, and the same slides were used as in Figure 8. Values were average marker counts normalized to geomean of housekeeping gene ± SEM. The housekeeping proteins used for the normalization were histone H3 and S6 and were chosen because they correlated well with each other. The geomean of these markers was used for normalization because they take into consideration and control for outliers, whereas arithmetic mean does not. Markers used for immune profiling were chosen on the basis of whether the signal was above negative controls—Rb IgG, Rt IgG2a, and Rt IgG2b. The threshold used to define change/no change for each marker and treatment arm took into consideration both the statistical analyses and the distribution of data points. MHC II, major histocompatibility complex class II.
Figure 10
Figure 10
Representative images of data acquisition using the GeoMx digital spatial imaging platform. Regions on the GeoMx scans (above) were chosen on the basis of the location of the tumor–stromal interfaces and tumors on the H&E stains (bottom). Regions of interest on the slides were selected by 3–4 individuals; however, there were no specific criteria used to select tumors and tumor–stromal interfaces. We had to include 1 of the individuals from the core facility at the University of Pittsburg Medical Center Cytometry Core because he had to label the samples each time.

Similar articles

Cited by

References

    1. Alb M., Sie C., Adam C., Chen S., Becker J.C., Schrama D. Cellular and cytokine-dependent immunosuppressive mechanisms of grm1-transgenic murine melanoma. Cancer Immunol Immunother. 2012;61:2239–2249. - PMC - PubMed
    1. Barr J.T., Tran T.B., Rock B.M., Wahlstrom J.L., Dahal U.P. Strain-dependent variability of early discovery small molecule pharmacokinetics in mice: does strain matter? Drug Metab Dispos. 2020;48:613–621. - PubMed
    1. Benavides F., Oberyszyn T.M., VanBuskirk A.M., Reeve V.E., Kusewitt D.F. The hairless mouse in skin research. J Dermatol Sci. 2009;53:10–18. - PMC - PubMed
    1. Carbone M., Duty S., Rattray M. Riluzole elevates GLT-1 activity and levels in striatal astrocytes. Neurochem Int. 2012;60:31–38. - PMC - PubMed
    1. Castro A., Pyke R.M., Zhang X., Thompson W.K., Day C.P., Alexandrov L.B., et al. Strength of immune selection in tumors varies with sex and age. Nat Commun. 2020;11:4128. - PMC - PubMed