. 2023 Dec 27:5:107-124.
doi: 10.1109/OJEMB.2023.3345733. eCollection 2024.

Simulation of Image-Guided Microwave Ablation Therapy Using a Digital Twin Computational Model

Affiliations

Simulation of Image-Guided Microwave Ablation Therapy Using a Digital Twin Computational Model

Frankangel Servin et al. IEEE Open J Eng Med Biol. .

Abstract

Emerging computational tools such as healthcare digital twin modeling are enabling the creation of patient-specific surgical planning, including microwave ablation to treat primary and secondary liver cancers. Healthcare digital twins (DTs) are anatomically one-to-one biophysical models constructed from structural, functional, and biomarker-based imaging data to simulate patient-specific therapies and guide clinical decision-making. In microwave ablation (MWA), tissue-specific factors including tissue perfusion, hepatic steatosis, and fibrosis affect therapeutic extent, but current thermal dosing guidelines do not account for these parameters. This study establishes an MR imaging framework to construct three-dimensional biophysical digital twins to predict ablation delivery in livers with 5 levels of fat content in the presence of a tumor. Four microwave antenna placement strategies were considered, and simulated microwave ablations were then performed using 915 MHz and 2450 MHz antennae in Tumor Naïve DTs (control), and Tumor Informed DTs at five grades of steatosis. Across the range of fatty liver steatosis grades, fat content was found to significantly increase ablation volumes by approximately 29-l42% in the Tumor Naïve and 55-60% in the Tumor Informed DTs in 915 MHz and 2450 MHz antenna simulations. The presence of tumor did not significantly affect ablation volumes within the same steatosis grade in 915 MHz simulations, but did significantly increase ablation volumes within mild-, moderate-, and high-fat steatosis grades in 2450 MHz simulations. An analysis of signed distance to agreement for placement strategies suggests that accounting for patient-specific tumor tissue properties significantly impacts ablation forecasting for the preoperative evaluation of ablation zone coverage.

Keywords: Computational model; digital twin; fatty liver disease; finite element; liver cancer; microwave ablation.


Figures

Fig. 1.
Fig. 1.
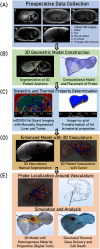
Analysis overview with (a) mDIXON MR imaging, (b) patient-specific computational models with an implanted microwave antenna, (c) fat fraction image-to-grid heterogenous modeling strategy, (d) segmentation and mesh of hepatic and portal veins and the (e) antenna placement planning for image-guided surgery and the synthesis of a 3D MR-data-driven, patient-geometry-/heterogenous-material computational model (digital twin) with simulated microwave ablation.
Fig. 2.
Fig. 2.
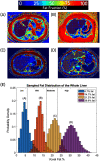
(a)–(d) Fat fraction image with liver fat segmented (shown as a semi-transparent red overlay) in patients with low-fat (a), mild-fat (b), moderate-fat (c), and high-fat (d). (e) Histogram of fat-encoded intensity values of 4 patients belonging to different steatosis grades (low, mild, moderate, high). The average fat percentages are shown in legend.
Fig. 3.
Fig. 3.
Liver (brown) with 4 hypothetical antenna placements (a)–(d) (pink, green, tan, and blue, respectively) targeting the center of the mCRC tumor (brown). Additionally, the major vasculature of the hepatic vein (blue) and portal vein (red) are depicted. The bare area of the liver is highlighted (green) and the reference system is shown in A (formula image).
Fig. 4.
Fig. 4.
Diagram of the 915 MHz antenna modeled after a single-slot SynchroWave ST Probe (Varian, Palo Alto, CA) . and a single-slot 2450 MHz antenna modeled from Cocic et al. .
Fig. 5.
Fig. 5.
Schematic of signed distance to agreement between ablation zone (red) and tumor (green): (a) SDAA-T color-codes the ablation volume where negative values indicate ablated tumor and positive values indicate extra-tumoral ablation (b) SDAT-A color-codes the tumor volume where negative values indicate ablated tumor and positive values are recurrence regions.
Fig. 6.
Fig. 6.
Boxplot of the final tumor ablated volume (cm3) and percent (%) tumor ablated (915 MHz antenna, 15 minutes at 60 W power) across all fat contents and antenna placements (A-D) in Tumor Naïve (TN) and Tumor Informed (TI) digital twins. Original tumor volume is 11.7 cm3.
Fig. 7.
Fig. 7.
Two signed distance to agreements, SDAA-T and SDAT-A between the boundary points (BPs) of the final ablation volume and the edges of the tumor in high-fat livers (915 MHz antenna, 15 minutes at 60 W power). Ablation volumes from high-fat models were selected to illustrate the maximum ablation coverage possible. Positive SDAA-T values indicate extra-tumoral ablation margins, i.e., surrounding tissue damage, while negative values indicate ablated tumor. Positive SDAT-A indicate regions of incomplete tumor ablation and negative values indicate regions of ablated tumor. The tumor is oriented to highlight areas in regions with less ablation coverage, and placements A-D are labeled for (i) Tumor Naïve and (ii) Tumor Informed digital twins.
Fig. 8.
Fig. 8.
Boxplot of the final tumor ablated volume (cm3) and percent (%) tumor ablated (2450 MHz antenna, 15 minutes at 60 W power) across all fat contents and antenna placements (A-D) in Tumor Naïve (TN) and Tumor Informed (TI) digital twins. Original tumor volume is 11.7 cm3. Fig. 8 Boxplot of the final tumor ablated volume (cm3) (2450 MHz antenna, 15 minutes at 60 W power) across all fat contents and antenna placements (A-D) in Tumor Naïve (TN) and Tumor Informed (TI) digital twins.
Fig. 9.
Fig. 9.
Two signed distance to agreements, SDAA-T and SDAT-A between the boundary points (BPs) of the final ablation volume and the edges of the tumor in high-fat livers (2450 MHz antenna, 15 minutes at 60 W power). Ablation volumes from high-fat models were selected to illustrate the maximum ablation coverage possible. Positive SDAA-T values indicate extra-tumoral ablation margins, i.e., surrounding tissue damage, while negative values indicate ablated tumor. Positive SDAT-A values indicate regions of incomplete tumor ablation, and negative values indicate regions of ablated tumor. The tumor is oriented to highlight areas in regions with less ablation coverage, and placements A-D are labeled for (i) Tumor Naïve and (ii) Tumor Informed digital twins.
Fig. 10.
Fig. 10.
Microwave ablation volume in a high-fat Tumor Informed Digital Twin using a 915 MHz antenna (a) and a 2450 MHz antenna (b) in antenna placement C. The region of overlap between the ablation volume and the right hepatic vein is highlighted in a white outline.

Similar articles

Cited by

References

    1. Siegel R. L., Miller K. D., Wagle N. S., and Jemal A., “Cancer statistics, 2023,” CA: A Cancer J. Clinicians, vol. 73, no. 1, pp. 17–48, 2023, doi: 10.3322/caac.21763. - DOI - PubMed
    1. Singh A. K., Kumar R., and Pandey A. K., “Hepatocellular carcinoma: Causes, mechanism of progression and biomarkers,” Curr. Chem. Genomic. Transl. Med., vol. 12, pp. 9–26, Jun. 2018, doi: 10.2174/2213988501812010009. - DOI - PMC - PubMed
    1. Masuzaki R., Karp S. J., and Omata M., “NAFLD as a risk factor for HCC: New rules of engagement?,” Hepatol. Int., vol. 10, no. 4, pp. 533–534, May 2016, doi: 10.1007/s12072-016-9731-8. - DOI - PMC - PubMed
    1. Couillard A. B. et al., “Microwave ablation as bridging to liver transplant for patients with hepatocellular carcinoma: A single-center retrospective analysis,” J. Vasc. Interventional Radiol., vol. 33, no. 9, pp. 1045–1053, Sep. 2022, doi: 10.1016/j.jvir.2022.05.019. - DOI - PubMed
    1. Fang C. et al., “Complications from percutaneous microwave ablation of liver tumours: A pictorial review,” Brit. J. Radiol., vol. 92, no. 1099, Jul. 2019, Art. no. 20180864, doi: 10.1259/bjr.20180864. - DOI - PMC - PubMed