. 2025 Sep;19(5):1353-1361.
doi: 10.1177/19322968241236208. Epub 2024 Mar 6.

A Machine Learning Model for Week-Ahead Hypoglycemia Prediction From Continuous Glucose Monitoring Data

Affiliations

A Machine Learning Model for Week-Ahead Hypoglycemia Prediction From Continuous Glucose Monitoring Data

Flavia Giammarino et al. J Diabetes Sci Technol. 2025 Sep.

Abstract

Background: Remote patient monitoring (RPM) programs augment type 1 diabetes (T1D) care based on retrospective continuous glucose monitoring (CGM) data. Few methods are available to estimate the likelihood of a patient experiencing clinically significant hypoglycemia within one week.

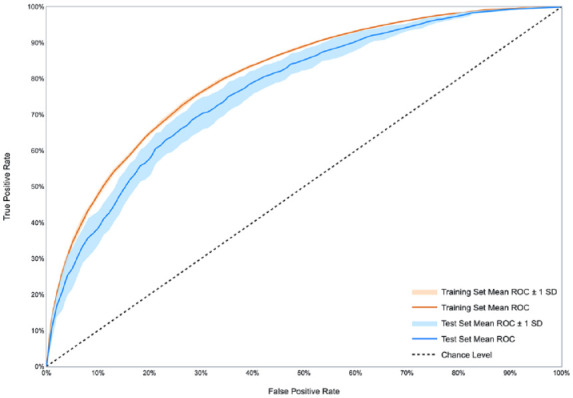
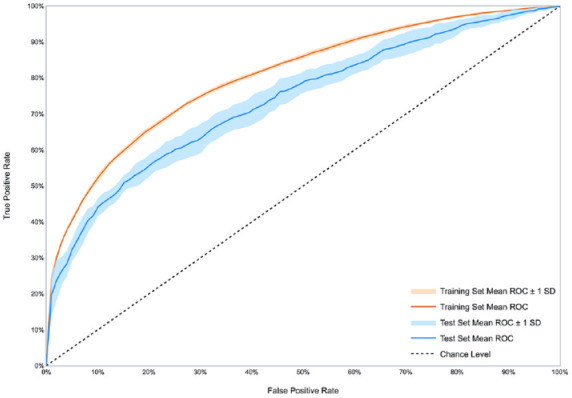
Methods: We developed a machine learning model to estimate the probability that a patient will experience a clinically significant hypoglycemic event, defined as CGM readings below 54 mg/dL for at least 15 consecutive minutes, within one week. The model takes as input the patient's CGM time series over a given week, and outputs the predicted probability of a clinically significant hypoglycemic event the following week. We used 10-fold cross-validation and external validation (testing on cohorts different from the training cohort) to evaluate performance. We used CGM data from three different cohorts of patients with T1D: REPLACE-BG (226 patients), Juvenile Diabetes Research Foundation (JDRF; 355 patients) and Tidepool (120 patients).

Results: In 10-fold cross-validation, the average area under the receiver operating characteristic curve (ROC-AUC) was 0.77 (standard deviation [SD]: 0.0233) on the REPLACE-BG cohort, 0.74 (SD: 0.0188) on the JDRF cohort, and 0.76 (SD: 0.02) on the Tidepool cohort. In external validation, the average ROC-AUC across the three cohorts was 0.74 (SD: 0.0262).

Conclusions: We developed a machine learning algorithm to estimate the probability of a clinically significant hypoglycemic event within one week. Predictive algorithms may provide diabetes care providers using RPM with additional context when prioritizing T1D patients for review.

Keywords: clinical decision support; continuous glucose monitoring; hypoglycemia prediction; machine learning; patient prioritization; type 1 diabetes.


Conflict of interest statement

Declaration of Conflicting InterestsThe author(s) declared the following potential conflicts of interest with respect to the research, authorship, and/or publication of this article: DS is an advisor to Carta Healthcare.

Figures

Figure 1.
Figure 1.
Ten-fold cross-validation mean ROC curves and corresponding standard deviations for REPLACE-BG cohort. The training set ROC curves are obtained by evaluating the model on the same subsample used for training, which includes nine tenths of the data at each cross-validation split. The test set ROC curves are obtained by evaluating the model on the independent subsample of the data that was not used for training, which includes one tenth of the data at each cross-validation split. Abbreviation: ROC, receiver operating characteristic.
Figure 2.
Figure 2.
Ten-fold cross-validation mean ROC curves and corresponding standard deviations for JDRF cohort. The training set ROC curves are obtained by evaluating the model on the same subsample used for training, which includes nine tenths of the data at each cross-validation split. The test set ROC curves are obtained by evaluating the model on the independent subsample of the data that was not used for training, which includes one tenth of the data at each cross-validation split. Abbreviations: ROC, receiver operating characteristic; JDRF, Juvenile Diabetes Research Foundation.
Figure 3.
Figure 3.
Ten-fold cross-validation mean ROC curves and corresponding standard deviations for Tidepool cohort. The training set ROC curves are obtained by evaluating the model on the same subsample used for training, which includes nine tenths of the data at each cross-validation split. The test set ROC curves are obtained by evaluating the model on the independent subsample of the data that was not used for training, which includes one tenth of the data at each cross-validation split. Abbreviation: ROC, receiver operating characteristic.
Figure 4.
Figure 4.
Normalized confusion matrix by time-to-first-event for REPLACE-BG cohort. The training set confusion matrix is obtained by fitting the model to all the available data and generating the model predictions on the same data that were used for training. The test set confusion matrix is obtained by combining the model predictions generated during 10-fold cross-validation: for each of the 10 splits, the test includes a different one tenth of the data, and therefore combining the model predictions across all the 10 splits returns the model predictions on all the data.
Figure 5.
Figure 5.
Normalized confusion matrix by time-to-first-event for JDRF cohort. The training set confusion matrix is obtained by fitting the model to all the available data and generating the model predictions on the same data that were used for training. The test set confusion matrix is obtained by combining the model predictions generated during 10-fold cross-validation: for each of the 10 splits, the test includes a different one tenth of the data, and therefore combining the model predictions across all the 10 splits returns the model predictions on all the data. Abbreviation: JDRF, Juvenile Diabetes Research Foundation.
Figure 6.
Figure 6.
Normalized confusion matrix by time-to-first-event for Tidepool cohort. The training set confusion matrix is obtained by fitting the model to all the available data and generating the model predictions on the same data that were used for training. The test set confusion matrix is obtained by combining the model predictions generated during 10-fold cross-validation: for each of the 10 splits, the test includes a different one tenth of the data, and therefore combining the model predictions across all the 10 splits returns the model predictions on all the data.
Figure 7.
Figure 7.
Average 10-fold cross-validation mean ROC-AUC across the three cohorts (REPLACE-BG, JDRF, and Tidepool) for different hyperparameter combinations. Abbreviations: JDRF, Juvenile Diabetes Research Foundation; ROC-AUC, area under the receiver operating characteristic curve.

References

    1. Ferstad JO, Vallon JJ, Jun D, et al. Population-level management of type 1 diabetes via continuous glucose monitoring and algorithm-enabled patient prioritization: precision health meets population health. Pediatr Diabetes. 2021;22(7):982-991. doi: 10.1111/pedi.13256. - DOI - PMC - PubMed
    1. Scheinker D, Gu A, Grossman J, et al. Algorithm-enabled, personalized glucose management for type 1 diabetes at the population scale: prospective evaluation in clinical practice. JMIR Diabetes. 2022;7:e27284. doi: 10.2196/27284. - DOI - PMC - PubMed
    1. Scheinker D, Prahalad P, Johari R, Maahs DM, Majzun R. A new technology-enabled care model for pediatric type 1 diabetes. NEJM Catal Innov Care Deliv. 2022;3(5):e0438. doi: 10.1056/CAT.21.0438. - DOI - PMC - PubMed
    1. Danne T, Nimri R, Battelino T, et al. International consensus on use of continuous glucose monitoring. Diabetes Care. 2017;40:1631-1640. doi: 10.2337/dc17-1600. - DOI - PMC - PubMed
    1. Dave D, DeSalvo DJ, Haridas B, et al. Feature-based machine learning model for real-time hypoglycemia prediction. J Diabetes Sci Technol. 2021;15:842-855. doi: 10.1177/1932296820922622. - DOI - PMC - PubMed

LinkOut - more resources