. 2024 Apr 2;12(4):e0344823.
doi: 10.1128/spectrum.03448-23. Epub 2024 Mar 6.

Microbiome-based classification models for fresh produce safety and quality evaluation

Affiliations

Microbiome-based classification models for fresh produce safety and quality evaluation

Chao Liao et al. Microbiol Spectr. .

Abstract

Small sample sizes and loss of sequencing reads during the microbiome data preprocessing can limit the statistical power of differentiating fresh produce phenotypes and prevent the detection of important bacterial species associated with produce contamination or quality reduction. Here, we explored a machine learning-based k-mer hash analysis strategy to identify DNA signatures predictive of produce safety (PS) and produce quality (PQ) and compared it against the amplicon sequence variant (ASV) strategy that uses a typical denoising step and ASV-based taxonomy strategy. Random forest-based classifiers for PS and PQ using 7-mer hash data sets had significantly higher classification accuracy than those using the ASV data sets. We also demonstrated that the proposed combination of integrating multiple data sets and leveraging a 7-mer hash strategy leads to better classification performance for PS and PQ compared to the ASV method but presents lower PS classification accuracy compared to the feature-selected ASV-based taxonomy strategy. Due to the current limitation of generating taxonomy using the 7-mer hash strategy, the ASV-based taxonomy strategy with remarkably less computing time and memory usage is more efficient for PS and PQ classification and applicable for important taxa identification. Results generated from this study lay the foundation for future studies that wish and need to incorporate and/or compare different microbiome sequencing data sets for the application of machine learning in the area of microbial safety and quality of food.

Importance: Identification of generalizable indicators for produce safety (PS) and produce quality (PQ) improves the detection of produce contamination and quality decline. However, effective sequencing read loss during microbiome data preprocessing and the limited sample size of individual studies restrain statistical power to identify important features contributing to differentiating PS and PQ phenotypes. We applied machine learning-based models using individual and integrated k-mer hash and amplicon sequence variant (ASV) data sets for PS and PQ classification and evaluated their classification performance and found that random forest (RF)-based models using integrated 7-mer hash data sets achieved significantly higher PS and PQ classification accuracy. Due to the limitation of taxonomic analysis for the 7-mer hash, we also developed RF-based models using feature-selected ASV-based taxonomic data sets, which performed better PS classification than those using the integrated 7-mer hash data set. The RF feature selection method identified 480 PS indicators and 263 PQ indicators with a positive contribution to the PS and PQ classification.

Keywords: amplicon sequence variant; k-mer hash; machine learning; produce quality; produce safety; random forest.


Conflict of interest statement

The authors declare no conflict of interest.

Figures
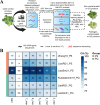
Fig 1
Fig 1
Construction and evaluation of ML-based PS and PQ classifiers. (A) Schematic comparison of the preprocessing including denoising of the ASV approach and ASV approach and ASV-based taxonomy approach for constructing IPS and IPQ based on RF in the following section against the preprocessing of the k-mer hash approach for constructing PS and PQ classifiers. (B) Heatmap of the accuracies achieved by RF-based models using fresh produce microbiome data sets associated with PS and PQ in ASV format and k-mer hash format (k from 3 to 7). Accuracies are measured using 10-fold cross-validation. GQ and DQ represent good-quality produce and decreasing-quality produce, respectively. CA is classification accuracy. Partial icons in A were obtained from “BioRender.com.” Non-parametric Wilcoxon rank sum test was applied to analyze the difference in classification accuracy between ASV-based models and 7-mer hash-based models. The * represents P < 0.05 obtained in the statistical test indicating that a statistically significant difference was detected between the two models.
Fig 2
Fig 2
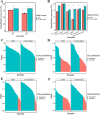
Evaluation of RF-based IPS and IPQ classifiers. (A) Barplot of classification performance of RF-based models on the IPS and IPQ data sets, represented using either ASV or 7-mer hashes. The Wilcoxon rank sum test was used for the pairwise comparison of the accuracies of the IPS and IPQ classifiers. (B) Barplot of classification performance of classifiers established by using individual data sets from IPS and IPQ data sets in ASV and 7-mer hash. (C) Barplot of the prediction of PS samples with the true label of contamination. The prediction was made by votes of 500 decision trees in RF-based classifiers established by using ASV and 7-mer hash. The cutoff voting rate (50% votes) indicates whether a labeled sample is predicted correctly or not. Ctrl and Cont represent non-contaminated samples and contaminated samples. The * stands for P < 0.05. (D) Same as C, but barplot of the prediction of PS samples with the true label of control. (E) Same as C, but barplot of the prediction of PQ samples with the true label of DQ. (F) Same as C, but barplot of the prediction of PQ samples with the true label of GQ.
Fig 3
Fig 3
Comparison of the classification performance of classifiers trained on individual PS and PQ data sets and IPS and IPQ data sets. (A) Classifiers were trained on individual LiaoRl21 or Zhang18 data sets, and a classifier was trained on an integrated data set excluding LiaoSm21, denoting IPS (∆LiaoSm21). The LiaoSm21 was used as a testing set. (B) Classifiers were trained on individual LiaoRl21 and Kusstatscher data sets and an integrated data set excluding LiaoSm21, denoting as IPQ (∆LiaoSm21). The LiaoSm21 was used as a testing set. (C) Same as A, but individual and IPS classifiers were tested on LiaoRl21. (D) Same as B, but individual and IPQ classifiers were tested on LiaoRl21. (E) Same as A, but individual and IPS classifiers were tested on Zhang18. (F) Same as B, but individual and IPQ classifiers were tested on Kusstatscher19. Wilcoxon rank sum tests were applied for testing the significance of the difference in testing accuracy (%) of individual and IPS and IPQ classifiers. PS and PQ mean produce safety and produce quality, respectively. The * represents P < 0.05; the ** stands for P < 0.01; and the ns represents no significance.
Fig 4
Fig 4
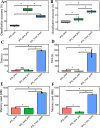
Comparison of PS and PQ classification performance between RF-based models constructed using ASV-based taxonomic data sets and 7-mer hash data sets. (A and B) PS and PQ classification accuracy of models using ASV-based taxonomic data sets, feature-selected taxonomic data sets with positive MDA, and 7-mer hash data sets, respectively. (C and D) Computing time (s) of PS and PQ classification by the models using the three types of data sets mentioned above. (E and F) Computing memory usage (MB) of PS and PQ classification by the models. “*” strands for P < 0.05, indicating significant differences present between groups of samples. MB, megabyte; s, second.
Fig 5
Fig 5
Identification of bacterial indicators related to PS or PQ. (A and B) Volcano plots based on the W statistic values and −log10(P) values obtained from the ANCOM-BC test presenting the differential abundances of genera among two contamination groups for PS and PQ, respectively. (C and D) Heatmaps of the relative abundances of bacterial indicators identified from individual and IPS data sets and individual and IPQ data sets, respectively. Cont means contaminated samples. Ctrl represents non-contaminated samples. DQ represents decreasing-quality samples. GQ represents good-quality samples.
Fig 6
Fig 6
Importance of features evaluated by MDA provided by RF-based classifiers established using ASV-based taxonomy strategy. (A) Contribution of taxonomic features to PS classification. (B) Contribution of taxonomic features to PQ classification. (C) The top 10 most important genera with a positive contribution to IPS classification. (D) The top 10 most important genera with a positive contribution to IPQ classification. Ctrl represents the non-contaminated group, and Cont represents the contaminated group. GQ represents good quality, and DQ represents decreasing quality.

Similar articles

Cited by

References

    1. Jackson C, Stone B, Tyler H. 2015. Emerging perspectives on the natural microbiome of fresh produce vegetables. Agriculture 5:170–187. doi:10.3390/agriculture5020170 - DOI
    1. Bergholz TM, Moreno Switt AI, Wiedmann M. 2014. Omics approaches in food safety: fulfilling the promise Trends Microbiol 22:275–281. doi:10.1016/j.tim.2014.01.006 - DOI - PMC - PubMed
    1. Ceuppens S, Delbeke S, De Coninck D, Boussemaere J, Boon N, Uyttendaele M. 2015. Characterization of the bacterial community naturally present on commercially grown basil leaves: evaluation of sample preparation prior to culture-independent techniques. Int J Environ Res Public Health 12:10171–10197. doi:10.3390/ijerph120810171 - DOI - PMC - PubMed
    1. Gu G, Ottesen A, Bolten S, Ramachandran P, Reed E, Rideout S, Luo Y, Patel J, Brown E, Nou X. 2018. Shifts in spinach microbial communities after chlorine washing and storage at compliant and abusive temperatures. Food Microbiol 73:73–84. doi:10.1016/j.fm.2018.01.002 - DOI - PubMed
    1. Jackson CR, Randolph KC, Osborn SL, Tyler HL. 2013. Culture dependent and independent analysis of bacterial communities associated with commercial salad leaf vegetables. BMC Microbiol 13:274. doi:10.1186/1471-2180-13-274 - DOI - PMC - PubMed