. 2024 May;11(18):e2307136.
doi: 10.1002/advs.202307136. Epub 2024 Mar 6.

Hallmark Molecular and Pathological Features of POLG Disease are Recapitulated in Cerebral Organoids

Affiliations

Hallmark Molecular and Pathological Features of POLG Disease are Recapitulated in Cerebral Organoids

Anbin Chen et al. Adv Sci (Weinh). 2024 May.

Abstract

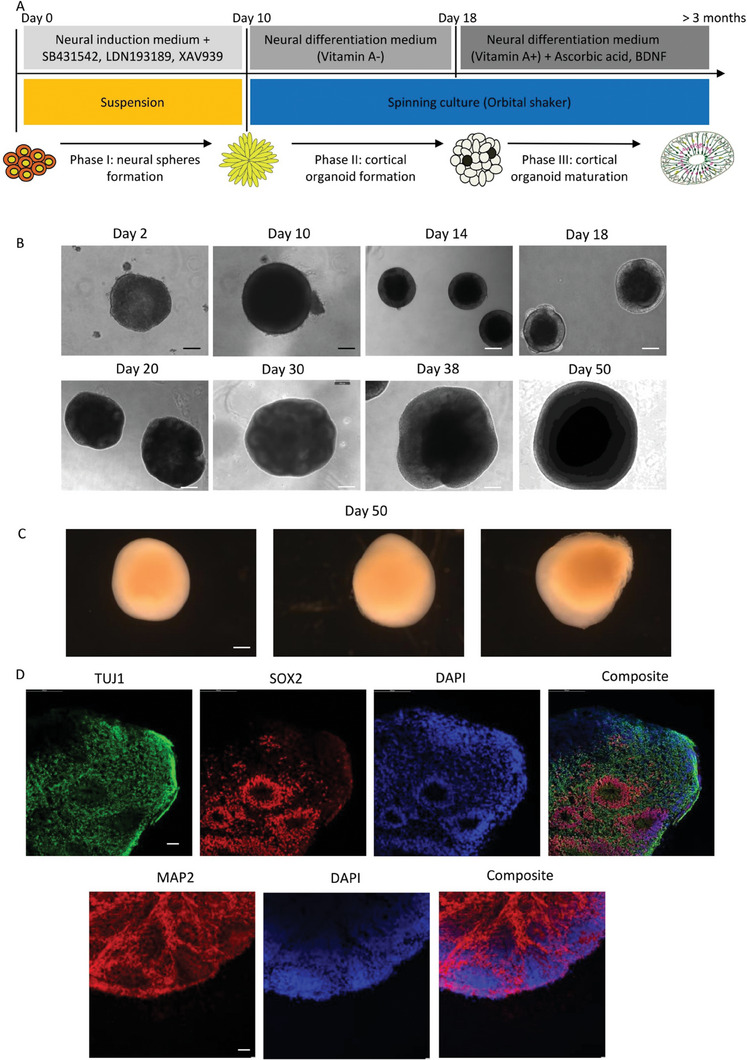
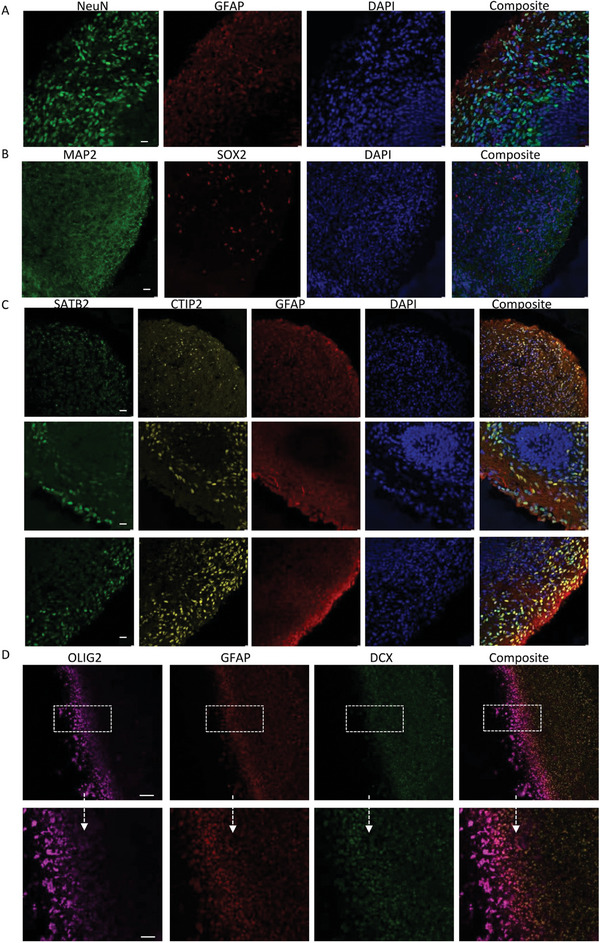
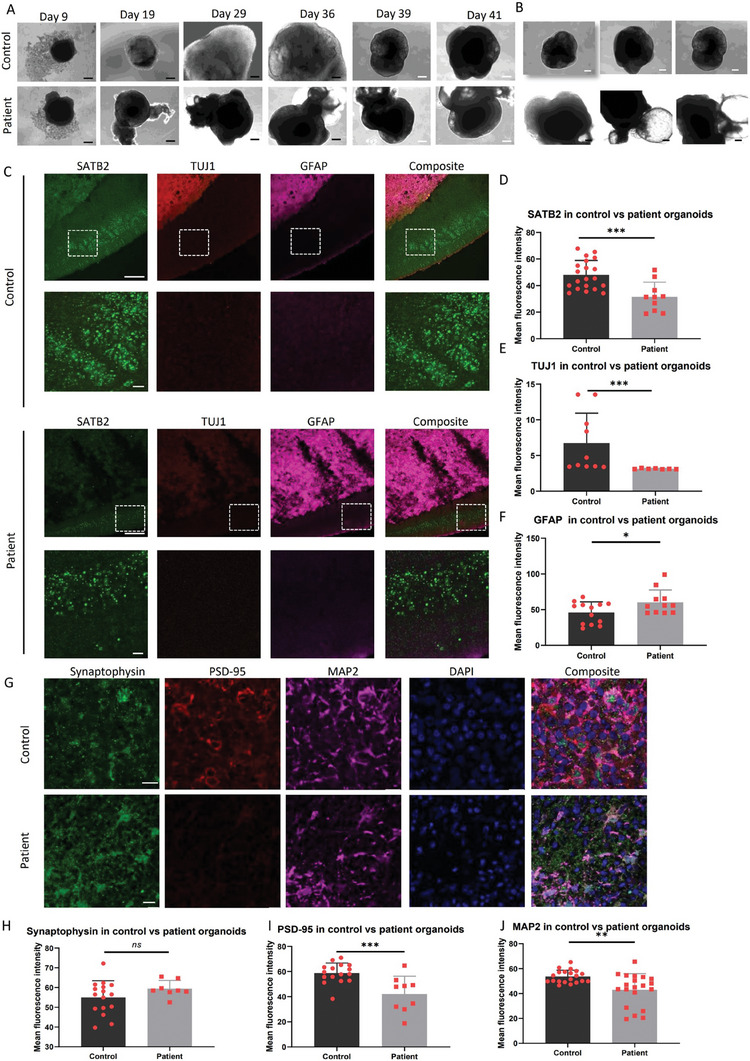
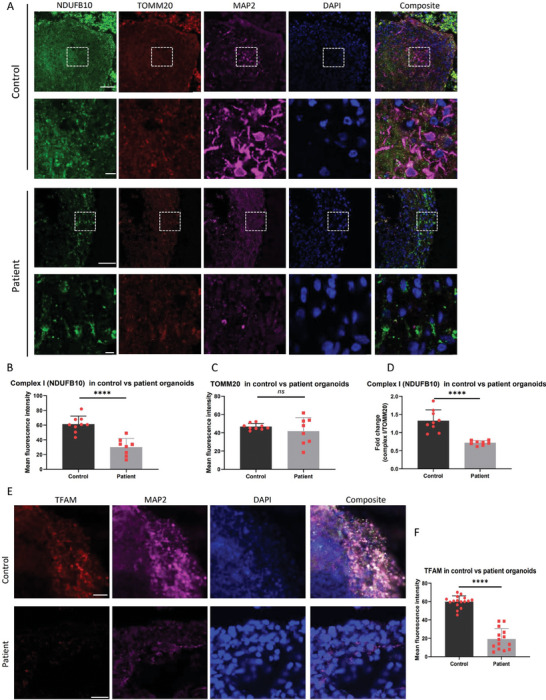
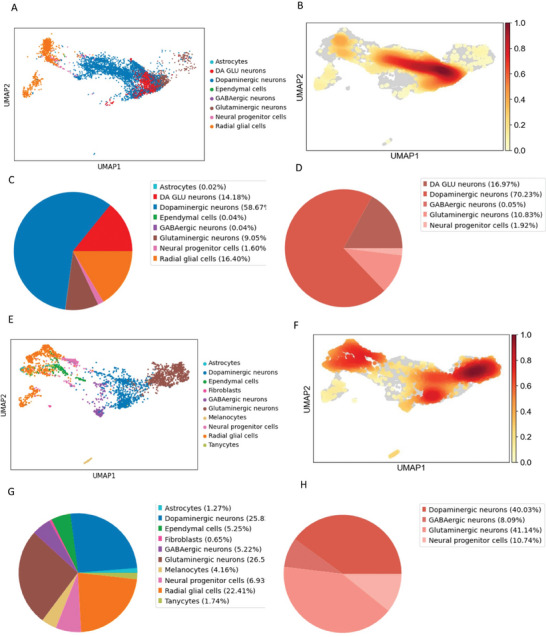
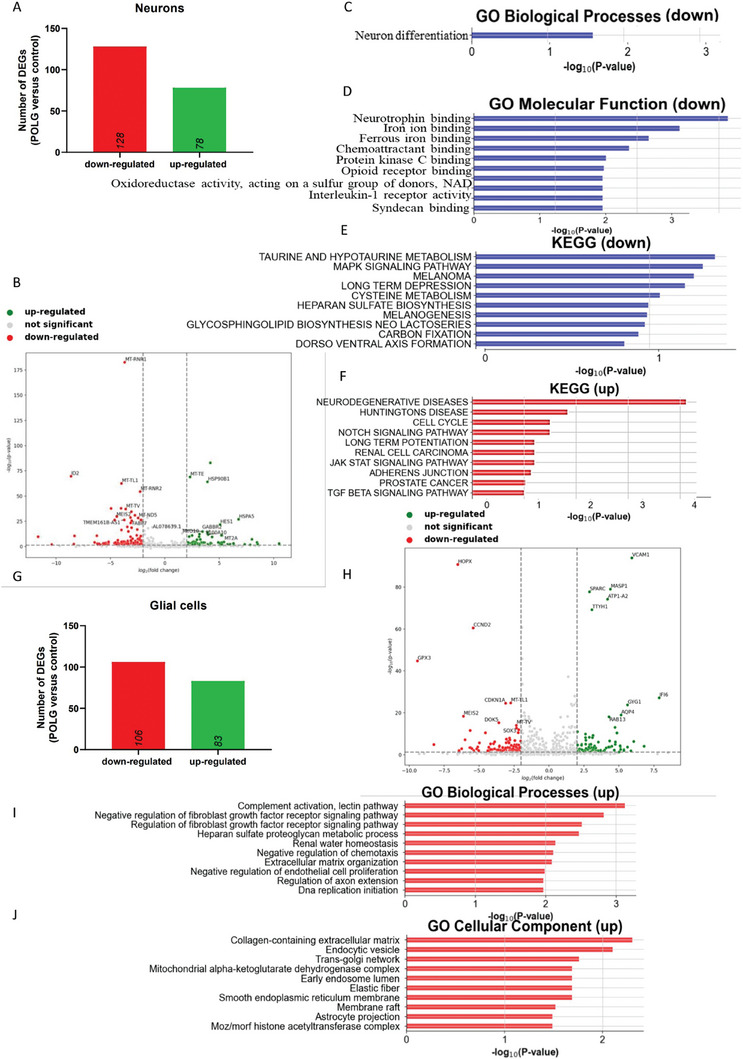
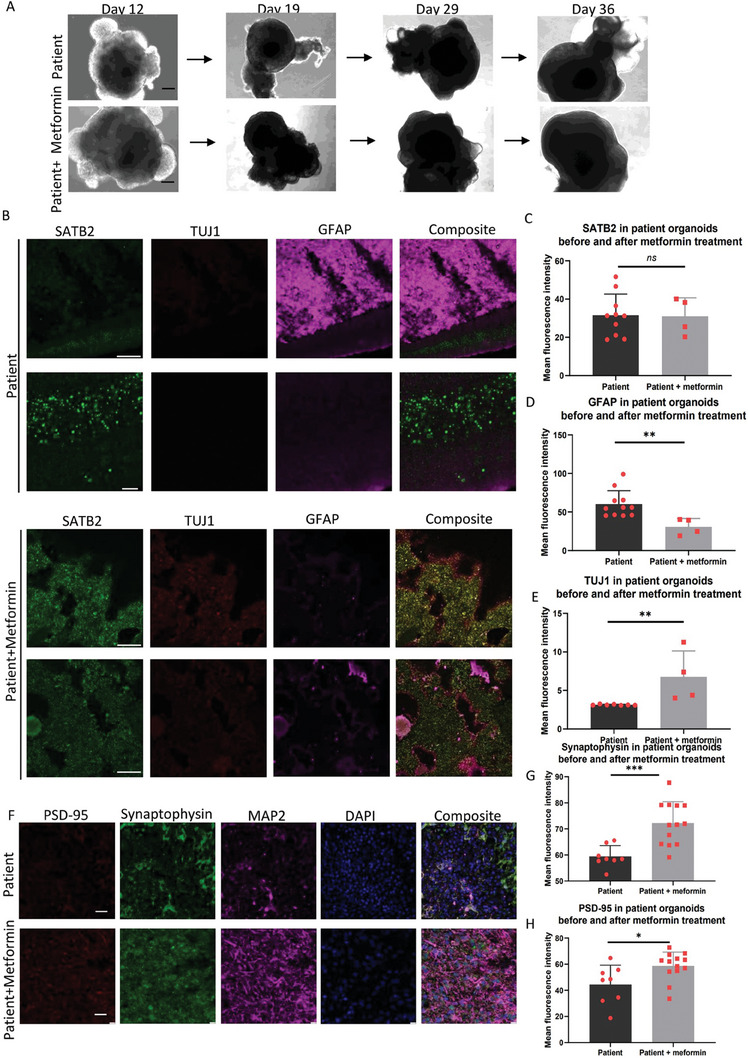
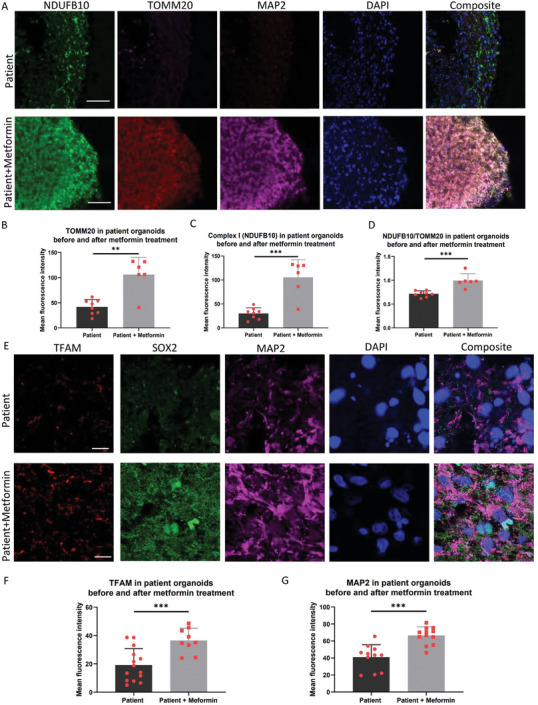
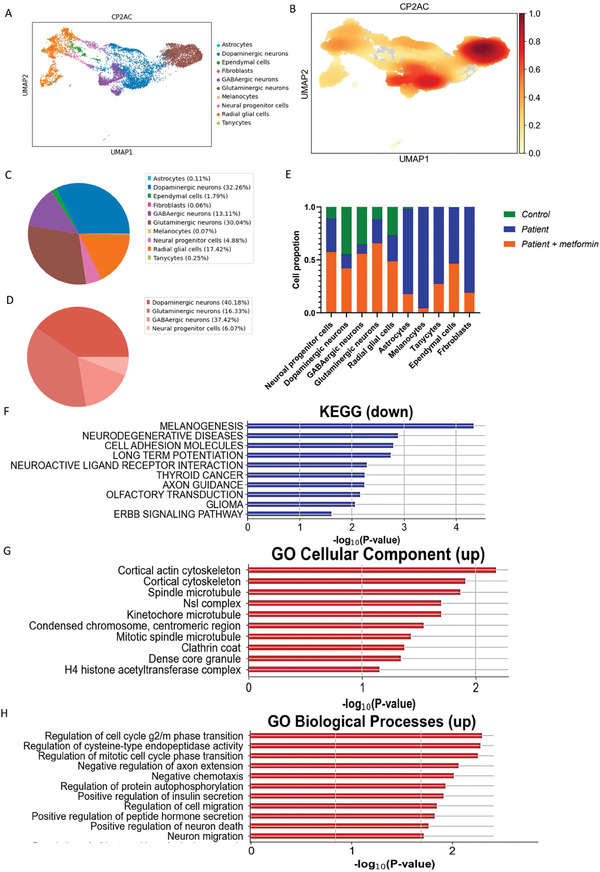
In this research, a 3D brain organoid model is developed to study POLG-related encephalopathy, a mitochondrial disease stemming from POLG mutations. Induced pluripotent stem cells (iPSCs) derived from patients with these mutations is utilized to generate cortical organoids, which exhibited typical features of the diseases with POLG mutations, such as altered morphology, neuronal loss, and mitochondiral DNA (mtDNA) depletion. Significant dysregulation is also identified in pathways crucial for neuronal development and function, alongside upregulated NOTCH and JAK-STAT signaling pathways. Metformin treatment ameliorated many of these abnormalities, except for the persistent affliction of inhibitory dopamine-glutamate (DA GLU) neurons. This novel model effectively mirrors both the molecular and pathological attributes of diseases with POLG mutations, providing a valuable tool for mechanistic understanding and therapeutic screening for POLG-related disorders and other conditions characterized by compromised neuronal mtDNA maintenance and complex I deficiency.

Keywords: POLG; cortical organoids; iPSC; mitochondrial function; neuron.


Conflict of interest statement

The authors declare no conflict of interest.

Figures

Figure 1
Figure 1
Generation of cortical organoids from iPSCs. A) The differentiation protocol consisted of three phases. In Phase I, neural induction and neural sphere formation were achieved by generating embryoid bodies in stationary suspension 3D culture using the dual SMAD inhibition and canonical Wnt inhibition approach. In Phase II, cortical organoid formation was initiated by transferring the cells into spinning culture using an orbital shaker and culturing them in neural differentiation medium without vitamin A to promote regionalization factors and cortical organization. In Phase III, cortical organoid maturation was facilitated by maintaining the organoids in neural differentiation medium supplemented with vitamin A, BDNF, and ascorbic acid for long‐term neural maturation. B) Representative phase contrast images were captured at various time points during the differentiation process, including day 2, 10, 14, 18, 20, 30, 38, and 50. These images displayed the changing cell morphology throughout the differentiation process. The black scale bar represents 100 µm, and the white scale bar represents 300 µm. C) The morphology of three individual organoids on day 50 of differentiation was examined. The image displayed the diversity in size and structure among the organoids. The scale bar represents 400 µm. D) Representative immunofluorescent imaging was performed on cryo‐sectioned organoids on day 30 of differentiation from the control CCD‐1079Sk iPSCs. The staining revealed the presence of the newborn neural marker TUJ1 (green), neural progenitor marker SOX2 (red), and mature neural marker MAP2 (red). Nuclei were stained with DAPI (blue). The scale bar represents 100 µm.
Figure 2
Figure 2
Characterization of cortical organoids from iPSCs on day 90. A) Representative immunofluorescent imaging of cryo‐sectioned organoids cortical organoids on day 90 derived from the control CCD‐1079Sk iPSCs revealing the presence of the astrocyte marker GFAP (red) and the mature neural marker NeuN (green). Nuclei were counterstained with DAPI (blue). The scale bar represents 100 µm. B) Representative immunofluorescent imaging of cryo‐sectioned cortical organoids derived from the control CCD‐1079Sk iPSCs on day 90 showed the expression of the mature neural marker MAP2 (green) and the neural progenitor marker SOX2 (red). Nuclei were counterstained with DAPI (blue). The scale bar represents 100 µm. C) Cryo‐sectioned cortical organoids derived from the control CCD‐1079Sk iPSCs at day 90 displayed cortical pyramidal neuronal markers SATB2 (green) and CTIP1 (yellow), along with the astrocyte marker GFAP (red). Nuclei were counterstained with DAPI (blue). The scale bar represents 100 µm. D) Representative immunofluorescent imaging of cryo‐sectioned cortical organoids derived from the control CCD‐1079Sk iPSCs at day 90 revealed stratified layers containing the oligodendrocyte marker OLIG2 (purple), the astrocyte marker GFAP (red), and the neural marker DCX (green). Nuclei were counterstained with DAPI (blue). The scale bar represents 100 µm.
Figure 3
Figure 3
Comparison of lineage markers cortical organoids from control and patient iPSCs. A) Cell morphology was assessed using phase contrast imaging at day 9, 19, 29, 36, 39, and 41 of differentiation in both control Detroit 551 and patient CP2A cortical organoids. The black scale bar represents 100 µm, and the white scale bar represents 100 µm. B) Morphology of three individual organoids on day 36 of differentiation was examined in both control Detroit 551 and patient CP2A cortical organoids. The scale bar represents 300 µm. C) Cryo‐sectioned cortical organoids Representative immunofluorescent imaging of staining for the cortical pyramidal neuronal marker SATB2 (green), newborn neural marker TUJ1 (green), and reactive astrocyte marker GFAP (red) for cryo‐sectioned organoids at 90 days in both control Detroit 551 and patient CP2A cortical organoids. The scale bar represents 100 µm. D–F) Quantitative measurements were performed to assess the expression levels of D) SATB2, E) TUJ1, and F) GFAP on day 90 in control and patient cortical organoids. The y‐axis represents the mean fluorescence intensity. The data were presented as mean ± SD. Significance levels are indicated for P values less than 0.05, with * indicating P < 0.05, *** indicating P < 0.001. The information on sample size (n), probability (P) value, and the specific statistical test for each experiment was presented in Tables S5 and S9 (Supporting Information). G) Representative immunofluorescent imaging of cryo‐sectioned cortical organoids stained for the presynaptic marker Synaptophysin (green), postsynaptic marker PSD‐95 (red), and mature neural marker MAP2 (purple) from both control Detroit 551 and patient CP2A cortical organoids. Nuclei were counterstained with DAPI (blue). The scale bar represents 50 µm. H–J) Quantitative measurements were conducted to evaluate the expression levels of Synaptophysin H), PSD‐95 I), and MAP2 J) in control and patient cortical organoids. The y‐axis represents the mean fluorescence intensity. The data were presented as mean ± standard deviation (SD)D. Significance levels are indicated for P values less than 0.05, with ** indicating P < 0.01, *** indicating P < 0.001. Results not reaching statistical significance are denoted as ns (not significant). The information on sample size (n), probability (P) value, and the specific statistical test for each experiment was presented in Tables S5 and S9 (Supporting Information).
Figure 4
Figure 4
Comparison of mitochondrial related proteins in cortical organoids from control and patient iPSCs. A) Representative immunofluorescent imaging of staining for the complex I subunit NDUFB10 (green), outer mitochondrial membrane TOMM20 (red), and mature neural marker MAP2 (purple) for the cryo‐sectioned cortical organoids at 90 days of differentiation from both control Detroit 551 and patient CP2A iPSCs. The scale bar represents 100 µm. B–D) Quantitative measurements were performed to assess the expression levels of NDUFB10, TOMM20, and MAP2 in control and patient cortical organoids. The y‐axis represents the mean fluorescence intensity. The data were presented as mean ± SD. Significance levels are indicated for P values less than 0.05, with **** indicating P < 0.000. Results not reaching statistical significance are denoted as ns (not significant). The information on sample size (n), probability (P) value, and the specific statistical test for each experiment was presented in Tables S5 and S9 (Supporting Information). E) Representative immunofluorescent imaging of staining for the mitochondrial transcription factor A (TFAM), neural progenitor marker SOX2, and mature neural marker MAP2 for cryo‐sectioned organoids at 90 days of differentiation from both control Detroit 551 and patient CP2A cortical organoids. Nuclei were counterstained with DAPI (blue). The scale bar represents 100 µm. F) Quantitative measurements were conducted to evaluate the expression level of TFAM in control and patient cortical organoids. The y‐axis represents the mean fluorescence intensity. The data were presented as mean ± SD. Significance levels are indicated for P values less than 0.05, with **** indicating P < 0.000. Results not reaching statistical significance are denoted as ns (not significant). The information on sample size (n), probability (P) value, and the specific statistical test for each experiment was presented in Tables S5 and S9 (Supporting Information).
Figure 5
Figure 5
Comparison of single‐cell transcriptomic profiling in cortical organoids from control and patient iPSCs. A,B) Cell clusters in 3‐month‐old organoids derived from control iPSCs were visualized using the scMRMA and UMAP algorithm A), and their density is depicted in B). C,D) The percentage distribution of all cell clusters C) and the neuro population D) in organoids at 3‐months old, which were derived from control iPSCs, were represented with the PCA algorithm. E,F) Cell clusters in 3‐month‐old organoids derived from patient iPSCs were visualized using the scMRMA and UMAP algorithm E), and their density is shown in F). G,H) The percentage distribution of all cell clusters G) and the neuro population H) in organoids at 3‐months old, which were derived from patient iPSCs, were represented with the PCA algorithm.
Figure 6
Figure 6
Comparison of molecular pathways in cortical organoids from control and patient iPSCs. A) The number of DEGs that are upregulated and downregulated in neuron population of patient CP2A cortical organoids compared to control cortical organoids. B) Volcano plot illustrating the DEGs in neuron population of patient CP2A cortical organoids compared to control cortical organoids. control cortical organoids C) GO biological progress enriches downregulated DEGs in neuron population of patient CP2A cortical organoids compared to control cortical organoids. patient cortical organoids control cortical organoids D) GO molecular functions enriched for downregulated DEGs in the neuron population of patient CP2A cortical organoids compared to control cortical organoids. control cortical organoids E) KEGG pathways enriched for downregulated DEGs in neuron population of patient CP2A cortical organoids compared to control cortical organoids. control cortical organoids F) KEGG pathways enriched for upregulated DEGs in neuron population of patient CP2A cortical organoids compared to control cortical organoids. control cortical organoids G) The number of DEGs that are upregulated and downregulated in glial cell population (astrocytes and radial glial cells) of patient CP2A cortical organoids compared to control cortical organoids. H) Volcano plot illustrating the DEGs in glial cell population (astrocytes and radial glial cells) in patient CP2A cortical organoids and control cortical organoids. I) GO biological processes enriched for upregulated DEGs in glial cell population (astrocytes and radial glial cells) in patient CP2A cortical organoids compared to control POLG CP2A‐isogenic control cortical organoids. J) GO cellular components enriched for upregulated DEGs in glial cell population (astrocytes and radial glial cells) in patient CP2A cortical organoids compared to control cortical organoids.
Figure 7
Figure 7
Comparison of lineage markers in patient brain organoid before and after metformin treatment. A) Representative phase contrast images of the cell morphology of patient WS5A brain organoids before and after metformin treatment at day 12, 19, 29, and 36. Black scale bar is 100 µm. B) Representative immunofluorescent imaging of cryo‐sectioned organoids at 36 days, staining the cortical pyramidal neuronal marker SATB2 (green), newborn neural marker TUJ1 (green), and reactivated astrocyte marker GFAP (red) in patient WS5A cortical organoids and patient WS5A cortical organoids treated with metformin. Scale bar is 100 µm. C–E) Quantitative measurements of the level of SATB2 D), GFAP E), and TUJ1 F) expression on day 36 in patient cortical organoids and patient cortical organoids treated with metformin. The Y‐axis represents the mean fluorescence intensity The data were presented as mean ± SD. Significance levels are indicated for P values less than 0.05, with ** indicating P < 0.01, *** indicating P < 0.001, **** indicating P < 0.000. Results not reaching statistical significance are denoted as ns (not significant). The information on sample size (n), probability (P) value, and the specific statistical test for each experiment was presented in Tables S5 and S9 (Supporting Information). F) Representative immunofluorescent imaging of cryo‐sectioned organoids, staining the presynaptic marker Synaptophysin (green), postsynaptic marker PSD‐95 (red), and mature neural marker MAP2 (purple) in patient WS5A cortical organoids and patient WS5A cortical organoids treated with metformin. Nuclei are stained with DAPI (blue). Scale bar is 100 µm. G,H) Quantitative measurements of the level of Synaptophysin G) and PSD‐95 H) expression in patient cortical organoids and patient cortical organoids treated with metformin. The Y‐axis represents the mean fluorescence intensity. The data were presented as mean ± SD. Significance levels are indicated for P values less than 0.05, with * indicating P < 0.05, ** indicating P < 0.01, *** indicating P < 0.001, **** indicating P < 0.000. Results not reaching statistical significance are denoted as ns (not significant). The information on sample size (n), probability (P) value, and the specific statistical test for each experiment was presented in Tables S5 and S9 (Supporting Information).
Figure 8
Figure 8
Metformin rescues the neuronal damage and mitochondrial defect in POLG patient brain organoid. A) Representative immunofluorescent imaging of cryo‐sectioned organoids at 90 days, showing the staining of NDUFB10 (green), TOMM20 (red), and MAP2 (purple) in patient WS5A cortical organoids and patient WS5A cortical organoids treated with metformin. Nuclei are stained with DAPI (blue). Scale bar is 100 µm. B–D) Quantitative measurements of the level of B) TOMM20, C) NDUFB10, and D) NDUFB10/TOMM20 expression in patient cortical organoids and patient treated with metformin. The Y‐axis represents the mean fluorescence intensity. The data were presented as mean ± SD. Significance levels are indicated for P values less than 0.05, with** indicating P < 0.01, *** indicating P < 0.001. The information on sample size (n), probability (P) value, the specific statistical test for each experiment was presented in Tables S5 and S9 (Supporting Information). E) Representative imaging of cryo‐sectioned organoids at 36 days, staining TFAM (red), SOX2 (green), and MAP2 (purple) in patient WS5A cortical organoids and patient WS5A cortical organoids treated with metformin. Nuclei are stained with DAPI (blue). Scale bar is 100 µm. F,G) Quantitative measurements of the level of TFAM F) and MAP2 G)in patient cortical organoids and patient cortical organoids treated with metformin. The Y‐axis represents the mean fluorescence intensity. The data were presented as mean ± SD. Significance levels are indicated for P values less than 0.05, with * indicating P < 0.05, ** indicating P < 0.01, *** indicating P < 0.001. The information on sample size (n), probability (P) value, and the specific statistical test for each experiment was presented in Tables S5 and S9 (Supporting Information).
Figure 9
Figure 9
Comparison of molecular pathways in cortical organoids from patient brain organoid before and after metformin treatment. A,B) Cell clusters in 3‐month‐old organoids derived from patient CP2A iPSCs with metformin treatment were visualized using the scMRMA and UMAP algorithm A), and their density is depicted in B). C,D) The percentage distribution of all cell clusters C) and the neuro population D) in patient CP2A cortical organoids with metformin treatment, were represented with the PCA algorithm. E) Percentage histogram showing the distribution of individual cell clusters in control cortical organoids, patient CP2A cortical organoids, and patient cortical organoids treated with metformin. F) KEGG pathways enriched for down‐regulated differentially expressed genes (DEGs) in the neuron population of patient CP2A cortical organoids compared to patient CP2A cortical organoids treated with metformin. G) GO cellular components enriched for up‐regulated DEGs in the neuron population of patient CP2A cortical organoids compared to patient CP2A cortical organoids treated with metformin. H) GO biological processes enriched for up‐regulated DEGs in the neuron population of patient CP2A cortical organoids compared to patient CP2A cortical organoids treated with metformin.

Similar articles

Cited by

References

    1. Swalwell H., Kirby D. M., Blakely E. L., Mitchell A., Salemi R., Sugiana C., Compton A. G., Tucker E. J., Ke B.‐X., Lamont P. J., Turnbull D. M., Mcfarland R., Taylor R. W., Thorburn D. R., Eur. J. Hum. Genet. 2011, 19, 769. - PMC - PubMed
    1. Gilea A. I., Berti C. C., Magistrati M., di Punzio G., Goffrini P., Baruffini E., Dallabona C., Genes 2021, 12, 1866. - PMC - PubMed
    1. Lamantea E., Tiranti V., Bordoni A., Toscano A., Bono F., Servidei S., Papadimitriou A., Spelbrink H., Silvestri L., Casari G., Comi G. P., Zeviani M., Ann. Neurol. 2002, 52, 211. - PubMed
    1. Van Goethem G., Martin J. J., Dermaut B., Löfgren A., Wibail A., Ververken D., Tack P., Dehaene I., Van Zandijcke M., Moonen M., Ceuterick C., De Jonghe P., Van Broeckhoven C., Neuromuscular Disord. 2003, 13, 133. - PubMed
    1. Hakonen A. H., Heiskanen S., Juvonen V., Lappalainen I., Luoma P. T., Rantamaki M., Van Goethem G., Lofgren A., Hackman P., Paetau A., Kaakkola S., Majamaa K., Varilo T., Udd B., Kaariainen H., Bindoff L. A., Suomalainen A., Am. J. Hum. Genet. 2005, 77, 430. - PMC - PubMed

MeSH terms

LinkOut - more resources