. 2024 Mar 1;155(3):1813-1824.
doi: 10.1121/10.0025137.

Effects of contralateral noise on envelope-following responses, auditory-nerve compound action potentials, and otoacoustic emissions measured simultaneously

Affiliations

Effects of contralateral noise on envelope-following responses, auditory-nerve compound action potentials, and otoacoustic emissions measured simultaneously

Shelby L Faubion et al. J Acoust Soc Am. .

Abstract

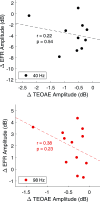
This study assessed whether the effects of contralateral acoustic stimulation (CAS) are consistent with eliciting the medial olivocochlear (MOC) reflex for measurements sensitive to outer hair cell (otoacoustic emissions, OAEs), auditory-nerve (AN; compound action potential, CAP), and brainstem/cortical (envelope-following response, EFR) function. The effects of CAS were evaluated for simultaneous measurement of OAEs, CAPs, and EFRs in participants with normal hearing. Clicks were presented at 40 or 98 Hz in three ipsilateral noise conditions (no noise, 45 dB SPL, and 55 dB SPL). For the no noise condition, CAS suppressed or enhanced EFR amplitudes for 40- and 98-Hz clicks, respectively, while CAS had no significant effect on CAP amplitudes. A follow-up experiment using slower rates (4.4-22.2 Hz) assessed whether this insignificant CAS effect on CAPs was from ipsilateral MOC stimulation or AN adaptation; however, CAS effects remained insignificant despite favorable signal-to-noise ratios. CAS-related enhancements of EFR and CAP amplitudes in ipsilateral noise were not observed, contrary to the anti-masking effect of the MOC reflex. EFR and OAE suppression from CAS were not significantly correlated. Thus, the effects of CAS on EFRs may not be solely mediated by the MOC reflex and may be partially mediated by higher auditory centers.


Conflict of interest statement

The authors have no conflicts to disclose.

Figures

FIG. 1.
FIG. 1.
(Color online) Schematic of one interleaved presentation of the stimuli. Click trains were presented to the right ear in alternating polarity and are displayed in the top half of the panel (red waveform). The number of clicks is reduced by a factor of 10 to aid visualization of the click train. The gray waveform in the top panel (right ear) represents ipsilateral broadband noise (when present). CBBN was presented to the left ear and is shown in the bottom half of the panel (blue waveform). Two stimulus conditions (−CAS and +CAS) are depicted and separated by a 2-s interval of CBBN presented alone.
FIG. 2.
FIG. 2.
(Color online) Schematic of the equipment setup for simultaneous measurements of TEOAEs, CAPsENV, and EFRs. Transducers (ER3Cs) for the probe (click train) and CAS (broadband noise) are displayed near the top of the right panel. Reference (Ref.) and ground (Gnd.) electrodes are denoted by red and green lines while active electrodes are shown by purple [TM, channel 1 (Ch. 1)] and yellow [high forehead, EFR, channel 2 (Ch. 2)] lines, respectively. The panel to the left depicts a zoomed view of the setup for the right ear, which includes a microphone (Mic.) for measuring ear canal sound pressure.
FIG. 3.
FIG. 3.
(Color online) EFR magnitude in response to clicks presented at 40 Hz (left) and 98 Hz (right) for individual subjects (x axis). Each panel shows EFR magnitude in the −CAS (black- or red-filled bars) and +CAS (white-filled bars) conditions. The noise floors for each participant are displayed as gray bars.
FIG. 4.
FIG. 4.
(Color online) CAPENV magnitude in response to clicks presented at 40 Hz (left) and 98 Hz (right) for individual subjects (x axis). Each panel shows CAPENV magnitude in the −CAS (black- or red-filled bars) and +CAS (white-filled bars) conditions. The noise floors for each participant are displayed as gray bars.
FIG. 5.
FIG. 5.
(Color online) Group-average EFR magnitudes as a function of ipsilateral broadband noise level for clicks presented at 40- (black-bordered bars) and 98-Hz (red-bordered bars) repetition rates in the −CAS (filled bars) and +CAS (open bars) conditions. The group-averaged noise floor is depicted by the gray bars. Error bars are one standard error of the mean. Asterisks represent significant comparisons for α < 0.01.
FIG. 6.
FIG. 6.
(Color online) Group-average CAPENV magnitudes as a function of ipsilateral broadband noise level for clicks presented at 40- (black-bordered bars) and 98-Hz (red-bordered bars) repetition rates in the −CAS (filled bars) and +CAS (open bars) conditions. The group-averaged noise floor is depicted by the gray bars. Error bars are one standard error of the mean.
FIG. 7.
FIG. 7.
(Color online) Magnitudes [(A) and (B)] and suppression [(C) and (D)] of TEOAEs for individual participants (x axis) measured using 40- (left panels, black) and 98-Hz click trains (right panels, red). Suppression could not be computed in two subjects in the 40-Hz condition due to poor SNRs.
FIG. 8.
FIG. 8.
(Color online) Scatterplots and regression lines for EFR and TEOAE suppression for data obtained with the 40- (top panel, black) and 98-Hz (bottom panel, red) clicks.
FIG. 9.
FIG. 9.
(Color online) Grand average (N = 12) CAPENV [(A), (B), and (C)] and EFR (D) waveforms in response to trains of 60 dB SPL chirps presented at 4.4 (A), 11.1 (B), and 22.2 Hz [(C) and (D)]. The gray shaded rectangle in each panel marks the presentation of CAS. Shaded areas circumscribing the waveforms represent ±1 standard error of the mean. EFR waveforms for the 4.4- and 11.1-Hz chirp trains are not displayed because the effects of CAS were not significant for these frequencies.

Similar articles

References

    1. Backus, B. C. , and Guinan, J. J. (2006). “ Time-course of the human medial olivocochlear reflex,” J. Acoust. Soc. Am. 119, 2889–2904.10.1121/1.2169918 - DOI - PubMed
    1. Berlin, C. I. , Hood, L. J. , Wen, H. , Szabo, P. , Cecola, R. P. , Rigby, P. , and Jackson, D. F. (1993). “ Contralateral suppression of non-linear click-evoked otoacoustic emissions,” Hear. Res. 71, 1–11.10.1016/0378-5955(93)90015-S - DOI - PubMed
    1. Billings, C. J. , Gordon, S. Y. , McMillan, G. P. , Gallun, F. J. , Molis, M. R. , and Konrad-Martin, D. (2020). “ Noise-induced enhancement of envelope following responses in normal-hearing adults,” J. Acoust. Soc. Am. 147, EL201–EL207.10.1121/10.0000627 - DOI - PMC - PubMed
    1. Bohorquez, J. , and Ozdamar, O. (2008). “ Generation of the 40-Hz auditory steady-state response (ASSR) explained using convolution,” Clin. Neurophysiol. 119, 2598–2607.10.1016/j.clinph.2008.08.002 - DOI - PubMed
    1. Boothalingam, S. , Peterson, A. , Powell, L. , and Easwar, V. (2023). “ Auditory brainstem mechanisms likely compensate for self-imposed peripheral inhibition,” Sci. Rep. 13, 12693.10.1038/s41598-023-39850-8 - DOI - PMC - PubMed

Publication types

LinkOut - more resources