Clinical Trial
. 2024 May 9;143(19):1937-1952.
doi: 10.1182/blood.2023022666.

Circulating hematopoietic stem/progenitor cell subsets contribute to human hematopoietic homeostasis

Affiliations
Clinical Trial

Circulating hematopoietic stem/progenitor cell subsets contribute to human hematopoietic homeostasis

Pamela Quaranta et al. Blood. .

Abstract

In physiological conditions, few circulating hematopoietic stem/progenitor cells (cHSPCs) are present in the peripheral blood, but their contribution to human hematopoiesis remain unsolved. By integrating advanced immunophenotyping, single-cell transcriptional and functional profiling, and integration site (IS) clonal tracking, we unveiled the biological properties and the transcriptional features of human cHSPC subpopulations in relationship to their bone marrow (BM) counterpart. We found that cHSPCs reduced in cell count over aging and are enriched for primitive, lymphoid, and erythroid subpopulations, showing preactivated transcriptional and functional state. Moreover, cHSPCs have low expression of multiple BM-retention molecules but maintain their homing potential after xenotransplantation. By generating a comprehensive human organ-resident HSPC data set based on single-cell RNA sequencing data, we detected organ-specific seeding properties of the distinct trafficking HSPC subpopulations. Notably, circulating multi-lymphoid progenitors are primed for seeding the thymus and actively contribute to T-cell production. Human clonal tracking data from patients receiving gene therapy (GT) also showed that cHSPCs connect distant BM niches and participate in steady-state hematopoietic production, with primitive cHSPCs having the highest recirculation capability to travel in and out of the BM. Finally, in case of hematopoietic impairment, cHSPCs composition reflects the BM-HSPC content and might represent a biomarker of the BM state for clinical and research purposes. Overall, our comprehensive work unveiled fundamental insights into the in vivo dynamics of human HSPC trafficking and its role in sustaining hematopoietic homeostasis. GT patients' clinical trials were registered at ClinicalTrials.gov (NCT01515462 and NCT03837483) and EudraCT (2009-017346-32 and 2018-003842-18).


Conflict of interest statement

Conflict-of-interest disclosure: The authors declare no competing financial interests.

Figures

None
Graphical abstract
Figure 1.
Figure 1.
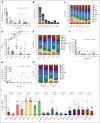
cHSPC count and composition change in association with aging and hematopoietic impairment. (A) Correlation between cHSPC absolute count and age of healthy donors (HDs) analyzed. (B-C) Stacked bar graphs displaying the absolute counts (B) and relative composition (C) of PB-HSPC subsets in HDs of distinct age classes. HDs were classified according to age into neonates (NEON), infants (with 3 subgroups: PED 1, PED 2, PED 3), adolescent (PED 4), adult (AD), and older (AGED), as reported in supplemental Table 1. (D) Cell count of cHSPC in PED1/2 group, PED3/4 group, and patients affected by WAS (n = 12), ADA (n = 11), THAL (n = 7), and BMFS (n = 5). Pediatric individuals are represented as triangle (PED1), circles (PED2), square (PED3), and diamonds (PED4) according to their age. Mann-Whitney statistical test was applied for groups’ comparison, and single P values are reported within the graph. (E) Stacked bar graphs displaying the relative composition of cHSPC subsets in PED1/2 groups, PED3/4 groups, and patients with WAS, ADA and THAL. Results of Mann-Whitney statistical test applied for groups’ comparison are reported in supplemental Table 8. (F) Correlation between the number of colony-forming units (CFUs) obtained from 250 μL of whole PB and the age of healthy donors. (G) Correlation between the CFUs retrieved from 250 μL of whole PB and the absolute counts of cHSPCs in patients with WAS, ADA-SCID, THAL, and BMFS. (H) Stacked bar graph displaying the compositions of BM- and PB-HPSCs derived from age-matched healthy individuals (PED and AD). (I) Circulation indexes (CIs) of the single HSPC subpopulations in pediatric and adult donors. Mann-Whitney statistical test was applied for pediatric vs adult CI comparisons, and single P values are reported within the graphs. Kruskal-Wallis test with Dunn multiple comparisons was applied for CI comparisons among the distinct HSPC subsets, and the results are reported in supplemental Table 9. (B-C,E,H) Data are shown as mean with standard error of the mean (SEM). (I) Each dot represents a single individual, and the colored bars show the median value. (A,F-G) Statistical test for correlation: Spearman r. Spearman correlation coefficient (r) and P values are reported in each figure.
Figure 2.
Figure 2.
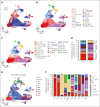
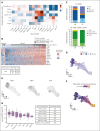
Single-cell transcriptional and phenotypic profiling of human PB– and BM–derived HSPC subpopulations. (A) UMAP embedding, coloring cells by BM (red) and PB (blue) sources. (B) UMAP embedding showing 18 seurat clusters identified after unsupervised clustering. (C) UMAP embedding showing seurat clusters 1 to 17 and subclusters of seurat cluster 0. The legend on the right shows the annotation of the single clusters. (D) Stacked bar graph showing the distribution of the transcriptional clusters in BM- and PB-HSPCs. The dominant transcriptional signatures identified for PB-HSPCs are reported. (E) UMAP embedding showing the distinct phenotypic HSPC subpopulations identified by antibody derived tag (ADT) protein barcoding. (F) Distribution of the transcriptional clusters in the 10 ADT–defined HSPC subpopulations. Clusters are grouped according to the expressed HSPC transcriptional signature.
Figure 3.
Figure 3.
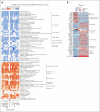
cHSPCs show a preactivated state associated with higher in vitro differentiation efficiency than BM-HSPCs. (A) Tile plot of the top 5 GO-BP macrocategories for each cluster. Statistically significant GO-BP ontology gene sets (adjusted P < .05) with an enriched expression in PB (NES > 0) or BM (NES < 0) are shown in blue and red, respectively. For each macrocategory, color intensity is proportional to NES absolute values. Macrocategories were classified in diverse groups, according to the associated biological functions. (B) Heat map showing the scaled expression of cluster 1 marker genes that are differentially expressed between PB and BM (adjusted P < .05; logFC ≥0.4 or ≤0.4.) cells. Genes are grouped by biological functions. Annotation for BM (red) and PB (blue) cells is reported. (C) UMAP embedding grouping cells by source and coloring by inferred cell cycle. (D) Histograms representing the percentage of cells in G0, G1, S, and G2M cell cycle phases for each cluster in the BM (top) and the PB (bottom) data sets. The x-axis shows cluster annotation according to the HSPC subset transcriptional signatures. Classification of the cell cycle activity was performed on the overall data set, shown in supplemental Figure 7B, and then reported on BM (top) and PB (bottom) single data sets. (E) Summary of the differentiation efficiency of PB-HSPCs (n = 4) and BM-HSPCs (n = 3) in our single-cell in vitro differentiation assay. The number of seeded wells, the count of wells showing differentiated progeny after 3 weeks of culture, and the total differentiation efficiency starting from one single cell are reported. (F) Pie charts representing the frequencies of BM- and PB-HSPC showing specific lineage scores detected at the end of the single-cell in vitro differentiation assay. GO-BP, gene ontology-biological processes; NES, normalized enrichment score.
Figure 3.
Figure 3.
cHSPCs show a preactivated state associated with higher in vitro differentiation efficiency than BM-HSPCs. (A) Tile plot of the top 5 GO-BP macrocategories for each cluster. Statistically significant GO-BP ontology gene sets (adjusted P < .05) with an enriched expression in PB (NES > 0) or BM (NES < 0) are shown in blue and red, respectively. For each macrocategory, color intensity is proportional to NES absolute values. Macrocategories were classified in diverse groups, according to the associated biological functions. (B) Heat map showing the scaled expression of cluster 1 marker genes that are differentially expressed between PB and BM (adjusted P < .05; logFC ≥0.4 or ≤0.4.) cells. Genes are grouped by biological functions. Annotation for BM (red) and PB (blue) cells is reported. (C) UMAP embedding grouping cells by source and coloring by inferred cell cycle. (D) Histograms representing the percentage of cells in G0, G1, S, and G2M cell cycle phases for each cluster in the BM (top) and the PB (bottom) data sets. The x-axis shows cluster annotation according to the HSPC subset transcriptional signatures. Classification of the cell cycle activity was performed on the overall data set, shown in supplemental Figure 7B, and then reported on BM (top) and PB (bottom) single data sets. (E) Summary of the differentiation efficiency of PB-HSPCs (n = 4) and BM-HSPCs (n = 3) in our single-cell in vitro differentiation assay. The number of seeded wells, the count of wells showing differentiated progeny after 3 weeks of culture, and the total differentiation efficiency starting from one single cell are reported. (F) Pie charts representing the frequencies of BM- and PB-HSPC showing specific lineage scores detected at the end of the single-cell in vitro differentiation assay. GO-BP, gene ontology-biological processes; NES, normalized enrichment score.
Figure 4.
Figure 4.
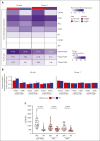
cHSPCs display reduced expression of molecules controlling BM retention. (A) Heat map showing the average normalized gene expression of factors controlling BM retention (top) and the percentage of cells coexpressing genes encoding for integrins driving BM homing (dimer-DP cells) (bottom) in all cells as well as in cells from cluster 1 (LT-HSC) of BM (red) and PB (blue) origin. Asterisks show statistically significant differential frequencies of DP cells between the 2 sources (χ2 test, Bonferroni-adjusted P < .05). (B) Bar plots showing the average normalized expression of genes encoding for single integrin chains in ITGA4:ITGB1-, ITGA6:ITGB1-, and ITGA9:ITGB1-DP cells from total data set and LT-HSC (cluster 1) of BM (red) and PB (blue) origin. Asterisks show statistically significant differential gene expression between the 2 sources (2-sided Student t test, Bonferroni-adjusted P < .05). (C) Violin plots showing CXCR4 mean intensity of fluorescence (MFI) in total HSPCs, HSCs, and MPPs derived from HD-BM (n = 30) and -PB (n = 26). Mann-Whitney statistical test was applied for groups’ comparison and single P values are reported within the graph. AvgBM, average normalized gene expression in BM cells; AvgPB, average normalized gene expression in PB cells.
Figure 5.
Figure 5.
cHSPC subsets show differential migratory propensities toward extramedullary organs. (A) Heat map showing the scaled organ-specific module scores (top-20 DE genes, rows) evaluated for each PB-HSPC cluster (columns). (B) Heat map showing the scaled expression levels of TSP1 genes (rows) across MLPs (columns, clusters 4). Cells were clustered into K = 3 groups by K-means clustering algorithm. The table below displays the proportion of TSP1-high MLP in BM and PB. (C) Histograms showing the relative frequencies of the lymphoid cellular outputs of BM- and PB-MLPs detected at the end of the T-cell differentiation assay. The histogram above displays the proportions of CD4/CD8 double-negative (DN), CD4/CD8 double positive (DP), CD4 single-positive (CD4+ SP), and CD8 single-positive (CD8+ SP) cells detected within CD3+ cell compartment. The histogram below shows the proportions of T-cell precursors within the CD3 CD56 CD19 cell fraction. Data are shown as mean ± SEM. (D) UMAP embedding of the integrated scRNAseq data set, coloring cells by source: BM (red), PB (blue), and thymus (violet). (E) Density plots, showing cell classification as TSP1, TSP2, or ETP. (F) UMAP embedding, showing Monocle3 estimated pseudotime. (G) Percentages of TSP1 genes expressed (UMI > 0) by lymphoid–circulating CD34+ cells selected from a published peripheral blood mononuclear cells (PBMC) scRNAseq data set of healthy individuals from distinct ranges of age. The significance of the 1-way analysis of variance test across age classes revealed differences in the percentage of expressed TSP1 genes (P < .0001). These differences were then assessed through pairwise t test. Multiple hypotheses testing issue was accounted for adjusting the P values through the Benjamini-Hochberg method.
Figure 6.
Figure 6.
Modeling the in vivo trafficking of human HSPCs through IS clonal tracking. Venn diagrams show a schematic representation of the groups considered for the IS sharing analysis in each figure and report the IS number of the compared groups. (A) Histogram showing the relative frequencies of IS shared between BM PRIMITIVE (HSC + MPP, red), LYMPHOID (MLP + PreBNK, green), and MYELOID (CMP + GMP + MEP, blue) HSPC subsets and PB-HSPCs. (B) Histogram showing the relative frequencies of IS shared (yellow) and not shared (purple) between BM-HSPCs from 2 BM distant sites also recaptured in PB-HSPCs. (C) Histogram showing the relative frequencies of IS shared between BM PRIMITIVE (red), LYMPHOID (green), and MYELOID (blue) HSPC subsets from 2 BM distant sites also recaptured in PB-HSPCs. (D) Histogram showing the relative frequencies of IS shared between BM- or PB-HSPCs and PB T cells. (E) Histogram showing the relative frequencies of IS found in the shared fraction between BM-MLP and PB-HSPC (yellow), only in PB-HSPCs (blue) or only in BM-MLPs (red) that are also shared (dark colors) or not shared (light colors) with PB T cells. (F) Histogram showing the relative frequencies of IS found only in BM-HSPCs (red), only in PB-HSPCs (blue), and in the shared fraction between BM- and PB-HSPCs (yellow) that are also shared (dark colors) or not shared (light colors) with PB mature lineages. (G) Histograms showing the relative frequencies of IS found only in BM-HSPCs (red), only in PB-HSPCs (blue), and in the shared fraction between BM- and PB-HSPCs (yellow) that were detected in both myeloid and lymphoid (multilineage), in only myeloid (only myelo) and in only lymphoid (only lympho) PB mature cells. (H) Density plots representing the log10 sequence count distribution relative to IS found in BM-HSPCs (left) and in PB-HSPCs (right). The dot line refers to the clones shared between the 2 sources, whereas solid lines show the clonal abundance of not shared IS. Mann-Whitney test was performed to compare the sequence count distribution. For panels A-E,G, the P values shown in the figure were computed through Fisher exact test. Whenever >2 groups were compared, the nominal P values were adjusted with Bonferroni correction. Only significant P < .05 are shown in the plots.
Figure 6.
Figure 6.
Modeling the in vivo trafficking of human HSPCs through IS clonal tracking. Venn diagrams show a schematic representation of the groups considered for the IS sharing analysis in each figure and report the IS number of the compared groups. (A) Histogram showing the relative frequencies of IS shared between BM PRIMITIVE (HSC + MPP, red), LYMPHOID (MLP + PreBNK, green), and MYELOID (CMP + GMP + MEP, blue) HSPC subsets and PB-HSPCs. (B) Histogram showing the relative frequencies of IS shared (yellow) and not shared (purple) between BM-HSPCs from 2 BM distant sites also recaptured in PB-HSPCs. (C) Histogram showing the relative frequencies of IS shared between BM PRIMITIVE (red), LYMPHOID (green), and MYELOID (blue) HSPC subsets from 2 BM distant sites also recaptured in PB-HSPCs. (D) Histogram showing the relative frequencies of IS shared between BM- or PB-HSPCs and PB T cells. (E) Histogram showing the relative frequencies of IS found in the shared fraction between BM-MLP and PB-HSPC (yellow), only in PB-HSPCs (blue) or only in BM-MLPs (red) that are also shared (dark colors) or not shared (light colors) with PB T cells. (F) Histogram showing the relative frequencies of IS found only in BM-HSPCs (red), only in PB-HSPCs (blue), and in the shared fraction between BM- and PB-HSPCs (yellow) that are also shared (dark colors) or not shared (light colors) with PB mature lineages. (G) Histograms showing the relative frequencies of IS found only in BM-HSPCs (red), only in PB-HSPCs (blue), and in the shared fraction between BM- and PB-HSPCs (yellow) that were detected in both myeloid and lymphoid (multilineage), in only myeloid (only myelo) and in only lymphoid (only lympho) PB mature cells. (H) Density plots representing the log10 sequence count distribution relative to IS found in BM-HSPCs (left) and in PB-HSPCs (right). The dot line refers to the clones shared between the 2 sources, whereas solid lines show the clonal abundance of not shared IS. Mann-Whitney test was performed to compare the sequence count distribution. For panels A-E,G, the P values shown in the figure were computed through Fisher exact test. Whenever >2 groups were compared, the nominal P values were adjusted with Bonferroni correction. Only significant P < .05 are shown in the plots.

Comment in

References

    1. Massberg S, Schaerli P, Knezevic-Maramica I, et al. Immunosurveillance by hematopoietic progenitor cells trafficking through blood, lymph, and peripheral tissues. Cell. 2007;131(5):994–1008. - PMC - PubMed
    1. Burberry A, Zeng MY, Ding L, et al. Infection mobilizes hematopoietic stem cells through cooperative NOD-like receptor and toll-like receptor signaling. Cell Host Microbe. 2014;15(6):779–791. - PMC - PubMed
    1. Cohen KS, Cheng S, Larson MG, et al. Circulating CD34+ progenitor cell frequency is associated with clinical and genetic factors. Blood. 2013;121(8):e50–e56. - PMC - PubMed
    1. Tsaganos T, Giamarellos-Bourboulis EJ, Kollias S, et al. Kinetics of progenitor hemopoetic stem cells in sepsis: correlation with patients’ survival? BMC Infect Dis. 2006;6(142):142–147. - PMC - PubMed
    1. Skirecki T, Mikaszewska-Sokolewicz M, Godlewska M, et al. Mobilization of stem and progenitor cells in septic shock patients. Sci Rep. 2019;9(1):3289–3310. - PMC - PubMed

Publication types

Associated data