. 2024 Mar 26;43(3):113899.
doi: 10.1016/j.celrep.2024.113899. Epub 2024 Mar 5.

LPD-3 as a megaprotein brake for aging and insulin-mTOR signaling in C. elegans

Affiliations

LPD-3 as a megaprotein brake for aging and insulin-mTOR signaling in C. elegans

Taruna Pandey et al. Cell Rep. .

Abstract

Insulin-mechanistic target of rapamycin (mTOR) signaling drives anabolic growth during organismal development; its late-life dysregulation contributes to aging and limits lifespans. Age-related regulatory mechanisms and functional consequences of insulin-mTOR remain incompletely understood. Here, we identify LPD-3 as a megaprotein that orchestrates the tempo of insulin-mTOR signaling during C. elegans aging. We find that an agonist insulin, INS-7, is drastically overproduced from early life and shortens lifespan in lpd-3 mutants. LPD-3 forms a bridge-like tunnel megaprotein to facilitate non-vesicular cellular lipid trafficking. Lipidomic profiling reveals increased hexaceramide species in lpd-3 mutants, accompanied by up-regulation of hexaceramide biosynthetic enzymes, including HYL-1. Reducing the abundance of HYL-1, insulin receptor/DAF-2 or mTOR/LET-363, normalizes INS-7 levels and rescues the lifespan of lpd-3 mutants. LPD-3 antagonizes SINH-1, a key mTORC2 component, and decreases expression with age. We propose that LPD-3 acts as a megaprotein brake for organismal aging and that its age-dependent decline restricts lifespan through the sphingolipid-hexaceramide and insulin-mTOR pathways.

Keywords: CP: Metabolism; CP: Molecular biology; Caenorhabditis elegans; IIS-mTOR; INS-7; LPD-3; aging; hexaceramide; hyperfunction; mitochondrial pathway; molecular damages; sphingolipid.


Conflict of interest statement

Declaration of interests The authors declare no competing interests.

Figures
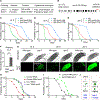
Figure 1.
Figure 1.. Hyperactivation of ins-7 causes the shortened lifespan in lpd-3 mutants
(A) Cellular function and organismic phenotypes for LPD-3 and the human homolog BLTP1. (B) Gene diagram showing two alleles of lpd-3 examined for lifespan phenotypes. (C) Lifespan analysis of wild type versus lpd-3 mutants with two different alleles (ok2138 and wy1772) grown at 15°C.(p < 0.0001, log-rank test). (D) Lifespan analysis of wild type versus lpd-3 mutants with two different alleles (ok2138 and wy1772) grown at 20°C.(p < 0.0001, log-rank test). (E) Lifespan analysis of wild type versus lpd-3 mutants with two different alleles (ok2138 and wy1772) grown at 25°C.(p < 0.0001, log-rank test). (F) RNA-seq results showing increased ins-7 expression in lpd-3 mutants. Values are means ± SD, ***p < 0.001 (n = 3 biological replicates). (G) Representative bright-field and epifluorescence images showing drastically increased ins-7p∷INS-7∷GFP abundance in lpd-3 mutants. Scale bar, 100 μm. (H) Lifespan analysis of wild type and lpd-3(ok2138) mutants with control or ins-7 RNAi at 20°C, showing the shortened lifespan of lpd-3(ok2138) rescued by ins-7 RNAi (p < 0.0001, log-rank test). (I) Lifespan analysis of lpd-3(ok2138) mutants with control or daf-2 RNAi at 20°C, showing the shortened lifespan of lpd-3(ok2138) rescued by daf-2 RNAi (p < 0.0001, log-rank test). (J) Schematic diagrams illustrating a model of how LPD-3 regulates aging via INS-7 and DAF-2 in wild type and lpd-3 mutants.
Figure 2.
Figure 2.. LPD-3 regulates INS-7 via the sphingolipid-ceramide-mTORC2 axis
(A) Table summarizing effects of RNAi against genes in the insulin/mTORC1/mTORC2 pathway on ins-7p∷INS-7∷GFP levels in lpd-3(ok2138) mutants. The asterisk (*) indicates GFP intensity qualitatively observed under an epifluorescence stereomicroscope. (B) Representative bright-field and epifluorescence images showing ins-7p∷INS-7∷GFP up-regulation in lpd-3(ok2138) mutants can be suppressed by RNAi against daf-2, rict-1, or hyl-1. Scale bar, 100 μm. (C) Quantification of the fluorescence intensities of INS-7∷GFP in lpd-3(ok2138) mutants with indicated RNAi treatment. Values are means ± SD, ****p < 0.0001 (N = 11 animals, one-way ANOVA, Tukey honestly significant difference [HSD] post hoc test). (D) Lipidomic quantification of hexaceramide species in wild type and lpd-3(ok2138) mutants. Values are means ± SD (n= 3 biological replicates, two-way ANOVA, Tukey HSD post hoc test). (E) Schematic showing biosynthetic pathways of hexaceramide, including sphingosine conversion to ceramide by HYL-1 and ceramide to hexaceramide by CGT-1/2/3. (F) RNA-seq results showing increased hyl-1 and cgt-1/2/3 expression in lpd-3(ok2138) mutants. Values are means ± SD, ***p < 0.001 (n= 3 biological replicates, two-way ANOVA, Tukey HSD post hoc test). (G) Lifespan analysis of lpd-3(ok2138) mutants with control or rict-1 RNAi at 20°C, showing rescued lifespan (p < 0.0001, log-rank test). (H) Lifespan analysis of lpd-3(ok2138) mutants with control or hyl-1 RNAi at 20°C, showing rescued lifespan (p < 0.0001, log-rank test). (I) Lifespan analysis of lpd-3(ok2138) mutants with control or sgk-1 RNAi at 20°C, showing rescued lifespan (p < 0.0001, log-rank test).
Figure 3.
Figure 3.. Loss of LPD-3 dysregulates SINH-1/mTORC2 and mitochondria
(A) Schematic showing key components of the mTORC2 complex in the SINH-1∷GFP-tagged C. elegans. (B) Schematic gene structure of sinh-1 showing the CRISPR-mediated knockin allele encoding the endogenous SINH-1 tagged with a linker (GGGS), PreScission Protease site (PPS), and GFP. Scale bar: 100 bp. (C) Representative z stack confocal fluorescence images showing undetectable SINH-1∷GFP signals in animals treated with control but increased SINH-1∷GFP enrichment along the apical intestinal membrane in lpd-3(ok2138) mutants (non-specific gut autofluorescence decreased by glo-4 RNAi also indicated). Scale bar, 50 μm. (D) Quantification of the penetrance of SINH-1∷GFP enrichment at the apical intestinal membrane in animals with indicated RNAi treatment. Values are means ± SEM, ***p < 0.001 (N = 3 independent experiments, n > 10 in each trial, one-way ANOVA, Tukey HSD post hoc test). (E) Representative confocal fluorescence images showing decreased LPD-3∷GFP by lpd-3 RNAi. Scale bar, 50 0μm. (F) Representative confocal fluorescence images showing increased spherical MAI-2∷GFP-marked mitochondria in lpd-3 mutants (day 1) that can be normalized by sinh-1 but not control RNAi. Scale bar, 50 μm. (G) Quantification showing rescued mitochondrial morphological defects in lpd-3(ok2138) mutants by RNAi against genes encoding the mitochondrial fission machinery (drp-1) or insulin-mTOR pathway components (e.g., sinh-1). Values are means ± SEM, ***p < 0.001 (n = 8 animals per group, one-way ANOVA, Tukey HSD post hoc test).
Figure 4.
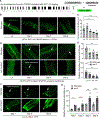
Figure 4.. LPD-3 abundance and functions decline with age in wild-type animals
(A) Schematic gene structure of lpd-3 showing the CRISPR-mediated knockin allele encoding the endogenous LPD-3 tagged with a split GFP1–10 that is complemented by an intestine-expressed GFP11. Scale bar: 500 bp. (B) Representative confocal fluorescence images showing age-dependent decrease in the abundance of LPD-3∷GFP signals in the intestinal apical membrane of animals at the stages of L4 and days 1, 3, 5, and 9 post-L4. Scale bar: 50 μm. (C) Quantification of the fluorescence intensities of LPD-3∷GFP in animals with indicated ages. Values are means ± SEM, ***p < 0.001 (N = 6 biological replicates, one-way ANOVA, Tukey HSD post hoc test). (D) Representative confocal fluorescence images showing age-dependent decrease in the abundance of Akt-PH∷GFP signals that label PIP2/3 in the intestinal apical membrane of animals at the stages of L4 and days 1, 3, 5, and 9 post-L4 in both wild type and lpd-3 mutants. Scale bar: 50 μm. (E) Quantification of the fluorescence intensities of Akt-PH∷GFP at apical intestinal membranes in animals with indicated ages. Values are means ± SEM, ***p < 0.001 (N = 8 biological replicates in each stage, N = 32 in each genotype yielding mean fluorescence intensities; one-way ANOVA, Tukey HSD post hoc test). (F) Representative confocal fluorescence images showing age-dependent increase in the abundance of ins-7p∷INS-7∷GFP signals in animals at the indicated stages in both wild type and lpd-3 mutants. Scale bar: 50 μm. (G) Quantification of the fluorescence intensities of ins-7p∷INS-7∷GFP in animals with indicated ages. Values are means ± SEM, with **p < 0.01 and ***p < 0.001 (N = 7 biological replicates, two-way ANOVA, Tukey HSD post hoc test).

Update of

References

    1. Gavrilov LA, and Gavrilova NS (2002). Evolutionary Theories of Aging and Longevity. Sci. World J 2, 339–356. 10.1100/tsw.2002.96. - DOI - PMC - PubMed
    1. Flatt T, and Partridge L (2018). Horizons in the evolution of aging. BMC Biol. 16, 93. 10.1186/s12915-018-0562-z. - DOI - PMC - PubMed
    1. Pandey T, and Ma DK (2022). Stress-Induced Phenoptosis: Mechanistic Insights and Evolutionary Implications. Biochemistry 87, 1504–1511. 10.1134/S0006297922120082. - DOI - PubMed
    1. Blagosklonny MV (2022). Hallmarks of cancer and hallmarks of aging. Aging (Albany NY) 14, 4176–4187. 10.18632/aging.204082. - DOI - PMC - PubMed
    1. López-Otín C, Blasco MA, Partridge L, Serrano M, and Kroemer G (2013). The Hallmarks of Aging. Cell 153, 1194–1217. 10.1016/j.cell.2013.05.039. - DOI - PMC - PubMed

MeSH terms