

Common modular architecture across diverse cortical areas in early development
- PMID: 38446851
- PMCID: PMC10945769
- DOI: 10.1073/pnas.2313743121
Common modular architecture across diverse cortical areas in early development
Abstract
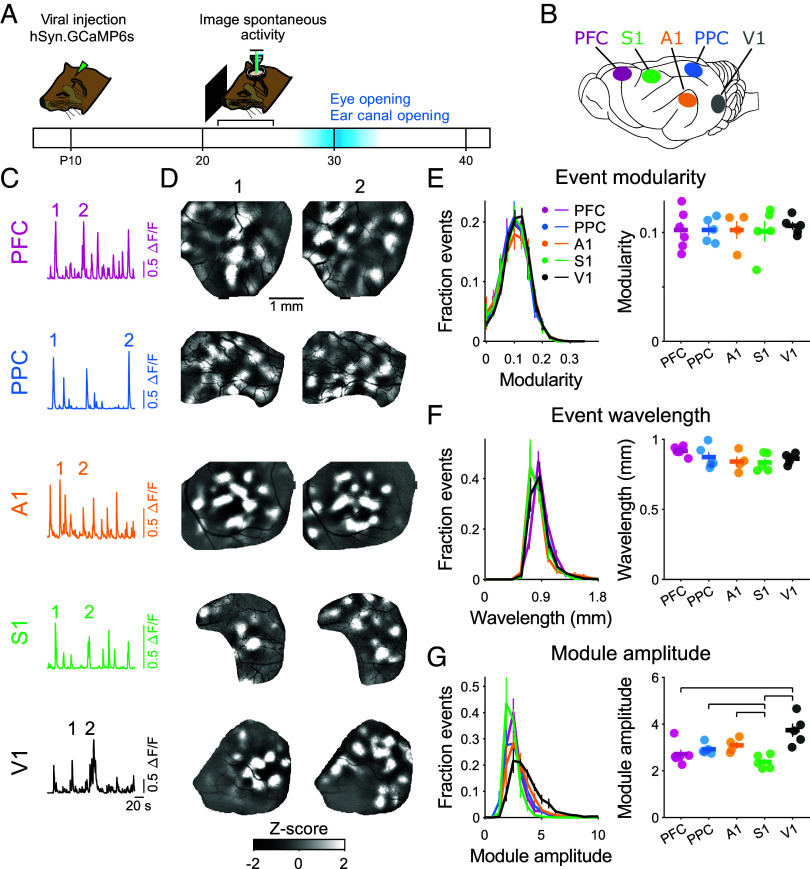
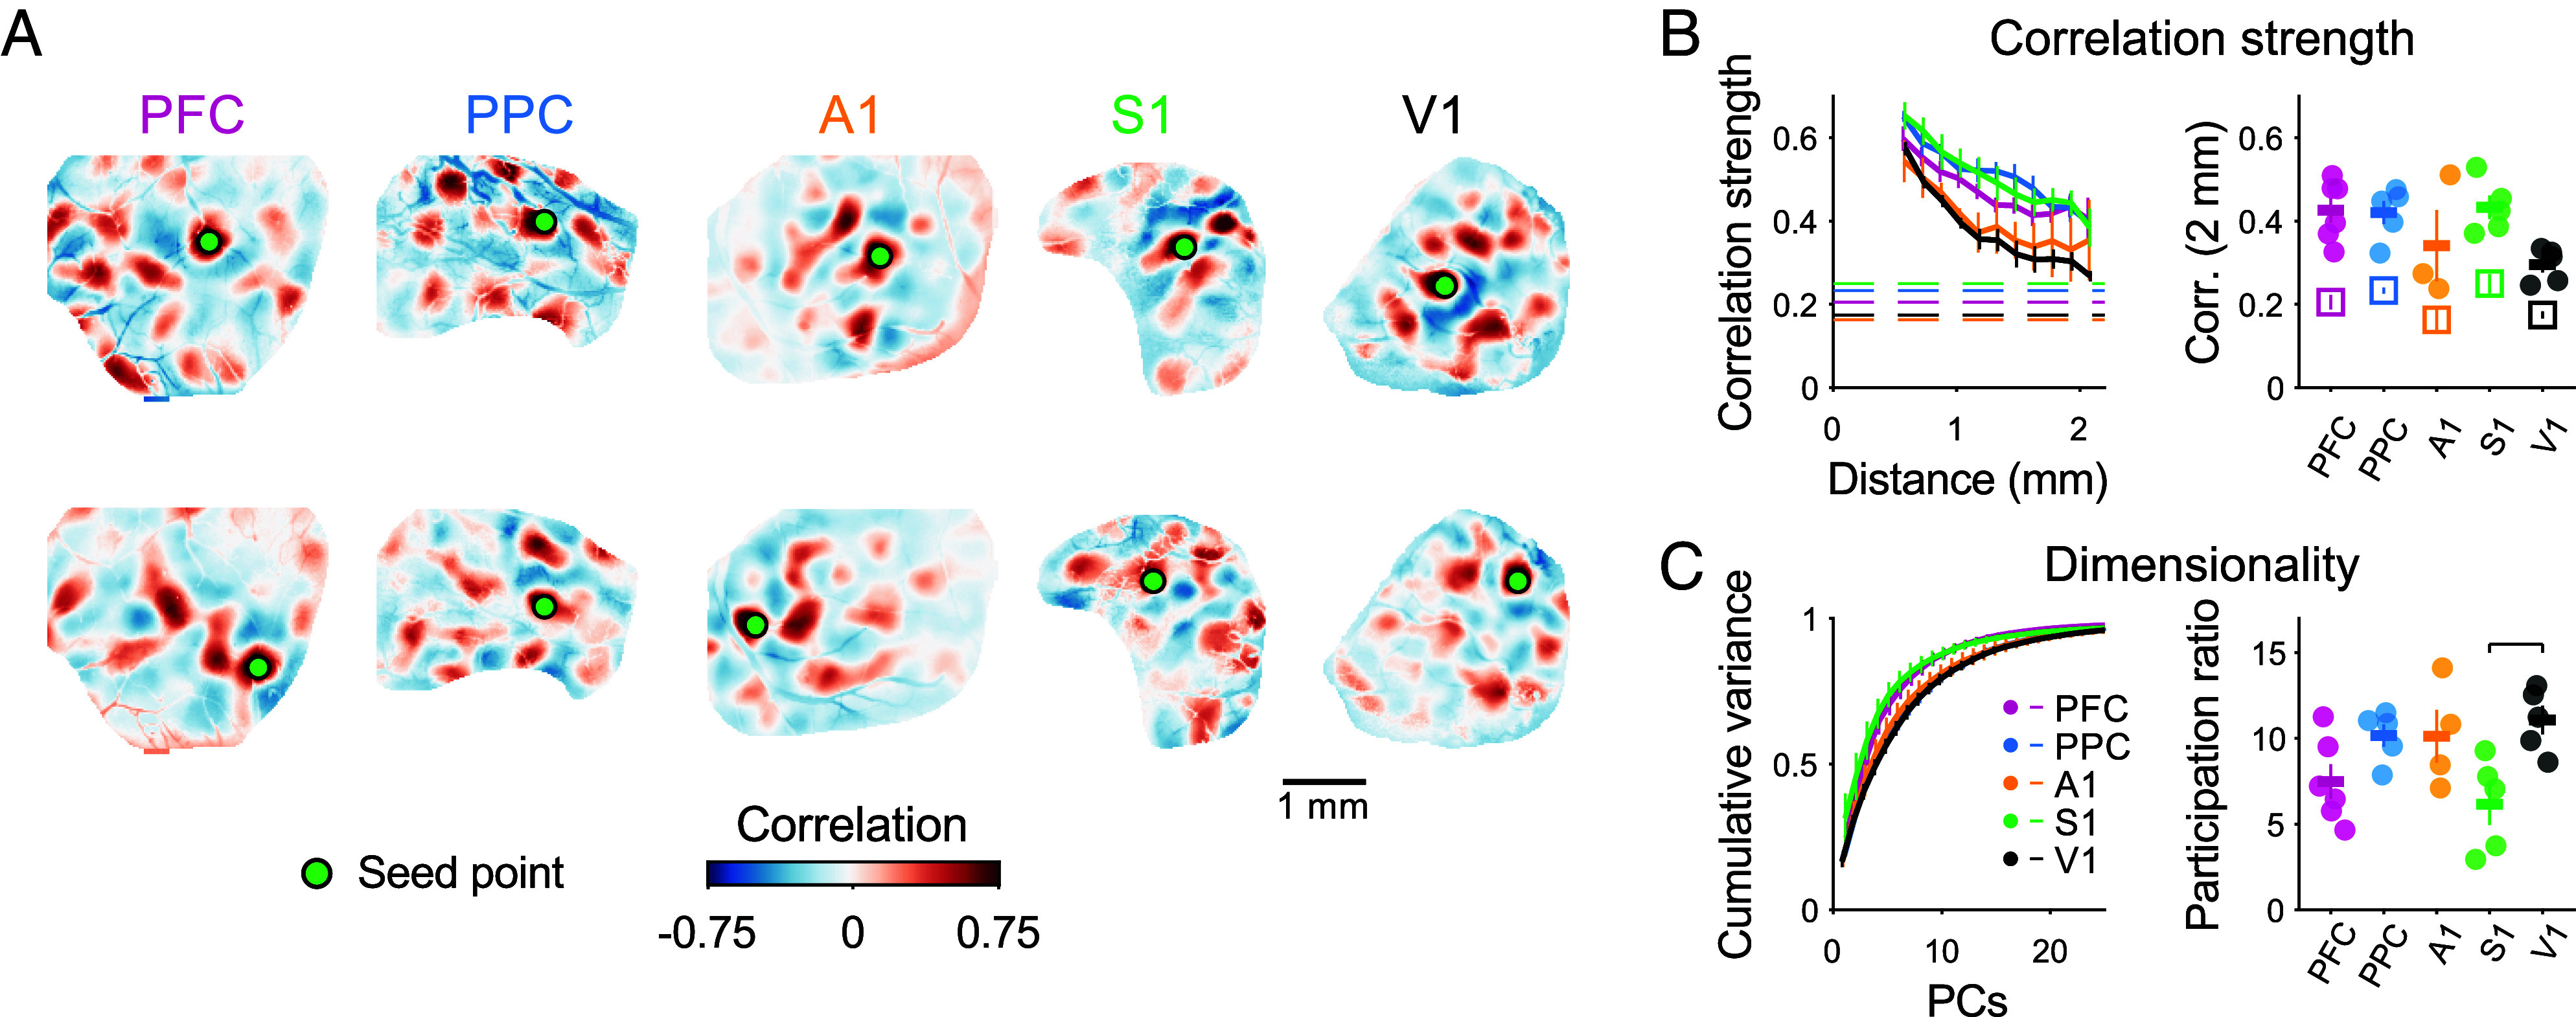
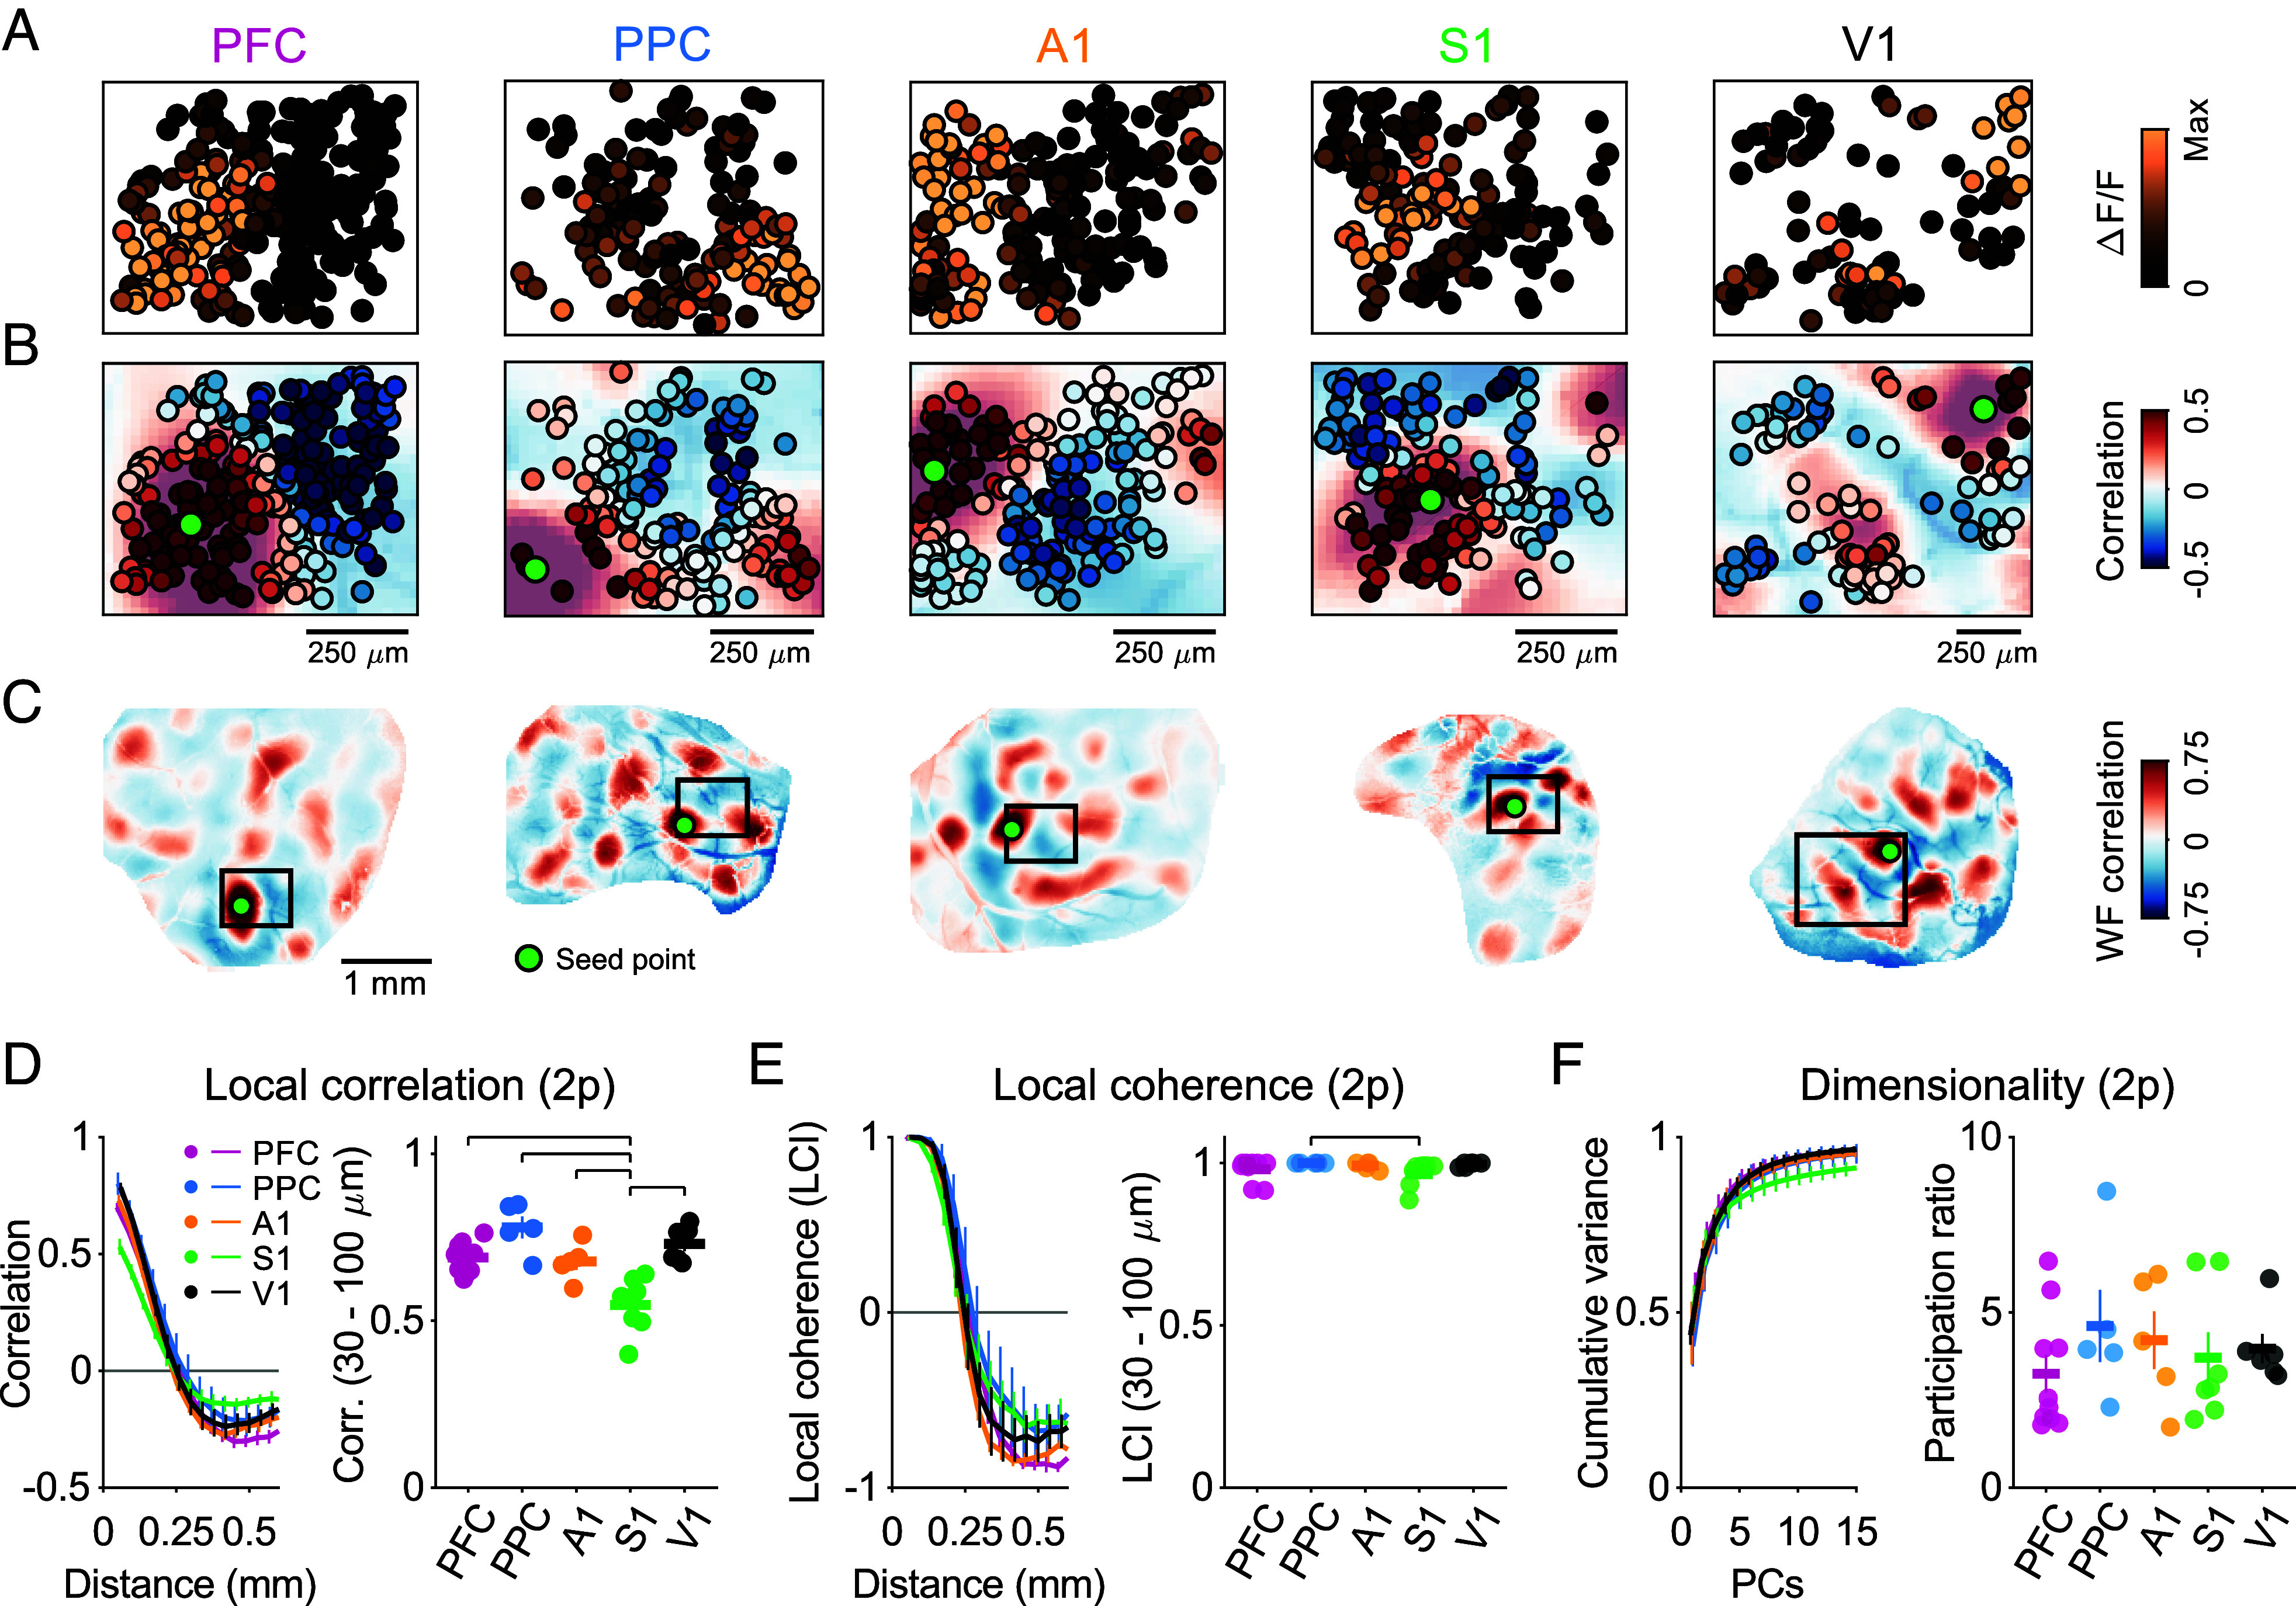
In order to deal with a complex environment, animals form a diverse range of neural representations that vary across cortical areas, ranging from largely unimodal sensory input to higher-order representations of goals, outcomes, and motivation. The developmental origin of this diversity is currently unclear, as representations could arise through processes that are already area-specific from the earliest developmental stages or alternatively, they could emerge from an initially common functional organization shared across areas. Here, we use spontaneous activity recorded with two-photon and widefield calcium imaging to reveal the functional organization across the early developing cortex in ferrets, a species with a well-characterized columnar organization and modular structure of spontaneous activity in the visual cortex. We find that in animals 7 to 14 d prior to eye-opening and ear canal opening, spontaneous activity in both sensory areas (auditory and somatosensory cortex, A1 and S1, respectively), and association areas (posterior parietal and prefrontal cortex, PPC and PFC, respectively) showed an organized and modular structure that is highly similar to the organization in V1. In all cortical areas, this modular activity was distributed across the cortical surface, forming functional networks that exhibit millimeter-scale correlations. Moreover, this modular structure was evident in highly coherent spontaneous activity at the cellular level, with strong correlations among local populations of neurons apparent in all cortical areas examined. Together, our results demonstrate a common distributed and modular organization across the cortex during early development, suggesting that diverse cortical representations develop initially according to similar design principles.
Keywords: cortex; development; network.
Conflict of interest statement
Competing interests statement:The authors declare no competing interest.
Figures
Similar articles
-
Developmental maturation of millimeter-scale functional networks across brain areas.Cereb Cortex. 2025 Feb 5;35(2):bhaf007. doi: 10.1093/cercor/bhaf007. Cereb Cortex. 2025. PMID: 39866127 Free PMC article.
-
Self-organization of modular activity in immature cortical networks.Nat Commun. 2024 May 21;15(1):4145. doi: 10.1038/s41467-024-48341-x. Nat Commun. 2024. PMID: 38773083 Free PMC article.
-
Developmental maturation of millimeter-scale functional networks across brain areas.bioRxiv [Preprint]. 2024 May 29:2024.05.28.595371. doi: 10.1101/2024.05.28.595371. bioRxiv. 2024. Update in: Cereb Cortex. 2025 Feb 05;35(2):bhaf007. doi: 10.1093/cercor/bhaf007. PMID: 38853883 Free PMC article. Updated. Preprint.
-
From sensation to cognition.Brain. 1998 Jun;121 ( Pt 6):1013-52. doi: 10.1093/brain/121.6.1013. Brain. 1998. PMID: 9648540 Review.
-
The Role of Inhibitory Interneurons in Circuit Assembly and Refinement Across Sensory Cortices.Front Neural Circuits. 2022 Apr 7;16:866999. doi: 10.3389/fncir.2022.866999. eCollection 2022. Front Neural Circuits. 2022. PMID: 35463203 Free PMC article. Review.
Cited by
-
Perceptual and semantic maps in individual humans share structural features that predict creative abilities.Commun Psychol. 2025 Feb 24;3(1):30. doi: 10.1038/s44271-025-00214-9. Commun Psychol. 2025. PMID: 39994417 Free PMC article.
-
The developmental emergence of reliable cortical representations.Nat Neurosci. 2025 Feb;28(2):394-405. doi: 10.1038/s41593-024-01857-3. Epub 2025 Feb 4. Nat Neurosci. 2025. PMID: 39905211
-
Stereotyped Spatiotemporal Dynamics of Spontaneous Activity in Visual Cortex Prior to Eye Opening.J Neurosci. 2025 Jun 11;45(24):e1420242025. doi: 10.1523/JNEUROSCI.1420-24.2025. J Neurosci. 2025. PMID: 40262899 Free PMC article.
-
Developmental maturation of millimeter-scale functional networks across brain areas.Cereb Cortex. 2025 Feb 5;35(2):bhaf007. doi: 10.1093/cercor/bhaf007. Cereb Cortex. 2025. PMID: 39866127 Free PMC article.
-
Self-organization of modular activity in immature cortical networks.Nat Commun. 2024 May 21;15(1):4145. doi: 10.1038/s41467-024-48341-x. Nat Commun. 2024. PMID: 38773083 Free PMC article.
References
-
- Merzenich M. M., Knight P. L., Roth G. L., Representation of cochlea within primary auditory cortex in the cat. J. Neurophysiol. 38, 231–249 (1975). - PubMed
-
- Boorman E. D., Witkowski P. P., Zhang Y., Park S. A., The orbital frontal cortex, task structure, and inference. Behav. Neurosci. 135, 291–300 (2021). - PubMed
-
- Sakagami M., Watanabe M., Integration of cognitive and motivational information in the primate lateral prefrontal cortex. Ann. N. Y. Acad. Sci. 1104, 89–107 (2007). - PubMed
MeSH terms
Substances
Grants and funding
LinkOut - more resources
Full Text Sources
Medical
Research Materials
Miscellaneous
