. 2024 Mar 12;121(11):e2318657121.
doi: 10.1073/pnas.2318657121. Epub 2024 Mar 6.

Central tolerance shapes the neutralizing B cell repertoire against a persisting virus in its natural host

Affiliations

Central tolerance shapes the neutralizing B cell repertoire against a persisting virus in its natural host

Marianna Florova et al. Proc Natl Acad Sci U S A. .

Abstract

Viral mimicry of host cell structures has been postulated to curtail the B cell receptor (BCR) repertoire against persisting viruses through tolerance mechanisms. This concept awaits, however, experimental testing in a setting of natural virus-host relationship. We engineered mouse models expressing a monoclonal BCR specific for the envelope glycoprotein of lymphocytic choriomeningitis virus (LCMV), a naturally persisting mouse pathogen. When the heavy chain of the LCMV-neutralizing antibody KL25 was paired with its unmutated ancestor light chain, most B cells underwent receptor editing, a behavior reminiscent of autoreactive clones. In contrast, monoclonal B cells expressing the same heavy chain in conjunction with the hypermutated KL25 light chain did not undergo receptor editing but exhibited low levels of surface IgM, suggesting that light chain hypermutation had lessened KL25 autoreactivity. Upon viral challenge, these IgMlow cells were not anergic but up-regulated IgM, participated in germinal center reactions, produced antiviral antibodies, and underwent immunoglobulin class switch as well as further affinity maturation. These studies on a persisting virus in its natural host species suggest that central tolerance mechanisms prune the protective antiviral B cell repertoire.

Keywords: B cell receptor editing; neutralizing antibodies; persistent viral infection; self-tolerance; viral immune evasion.


Conflict of interest statement

Competing interests statement:D.D.P. is a founder, consultant, and shareholder of Hookipa Pharma Inc. commercializing arenavirus-based vector technology, and he is listed as an inventor on corresponding patents.

Figures
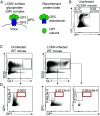
Fig. 1.
Fig. 1.
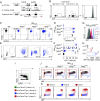
Very low frequencies of LCMV GP1-binding B cells in wild-type mice. (A) Schematic of the membrane-anchored LCMV surface GP complex. Heterotrimers consisting of the outer globular GP1 domain, noncovalently associated with the transmembrane GP2 stalk and the stable signal peptide (not displayed), form trimeric complexes on infectious virions. As derivatives thereof, a recombinantly expressed, noncleavable extracellular domain of the GPC ectodomain and a recombinantly expressed GP1 domain, each of them labeled with different fluorophores, were generated as baits for flow cytometry (FACS) use. (B) B220+ splenocytes of KL25H mice were analyzed for GPC and GP1 binding (see SI Appendix, Fig. S1A for gating). Numbers in the exemplary FACS plot indicate percentages of gated cells. Number of biological replicates per experimental group (n) = 6. Representative results from one out of two experiments. (C and D) WT mice were infected with rCl13/WE, uninfected mice served as negative controls. 28 d after infection the total splenic B220+ B cell population (see SI Appendix, Fig. S1B for gating) of infected mice and of uninfected controls (C) was analyzed by FACS for GPC and GP1 binding (D). A GL7+ GC B cell subset was detected in infected but not in uninfected mice. Numbers in exemplary FACS plots indicate the percentage of gated cells as mean ± SEM of 3 to 5 mice (n). One representative of two experiments (N) is shown.
Fig. 2.
Fig. 2.
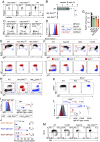
GP1-binding KL25H B cells protect against LCMV. (AC) Representative FACS plot of GPC and GP1 binding by KL25H cells (A) and schematic of the experimental design for (B and C); Recipients were infected with rCL13/WE. Three days later GPC+GP1+, GPC+GP1–, and GPC–GP1– B cells (populations defined as shown in A and in SI Appendix, Fig. S2A) were sorted from KL25H mice, and 10,000 of each type were adoptively transferred. Serum antibodies were measured on d10 (B) and viremia was determined at the indicated time points (C). Symbols in B represent individual mice; in C, the mean ± SEM of n = 4 to 5 mice is shown. N = 2. One-way ANOVA with Dunnett’s posttest for multiple comparisons in C. **P < 0.01. (D and E) GP1 binding (D) and rCl13/WE neutralization (E) by recombinantly expressed antibodies consisting of the KL25 heavy chain and the identified light chains. Symbols represent the mean of 2 technical replicates. N = 2. Two-way ANOVA with Dunnett’s posttest for multiple comparisons was performed in D, and antibodies exhibiting significantly higher binding than isotype control are indicated. **P < 0.01. (F) Schematic of the experimental design for G. WT mice were infected with rCl13/WE on day 0, followed by passive immunization with the indicated antibodies on day 3 as described previously (67). (G) Viremia was monitored. Symbols show means ± SEM of n = 4 to 5 mice per group. N = 2. Two-way ANOVA with Dunnett’s posttest for multiple comparisons was performed for d7 to d21 values. Treatment groups exhibiting significantly lower viral loads than isotype control-treated mice are indicated. **P < 0.01.
Fig. 3.
Fig. 3.
A substantial proportion of KL25UA-expressing B cells undergo receptor editing. (A) Targeting strategy for the insertion of the KL25UA and KL25 VκJκ exons, respectively, into the mouse immunoglobulin kappa locus. The vector comprises 5′ and 3′ homology arms (5′HA and 3′HA), a kappa light chain promoter (triangle) followed by the VκJκ exons and splice donor site of the KL25 antibody. The PCR genotyping strategy yielding 3 kb and 4.2 kb amplicons (SI Appendix, Fig. S3A) is depicted. (B) Representative FACS plots from blood of founder animals after intercrossing to a RAG2−/− background. Numbers in FACS plots indicate the percentage of gated cells. GP1-binding by B220+ B cells of the light chain k.i.-positive founder is shown in the histogram plot. (C and D) Representative FACS plots (C) of Ig kappa and lambda expression on mature splenic B cells (SI Appendix, Fig. S3B). Symbols in D report the percentage of lambda+ B cells in individual mice; bars show means ± SEM. (E and F) Representative FACS plots (E) and percentage of GPC+GP1+ splenic mature B cells (see SI Appendix, Fig. S3B for gating). Symbols in F represent individual mice; bars show means ± SEM. (G and H) GP1 binding by HkiLUA-RAG+/– B cells, either κ+λ, κ+λ+, or κλ+. GP1 nonbinding polyclonal B cells from WT mice (gray shaded) are shown as negative control. A FACS histogram from one representative mouse is shown in G; symbols in H represent individual mice with bars showing the mean + SEM. (I) The bone marrow was pre-gated as shown in SI Appendix, Fig. S3C, and CD43hiB220int cells (Hardy AC; green gate) were differentiated from the CD43loB220int/hi compartments (Hardy E and F) to be further analyzed in J and K). (J) B cell developmental stages Hardy DF were differentiated as indicated in I. Representative FACS plots are shown. See SI Appendix, Fig. S3C for gating. (K) Color-coded superposition of Hardy DF developmental stages as gated in I for determination of stage-dependent surface IgM and IgD expression. Symbols in D and F report individual mice analyzed in three independent experiments. One-way ANOVA with Dunnett’s posttest for multiple comparisons in F and H. **P < 0.01.
Fig. 4.
Fig. 4.
Insignificant receptor editing but low surface IgM on B cells expressing a hypermutated KL25 BCR. (A and B) Representative FACS plots (A) of Ig kappa and lambda expression on mature splenic B cells (see SI Appendix, Fig. S3B for gating). Symbols in B report the percentage of lambda+ B cells in individual mice; bars show means ± SD. (C) Representative FACS plots showing the percentage of GPC+GP1+ B cells (see SI Appendix, Fig. S3B for gating) in the spleen. (D) GP1 binding by peripheral blood B cells from the indicated types of mice under conditions of limiting GP1 staining concentrations. MFI is reported as mean ± coefficient of variation. Representative histogram plots are shown. Data from one representative out of three similar experiments are displayed. (E and F) The Upper row shows exemplary FACS plot pre-gated on B220+CD43lo bone marrow cells (compare Fig. 3I with pre-gating shown in SI Appendix, Fig. S3C) with gates for pre-B cells (orange), immature B cells (blue), and mature B cells (red). The Bottom row shows a color-coded superposition of pre-B, immature B, and mature B cells as gated in the respective panels above for determination of stage-dependent surface IgM and IgD expression. (E and F) correspond to separate experiments. n = 3 to 4, N = 2. See SI Appendix, Fig. S4 A and B for further information on BasL36 and VI10HL mice. Numbers indicate the percentage of gated cells. (G) Percentage of B cells among peripheral blood lymphocytes of KL25 BCR transgenic and/or knock-in mice and WT controls. Symbols represent combined data from individual mice collected in two separate experiments with mean ± SEM. (HJ) Concatenated FACS plots from the bone marrow of 3 to 5 mice in each group are shown in (H and I; see SI Appendix, Fig. S4E for gating). Symbols in I and J represent individual mice; bars show the mean ± SD. N = 2. (K and L) Representative FACS plots of surface IgM and IgD expression on B cells in peripheral blood (K, see SI Appendix, Fig. S3B for gating strategy) and of IgM expression and IgM MFI (L). Symbols in bar charts to L represent individual mice, showing combined data from three independent experiments. (M) Surface IgM and IgD expression of peripheral blood B cells (see SI Appendix, Fig. S4 C and I for gating and quantification) of the indicated KL25 BCR-expressing mouse models. One representative FACS plot from a total of 8 to 10 mice analyzed in three independent experiments is shown. See SI Appendix, Fig. S4D for an analogous analysis from the spleen. Numbers in the FACS plots to (A, C, E, F, H, and M) indicate the percentage of gated cells. One-way ANOVA with Dunnett’s posttest and Tukey’s post hoc analysis was used for multiple comparisons in I and L, respectively; two-way ANOVA with Tukey’s posttest in J. **P < 0.01.
Fig. 5.
Fig. 5.
HkiL B cells have a normal half-life and up-regulate surface IgM upon activation. (A) Schematic of the experiment in (BD). One-and-a-half million HkiL-RAG−/−, HkiLUA-RAG−/−, or WT (all CD45.1-congenic) B cells were transferred into naive WT recipients (CD45.2+) and were analyzed in spleen 2 and 7 d later. (BD): IgM / IgD coexpression (B), cell counts (C), and CD86/MHC class II coexpression by adoptively transferred HkiL-RAG−/− (red), HkiLUA-RAG−/− (blue), and WT (gray) B cells (B220+CD19+CD45.1+ lymphocytes) prior to transfer (D0) and on d2 (n = 3 to 4) and d7 (n = 5) after transfer. One representative of two similar experiments is shown. (E) Schematic of the experiment in (F and G). Two million purified HkiL-RAG−/− B cells were cultured for 3 d on 3T3 feeder cells expressing CD40L and BAFF [CD40LB (80)] in the presence of recombinant IL-4. (F and G) Representative FACS plot showing IgM and IgD (F) or CD86 and Fas (G) on HkiL-RAG−/− B cells directly ex vivo (red) and after 4 d of activation culture (blue). n = 6 in (F and G). (H) Schematic of the experiment in (I). One million HkiL-RAG−/− B cells were adoptively transferred into recipients infected with rCl13/WE-N119S 3 d earlier. Groups of animals were killed 1 and 7 d later. (I) IgM and IgD expression levels of HkiL-RAG−/− B cells (B220+CD45.1+CD45.2) prior to transfer (d0) as well as on d1 and d7. Representative FACS plots from one out of four mice in two independently conducted experiments.
Fig. 6.
Fig. 6.
HkiL B cells mount potent antibody responses, participate in GC reactions, adapt to a viral escape variant, and exhibit partial resistance to IFN-I-driven decimation. (A and B) Representative histogram (A) showing the GP1-binding of splenic B cells from the indicated KL25 BCR-expressing mice (see SI Appendix, Fig. S4C for gating). The percentage of cells gated in (A) is reported in B. FACS plots in A show one representative out of five mice of each genotype analyzed in three experiments total (WT, BasL36, and HkiL) alongside with two KL25HL control mice, which were found as previously published (79). Bars in B show means ± SD. (CG) The schematic in C describes the experimental design in DG. Recipients (CD45.2+) were infected with rCl13/WE and 6 d later received splenic B cells from HkiL-RAG−/−, BasL36, or KL25HL mice. Controls were left without cell transfer. GP1-binding serum antibody titers (D). On d13 and d54 groups of animals were killed to analyze transferred cells in the spleen (EG). Panels (E and F) show representative FACS plots from day 54. Panel (E) is gated on lymphocytes (SI Appendix, Fig. S6A); numbers in plots indicate the percentage of gated cells. Plots in F show transferred B cell progeny as gated in E in black, overlaid on polyclonal host-endogenous (CD45.2+) B cells in gray (see SI Appendix, Fig. S6A for gating), with numbers indicating the percentage of GL7+CD38 GC B cells among transferred (CD45.1+) B cell progeny. The abundance of transferred (CD45.1+) B cell progeny on d54 (G) is expressed as the percentage of lymphocytes in the spleen. Symbols and bars in D and G show the mean±SEM of 4 mice per group. One representative of two experiments is shown. See SI Appendix, Fig. S6 B and C for an analysis on d13. Two-way ANOVA with Dunnett’s posttest for multiple comparisons for d14-d54 values of panel (D) using the HkiL recipient group as reference. *P < 0.05; **P < 0.01. (H) Binding of KL25 antibody to titrated concentrations of plate-bound WE-GP and WE-GP-N119S. Symbols show the means of two technical replicates. (I) Representative histogram showing binding of the HkiL-RAG−/− B220+ splenocytes to WE-GP (black shaded) and WE-GP-N119S (red shaded). Splenocytes from WT mice served as technical control (transparent). (JM) A schematic of the experimental design to (L and M) is shown in J. Recipient mice (CD45.2+) were infected with rCl13/WE-N119S and 6 d later were given splenic HkiL-RAG−/−, BasL36 or KL25HL B cells (CD45.1+). Zygosity of knock-in Ig chains or transgenic (tg) light chain of each type of donor B cell (K). rCl13/WE-N119S-neutralizing (L) and GP-N119S-binding antibody titers (M) were monitored. (N and O) The schematic (N) describes the experimental design for panel (O). Recipients (CD45.2+) were given IFN-I receptor-blocking antibody or isotype control antibody on d-1, followed by rCl13/WE infection concomitantly with transfer of 105 either HkiL-RAG+/+ or BasL36 B cells on d0 and analysis of transferred B cell progeny in spleen 5 d later. In O, the expansion of adoptively transferred HkiL and BasL36 B cells was calculated (Left) assuming 5% splenic take (Materials and Methods). Total splenic counts of adoptively transferred (CD45.1+) ASCs and B cells (see SI Appendix, Fig. S6 D and E for gating) are shown (Center), and proportions of ASCs and B cells are displayed in a pie chart (Right). Symbols in L and M represent the mean ± SEM of 3 to 5 mice per group; symbols in O show individual mice. One-way ANOVA with Dunnett’s posttest in L. **P < 0.01. One representative experiment of two is shown.

References

    1. Cohen M. S., Shaw G. M., McMichael A. J., Haynes B. F., Acute HIV-1 infection. N. Engl. J. Med. 364, 1943–1954 (2011). - PMC - PubMed
    1. Cox A. L., et al. , Prospective evaluation of community-acquired acute-phase hepatitis C virus infection. Clin. Infect. Dis. 40, 951–958 (2005). - PubMed
    1. Chen M., et al. , Limited humoral immunity in hepatitis C virus infection. Gastroenterology 116, 135–143 (1999). - PubMed
    1. Pinschewer D. D., et al. , Kinetics of protective antibodies are determined by the viral surface antigen. J. Clin. Invest. 114, 988–993 (2004). - PMC - PubMed
    1. Law J. L., et al. , A hepatitis C virus (HCV) vaccine comprising envelope glycoproteins gpE1/gpE2 derived from a single isolate elicits broad cross-genotype neutralizing antibodies in humans. PLoS One 8, e59776 (2013). - PMC - PubMed

LinkOut - more resources