

Insights into hippocampal perfusion using high-resolution, multi-modal 7T MRI
- PMID: 38446857
- PMCID: PMC10945835
- DOI: 10.1073/pnas.2310044121
Insights into hippocampal perfusion using high-resolution, multi-modal 7T MRI
Abstract
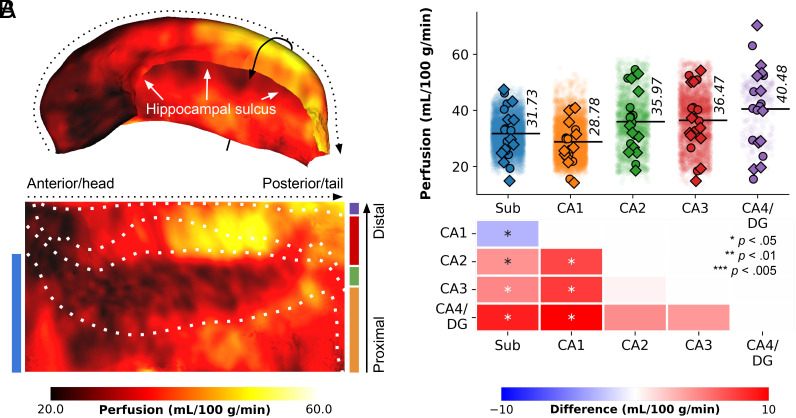
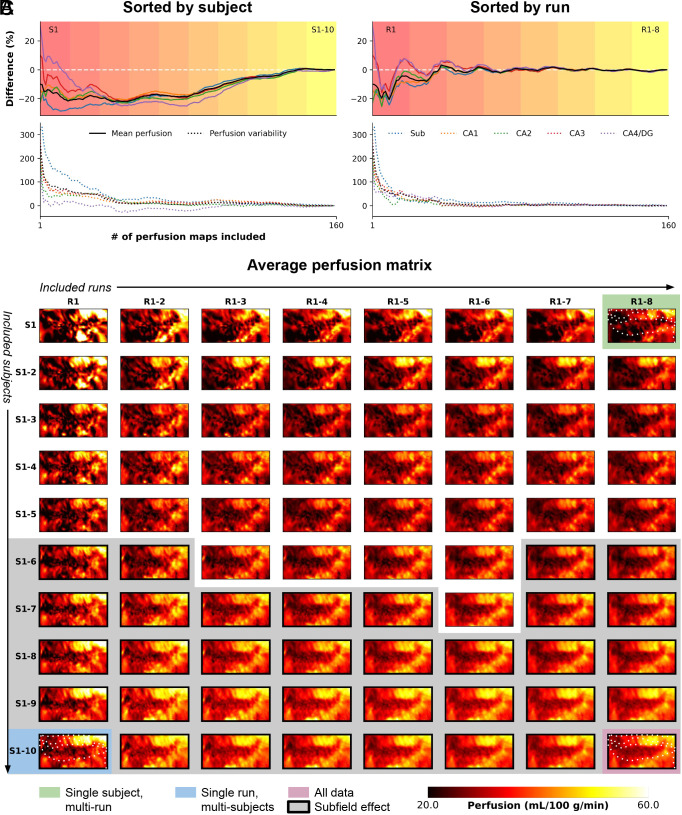
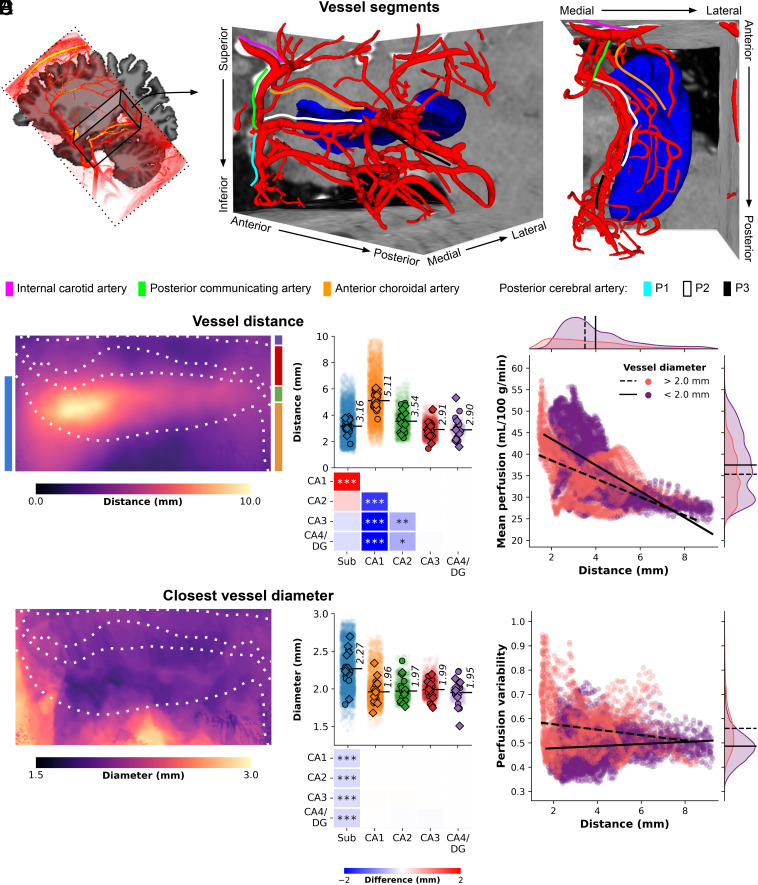
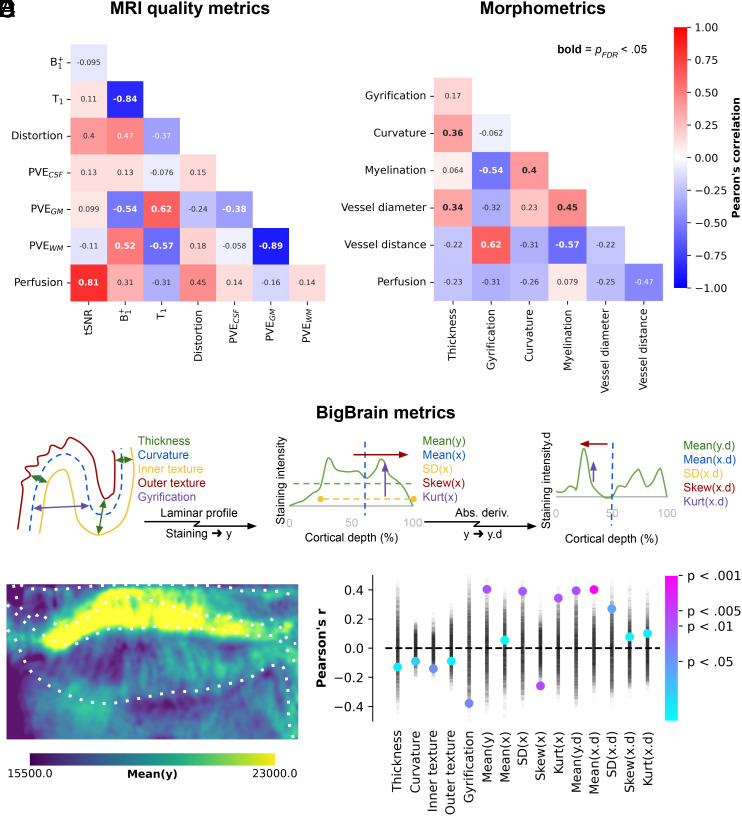
We present a comprehensive study on the non-invasive measurement of hippocampal perfusion. Using high-resolution 7 tesla arterial spin labeling (ASL) data, we generated robust perfusion maps and observed significant variations in perfusion among hippocampal subfields, with CA1 exhibiting the lowest perfusion levels. Notably, these perfusion differences were robust and already detectable with 50 perfusion-weighted images per subject, acquired in 5 min. To understand the underlying factors, we examined the influence of image quality metrics, various tissue microstructure and morphometric properties, macrovasculature, and cytoarchitecture. We observed higher perfusion in regions located closer to arteries, demonstrating the influence of vascular proximity on hippocampal perfusion. Moreover, ex vivo cytoarchitectonic features based on neuronal density differences appeared to correlate stronger with hippocampal perfusion than morphometric measures like gray matter thickness. These findings emphasize the interplay between microvasculature, macrovasculature, and metabolic demand in shaping hippocampal perfusion. Our study expands the current understanding of hippocampal physiology and its relevance to neurological disorders. By providing in vivo evidence of perfusion differences between hippocampal subfields, our findings have implications for diagnosis and potential therapeutic interventions. In conclusion, our study provides a valuable resource for extensively characterizing hippocampal perfusion.
Keywords: 7 tesla MRI; hippocampus; perfusion; subfields; vasculature.
Conflict of interest statement
Competing interests statement:The authors declare no competing interest.
Figures
Update of
-
Novel insights into hippocampal perfusion using high-resolution, multi-modal 7T MRI.bioRxiv [Preprint]. 2023 Jul 21:2023.07.19.549533. doi: 10.1101/2023.07.19.549533. bioRxiv. 2023. Update in: Proc Natl Acad Sci U S A. 2024 Mar 12;121(11):e2310044121. doi: 10.1073/pnas.2310044121. PMID: 37503042 Free PMC article. Updated. Preprint.
Similar articles
-
Novel insights into hippocampal perfusion using high-resolution, multi-modal 7T MRI.bioRxiv [Preprint]. 2023 Jul 21:2023.07.19.549533. doi: 10.1101/2023.07.19.549533. bioRxiv. 2023. Update in: Proc Natl Acad Sci U S A. 2024 Mar 12;121(11):e2310044121. doi: 10.1073/pnas.2310044121. PMID: 37503042 Free PMC article. Updated. Preprint.
-
In vivo normative atlas of the hippocampal subfields using multi-echo susceptibility imaging at 7 Tesla.Hum Brain Mapp. 2014 Aug;35(8):3588-601. doi: 10.1002/hbm.22423. Epub 2013 Dec 13. Hum Brain Mapp. 2014. PMID: 24339427 Free PMC article.
-
Resting-state neural activity and cerebral blood flow alterations in type 2 diabetes mellitus: Insights from hippocampal subfields.Brain Behav. 2024 Jul;14(7):e3600. doi: 10.1002/brb3.3600. Brain Behav. 2024. PMID: 38988142 Free PMC article.
-
Partial volume correction in arterial spin labeling perfusion MRI: A method to disentangle anatomy from physiology or an analysis step too far?Neuroimage. 2021 Sep;238:118236. doi: 10.1016/j.neuroimage.2021.118236. Epub 2021 Jun 4. Neuroimage. 2021. PMID: 34091034 Review.
-
Psychosocial factors and hippocampal subfields: The Medea-7T study.Hum Brain Mapp. 2023 Apr 1;44(5):1964-1984. doi: 10.1002/hbm.26185. Epub 2022 Dec 30. Hum Brain Mapp. 2023. PMID: 36583397 Free PMC article.
Cited by
-
Perfusion-mechanics coupling of the hippocampus.Interface Focus. 2025 Apr 4;15(1):20240051. doi: 10.1098/rsfs.2024.0051. eCollection 2025 Apr 4. Interface Focus. 2025. PMID: 40191030
-
Characterizing BOLD activation patterns in the human hippocampus with laminar fMRI.Imaging Neurosci (Camb). 2025 Apr 8;3:imag_a_00532. doi: 10.1162/imag_a_00532. eCollection 2025. Imaging Neurosci (Camb). 2025. PMID: 40800946 Free PMC article.
-
Assessing Arterial Patterns in the Motor Cortex With 7 Tesla Magnetic Resonance Imaging and Vessel Distance Mapping.Hum Brain Mapp. 2025 Aug 1;46(11):e70311. doi: 10.1002/hbm.70311. Hum Brain Mapp. 2025. PMID: 40762423 Free PMC article.
-
Early life stress impairs hippocampal subfield myelination.Commun Biol. 2025 May 22;8(1):785. doi: 10.1038/s42003-025-08165-x. Commun Biol. 2025. PMID: 40404790 Free PMC article.
References
-
- Eichenbaum H., Hippocampus: Cognitive processes and neural representations that underlie declarative memory. Neuron 44, 109–120 (2004). - PubMed
-
- Squire L. R., Stark C. E. L., Clark R. E., The medial temporal lobe. Annu. Rev. Neurosci. 27, 279–306 (2004). - PubMed
-
- Ding S.-L., Van Hoesen G. W., Organization and detailed parcellation of human hippocampal head and body regions based on a combined analysis of cyto- and chemoarchitecture. J. Comp. Neurol. 523, 2233–2253 (2015). - PubMed
-
- DeKraker J., Köhler S., Khan A. R., Surface-based hippocampal subfield segmentation. Trends Neurosci. 44, 856–863 (2021). - PubMed
MeSH terms
Grants and funding
LinkOut - more resources
Full Text Sources
Miscellaneous
