. 2024 Mar 8;10(10):eadl1122.
doi: 10.1126/sciadv.adl1122. Epub 2024 Mar 6.

Coxsackievirus infection induces direct pancreatic β cell killing but poor antiviral CD8+ T cell responses

Affiliations

Coxsackievirus infection induces direct pancreatic β cell killing but poor antiviral CD8+ T cell responses

Federica Vecchio et al. Sci Adv. .

Abstract

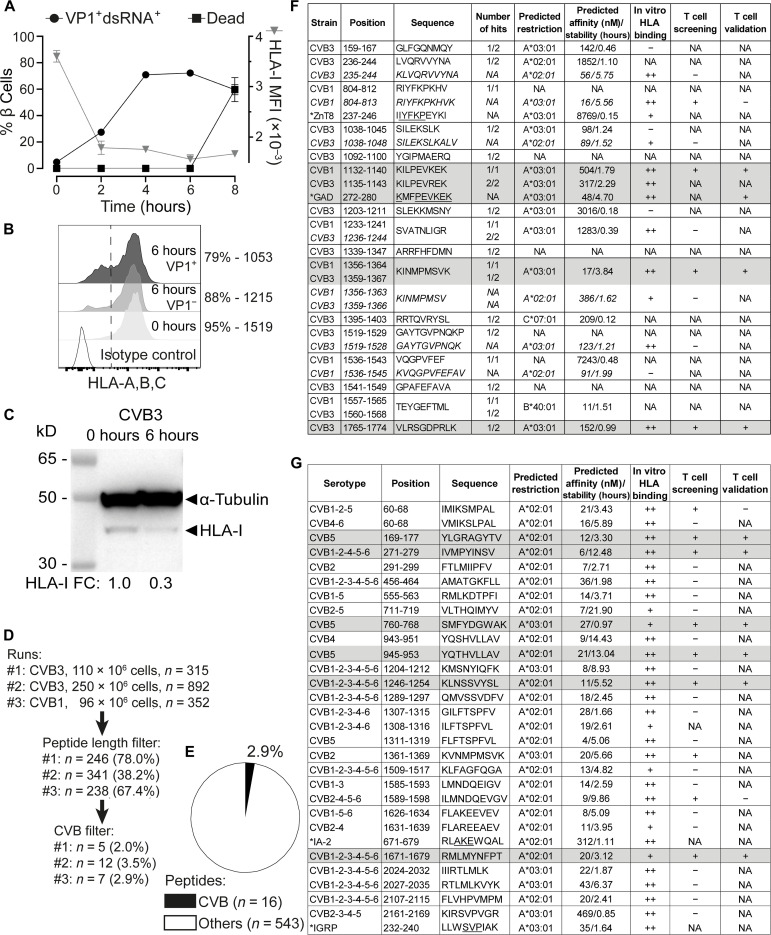
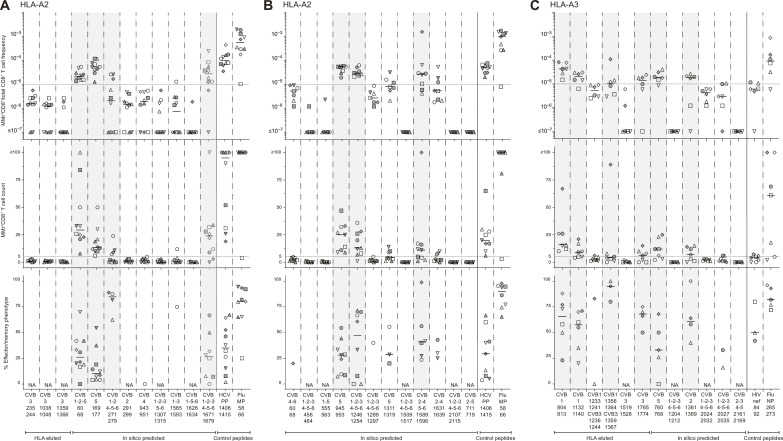
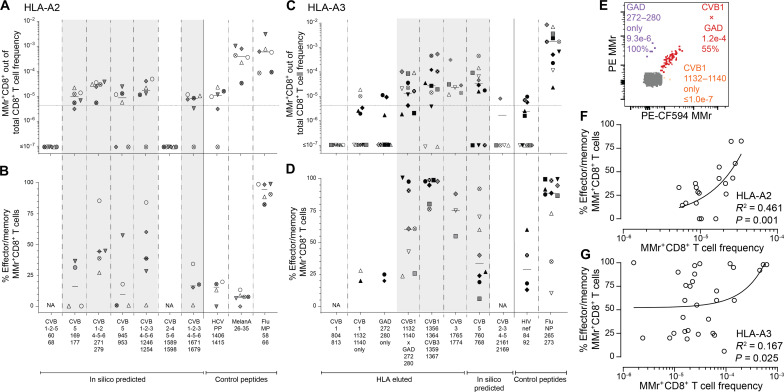
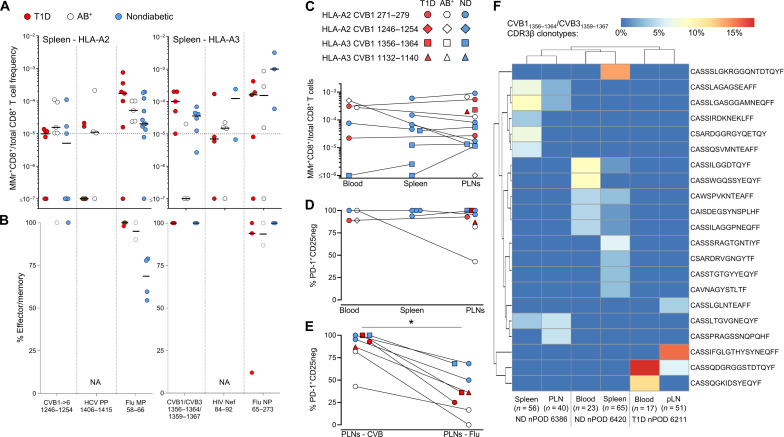
Coxsackievirus B (CVB) infection of pancreatic β cells is associated with β cell autoimmunity and type 1 diabetes. We investigated how CVB affects human β cells and anti-CVB T cell responses. β cells were efficiently infected by CVB in vitro, down-regulated human leukocyte antigen (HLA) class I, and presented few, selected HLA-bound viral peptides. Circulating CD8+ T cells from CVB-seropositive individuals recognized a fraction of these peptides; only another subfraction was targeted by effector/memory T cells that expressed exhaustion marker PD-1. T cells recognizing a CVB epitope cross-reacted with β cell antigen GAD. Infected β cells, which formed filopodia to propagate infection, were more efficiently killed by CVB than by CVB-reactive T cells. Our in vitro and ex vivo data highlight limited CD8+ T cell responses to CVB, supporting the rationale for CVB vaccination trials for type 1 diabetes prevention. CD8+ T cells recognizing structural and nonstructural CVB epitopes provide biomarkers to differentially follow response to infection and vaccination.


Figures

Fig. 1.
Fig. 1.. CVB-infected β cells down-regulate surface HLA-I and present few viral peptides.
(A) Flow cytometry kinetics of viral VP1/dsRNA, cell death (left y axis), and HLA-I median fluorescence intensity (MFI; right y axis) in CVB3-infected ECN90 β cells (300 MOI). (B and C) Flow cytometry HLA-I expression on ECN90 β cells 6 hours postinfection (B; percent HLA-I+ cells and MFI indicated) and Western blot [C; HLA-I fold change (FC) normalized to loading control indicated]. (D) Three immunopeptidomics runs were performed at the 6-hour time point. Sequences were filtered for 8– to 12–amino acid length and for matches with the translated RNA of the CVB strains used; number and percent of peptides retained at each step are shown. (E) Percent CVB peptides out of total 8- to 12-amino acid peptides eluted. (F) CVB peptides retrieved from immunopeptidomics experiments (length variants of identified sequences in italics). The number of hits out of three peptidomics runs are listed for each peptide; see fig. S1 for mapping in the CVB polyprotein. Asterisks indicate CVB1804–812-homologous ZnT8237–246 and CVB11132–1140/CVB31135–1143-homologous GAD272–280 peptides (conserved amino acids underlined). NetMHCStabpan predicted affinity and stability values for the assigned HLA-I restrictions are listed. Subsequent columns list in vitro HLA binding results (see fig. S2) and peptides recognized by CD8+ T cells in the screening and validation runs (Fig. 2 and 3). T cell epitopes eventually validated are shaded in gray. CVB11132–1140 and CVB31135–1143 differ only by 1 amino acid and were counted as one peptide (total n = 16). NA, not applicable (or not assigned for predicted restrictions); +/++, positive; −, negative. (G) CVB nonamer peptides identified in a parallel in silico search for all six CVB strains. Asterisks indicate homologous β cell peptides retrieved by Blast. Three peptides not confirmed as binders in vitro were excluded (see fig. S2). For HLA-eluted peptides, sequence annotations refer to the CVB1/CVB3 strains used. For in silico predicted peptides, annotations indicate sequence identities across serotypes.
Fig. 2.
Fig. 2.. Screening of CVB peptides for recognition by blood CD8+ T cells in CVB-seropositive healthy adults.
(A to C) HLA-A2–restricted (A and B) and HLA-A3–restricted candidates (C) were tested with combinatorial MMr assays [see reproducibility in fig. S2 (F and G)]. Each symbol represents a donor (legends in table S1), and the bars display median values. For each panel, the top graph depicts the frequency of MMr+CD8+ T cells out of total CD8+ T cells, with the horizontal line indicating the 10−5 frequency cutoff used as a first validation criterion; the middle graph displays the number of MMr+CD8+ T cells counted, with the horizontal line indicating the cutoff of five cells used to assign an effector/memory phenotype; the bottom graph shows the percent fraction of effector/memory cells (i.e., excluding naïve CD45RA+CCR7+ cells) among MMr+CD8+ T cells (for those donors with ≥5 cells counted; NA when not assigned). Peptides validated in this screening phase are highlighted in gray. In each panel, control peptides are derived from viruses eliciting predominantly naïve responses in these unexposed individuals (HLA-A2–restricted HCV PP1406–1415 and HLA-A3–restricted HIV nef84–92) and from influenza virus (Flu MP58–66 and NP265–273 peptides) eliciting predominantly effector/memory responses.
Fig. 3.
Fig. 3.. Validation of CVB epitopes as targets of blood CD8+ T cells in CVB-seropositive healthy adults.
(A to D) The HLA-A2–rectricted and HLA-A3–restricted peptides selected for validation from the screening round (Fig. 2) are shown in (A) and (B) and (C) and (D), respectively (see fig. S3 for representative dot plots and table S2 for detailed results). In the HLA-A3 panel, the CVB2-3-4-52161–2169 peptide not retained after screening was here included as negative control. Each symbol represents a donor (legends in table S1), with donors recruited in Paris and Miami depicted in (C) and (D) as white/gray and black symbols, respectively. Bars indicate median values. (A) and (C) depict the frequency of MMr+CD8+ T cells out of total CD8+ T cells, with the horizontal line indicating the 5 × 10⁻⁶ frequency cutoff used for validation, with only peptides scoring ≥3 MMr+ cells retained for this more stringent analysis. (B) and (D) show the percent fraction of effector/memory cells among MMr+CD8+ T cells. Validated peptides are highlighted in gray. In each panel, control peptides are derived from viruses or self-antigens eliciting predominantly naïve responses (HLA-A2–restricted HCV PP1406–1415/MelanA26–35 and HLA-A3–restricted HIV nef84–92) and from influenza virus, eliciting predominantly effector/memory responses. For the CVB11132–1140 peptide homologous to GAD272–280, frequencies and effector/memory fractions are shown for T cells recognizing either peptide or both. (E) CD8+ T cells cross-reactive to CVB11132–1140 (loaded on PE-CF594/BV711 MMrs) and GAD272–280 (loaded on PE/BV711 MMrs) appearing as a triple-stained population labeled by the four MMrs [see fig. S3 (C and D) for gating details]. (F and G) Correlation between the frequency of CVB epitope-reactive MMr+CD8+ T cells and their percent effector/memory fraction for HLA-A2– (F) and HLA-A3–restricted peptides (G). Each symbol represents an individual epitope specificity in an individual donor.
Fig. 4.
Fig. 4.. CVB-reactive CD8+ T cells are also found in spleen and PLNs and display a PD-1+ phenotype.
(A and B) Detection of CVB epitope–reactive CD8+ T cells in splenocytes from nPOD organ donors (HLA-A2+, left; and HLA-A3+, right; see details in table S3). Each symbol represents a donor, and bars indicate median values. (A) depicts the frequency of MMr+CD8+ T cells out of total CD8+ T cells, with the horizontal line indicating the 10−5 frequency cutoff. A median of 73,320 CD8+ T cells were counted (range 9,611 to 307,697). Only epitopes testing positive are depicted (complete peptide panels listed in fig. S5A). (B) displays the percent effector/memory fraction within each MMr+CD8+ population for those donors/epitopes with ≥5 MMr+ cells counted. (C and D) CVB epitope–reactive CD8+ T cells in lymphoid tissues from nPOD cases. CVB MMr+CD8+ T cell frequencies (C) and percent PD-1+CD25 MMr+ cells (D; for donors/epitopes with cell counts of ≥5) across available tissues are depicted. (E) Comparison of PD-1+CD25 fractions between CVB and influenza virus MMr+CD8+ T cells detected in the same PLN; *P = 0.014 by Wilcoxon signed rank test. (F) Expanded TCR CDR3β clonotypes in individual CVB1/CVB31356–1364/1359–1367-reactive CD8+ T cells from the same nPOD cases/tissues. Expanded clonotypes were defined as those found in ≥3 MMr+ cells in the same tissue from the same donor and are clustered according to frequency (one columns per tissue/case) and sequence similarity (one row per CDR3β clonotype). Further details are provided in figs. S5 and S6. ND, nondiabetic.
Fig. 5.
Fig. 5.. CVB-reactive CD8+ T cells stained on spleen and PLN tissue sections are more abundant than other viral antigen reactivities in T1D donors.
(A to I) Representative immunofluorescence images of the spleen (A to C), PLN (D to F), and pancreas (G to I) tissue sections (detailed in table S4) stained with pooled CMV/Flu, pooled CVB or single WNV MMrs (red; see fig. S7), and CD8 (green). Cell nuclei are stained in blue. Scale bars: 20 μm for spleen, 50 μm for CVB PLN, 20 μm for CMV/Flu PLN, 10 μm for WNV PLN, and 50 μm for pancreas. White arrows indicate MMr+CD8+ T cells. (J to K) Bar graphs showing the mean + SD of MMr+ cell densities (number of MMr+ cells/mm2 area) in the spleen (J) and PLNs (K) for CVB, CMV/Flu and WNV specificities in T1D, double-aAb+ (2AB+), and nondiabetic HLA-A2+ (triangles) and HLA-A3+ (circles) donors. **P = 0.008 and *P = 0.05 by Wilcoxon signed rank test.
Fig. 6.
Fig. 6.. Kinetics of CVB infection and β cell death and presentation of CVB peptides.
(A) Real-time imaging of infection and death (Cytotox Red) in CVB3-eGFP-infected ECN90 β cells. Infection and death curves are plotted as total area in green and red on the left and right y axes, respectively. Each data point represents mean ± SD of at least duplicate measurements (representative experiment performed in duplicate). (B) Representative images from movie S1 showing an intact β cell (5 hours, white arrow) touching the filopodia of an infected eGFP+ cell (red arrow), turning eGFP+ (8 hours) and subsequently emanating filopodia (11 hours) before dying (Cytotox Red+; 16 hours). Scale bars, 30 μm. (C) Eccentricity of infected versus noninfected ECN90 β cells (300 MOI). Each point represents mean ± SD of 8 images, P < 0.01 at all time points (barring 2 hours) by unpaired Student’s t test. (D) Representative pancreas sections from T1D donor 6243 stained for VP1 (green) and 4′,6-diamidino-2-phenylindole (DAPI; blue), alone (top) or with insulin (red, bottom). Scale bar, 50 μm. (E to G) Comparison of VP1 versus VP1+ β cell area (E), perimeter (F), and diameter (G) in pancreas sections stained as above. Each point represents a β cell from sections of three T1D donors; bars represent mean + SEM. ***P ≤ 0.0004 by unpaired Student’s t test. (H) CVB-reactive TCRs reexpressed in carrier cells. (I) CVB11356–1364-reactive TCR activation in NFAT-driven ZsGreen reporter, TCR-transduced 5KC cells upon an 18-hour coculture with CVB3-infected (dark green; 300 MOI) versus mock-infected ECN90 β cells (dark blue), plotted as mean ± 95% confidence interval of triplicate wells (representative experiment performed in duplicate). A parallel dose-response curve with increasing peptide concentrations pulsed on noninfected β cells (black) estimated the concentration of peptide recognized on CVB-infected β cells to 2.7 nM. A TCR recognizing the CVB11246–1254 peptide (not eluted from β cells) is shown as negative control.
Fig. 7.
Fig. 7.. Infected β cells are more efficiently killed by CVB than by CVB-reactive T cells.
(A and B) Representative real-time images from movies S4 and S5 (300 MOI, 1:1 T:β cell ratio) showing dead (Cytotox Green+) β cells (CellTracker Red+; dead β cells in yellow) killed by CVB (A) and CVB TCR-transduced CD8+ T cells (B), detected by single-cell and cluster analysis masks, respectively (details in movies S2 and S3). Scale bars, 30 μm. (C) Percent CVB-killed single β cell area (top) and T cell–killed cluster β cell area (bottom) at different MOIs and T:β cell ratios (ECN90 β cells stained as above), expressed as median percent total area from at least duplicate wells, normalized to the 8-hour time point (representative experiment performed in duplicate). (D) Correlation between percent CVB-killed and T cell–killed β cell area from (C) during the last 24 hours (details in fig. S8). (E) Low-grade infection protocol. ECN90 β cells were incubated with CVB3-eGFP for 1 hour, washed, and cultured for 72 hours, with washes to remove free virions, cell sampling for flow cytometry, and medium replenishment every 24 hours. (F to H) Percent CVB3-eGFP+ adherent ECN90 β cells (F), percent viable adherent cells (G), and HLA-I MFI (H). Each point represents the mean of duplicate measurements. For (F) and (H), some time points are not depicted due to the low number of remaining viable cells. (I and J) Percent T cell–killed cluster β cell area following 1-hour infection, washing, 24-hour culture, and real-time imaging after addition of CVB11356–1364 (I) or PPI15–24 (J) TCR-transduced CD8+ T cells (1:1 T:β ratio). β cell areas are expressed as median percent of total β cell area from at least duplicate wells, normalized at the 24-hour time point [symbol legends as in (E), depicted in different colors for (J)]. (K) Mean IFN-γ secretion from the same duplicate wells.

Update of

References

    1. Carré A., Vecchio F., Flodstrom-Tullberg M., You S., Mallone R., Coxsackievirus and type 1 diabetes: Diabetogenic mechanisms and implications for prevention. Endocr. Rev. 44, 737–751 (2023). - PubMed
    1. Gillespie K. M., Bain S. C., Barnett A. H., Bingley P. J., Christie M. R., Gill G. V., Gale E. A., The rising incidence of childhood type 1 diabetes and reduced contribution of high-risk HLA haplotypes. Lancet 364, 1699–1700 (2004). - PubMed
    1. Patterson C. C., Harjutsalo V., Rosenbauer J., Neu A., Cinek O., Skrivarhaug T., Rami-Merhar B., Soltesz G., Svensson J., Parslow R. C., Castell C., Schoenle E. J., Bingley P. J., Dahlquist G., Jarosz-Chobot P. K., Marciulionyte D., Roche E. F., Rothe U., Bratina N., Ionescu-Tirgoviste C., Weets I., Kocova M., Cherubini V., Rojnic Putarek N., deBeaufort C. E., Samardzic M., Green A., Trends and cyclical variation in the incidence of childhood type 1 diabetes in 26 European centres in the 25 year period 1989-2013: A multicentre prospective registration study. Diabetologia 62, 408–417 (2019). - PubMed
    1. Ziegler A.-G., Bonifacio E., BABYDIAB-BABYDIET Study Group , Age-related islet autoantibody incidence in offspring of patients with type 1 diabetes. Diabetologia 55, 1937–1943 (2012). - PubMed
    1. Parikka V., Nanto-Salonen K., Saarinen M., Simell T., Ilonen J., Hyoty H., Veijola R., Knip M., Simell O., Early seroconversion and rapidly increasing autoantibody concentrations predict prepubertal manifestation of type 1 diabetes in children at genetic risk. Diabetologia 55, 1926–1936 (2012). - PubMed