. 2024 Jan 8;18(1):wrae027.
doi: 10.1093/ismejo/wrae027.

Nitrous oxide inhibition of methanogenesis represents an underappreciated greenhouse gas emission feedback

Affiliations

Nitrous oxide inhibition of methanogenesis represents an underappreciated greenhouse gas emission feedback

Yongchao Yin et al. ISME J. .

Erratum in

Abstract

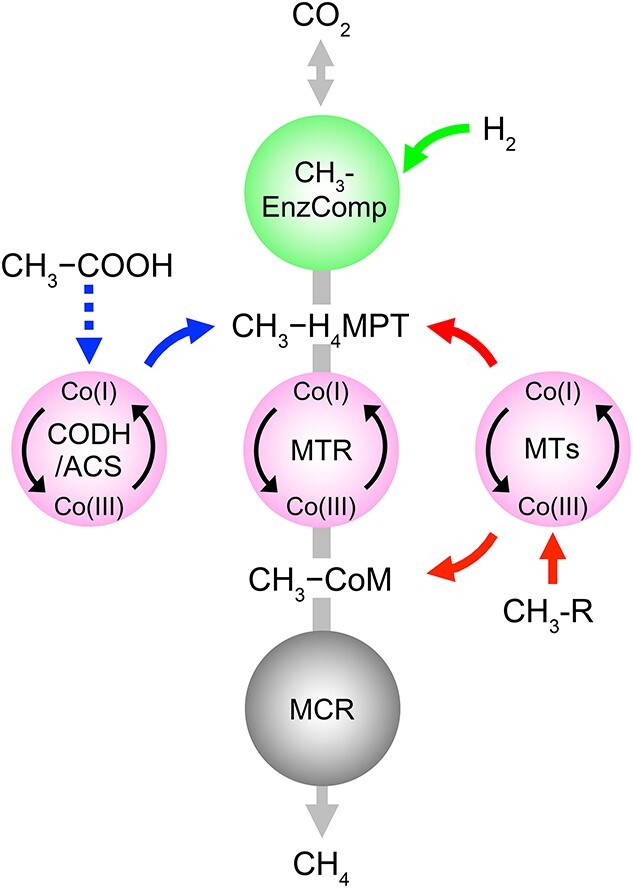
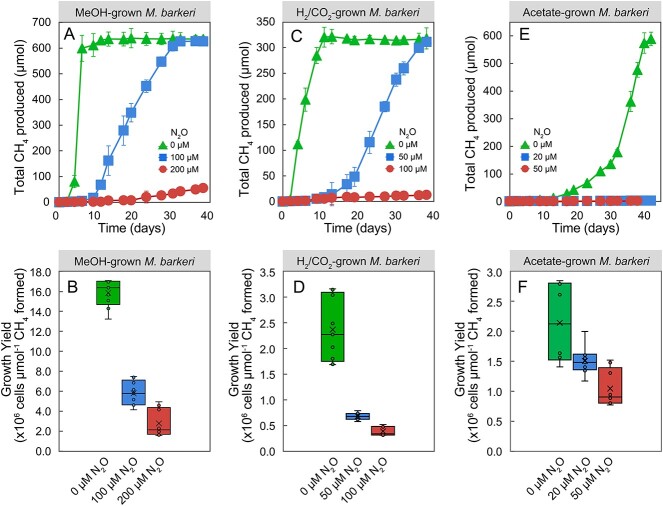
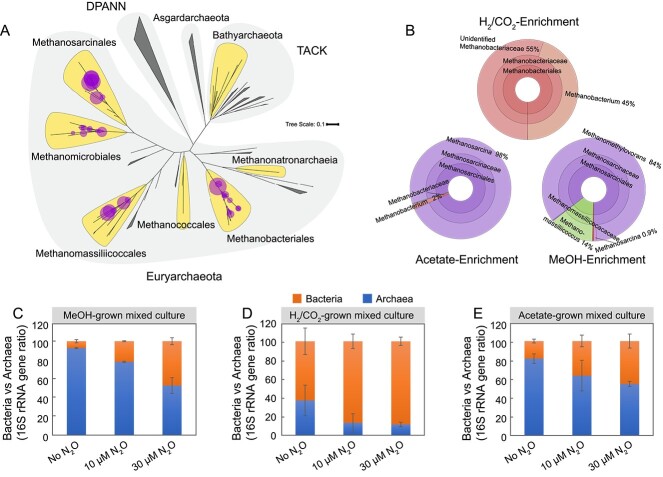
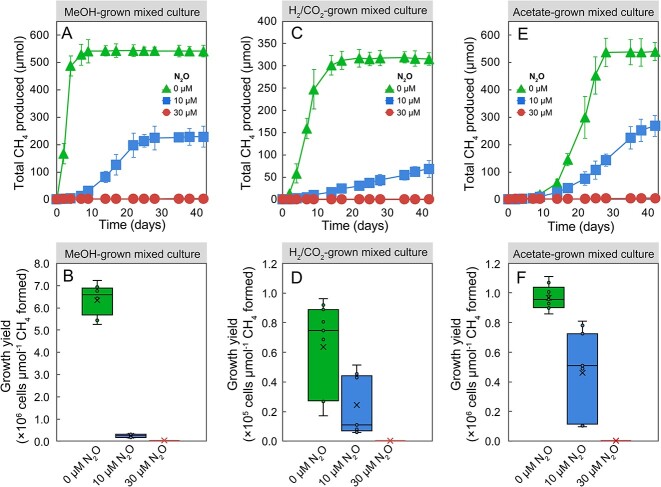
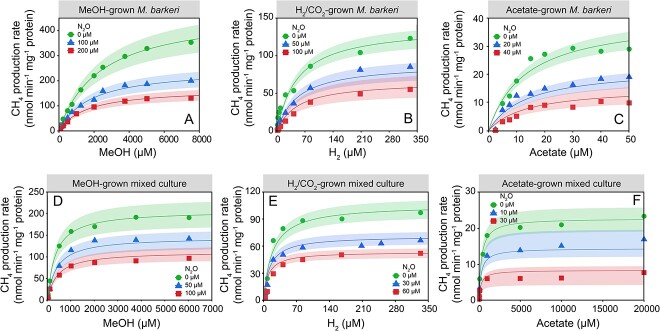
Methane (CH4) and nitrous oxide (N2O) are major greenhouse gases that are predominantly generated by microbial activities in anoxic environments. N2O inhibition of methanogenesis has been reported, but comprehensive efforts to obtain kinetic information are lacking. Using the model methanogen Methanosarcina barkeri strain Fusaro and digester sludge-derived methanogenic enrichment cultures, we conducted growth yield and kinetic measurements and showed that micromolar concentrations of N2O suppress the growth of methanogens and CH4 production from major methanogenic substrate classes. Acetoclastic methanogenesis, estimated to account for two-thirds of the annual 1 billion metric tons of biogenic CH4, was most sensitive to N2O, with inhibitory constants (KI) in the range of 18-25 μM, followed by hydrogenotrophic (KI, 60-90 μM) and methylotrophic (KI, 110-130 μM) methanogenesis. Dissolved N2O concentrations exceeding these KI values are not uncommon in managed (i.e. fertilized soils and wastewater treatment plants) and unmanaged ecosystems. Future greenhouse gas emissions remain uncertain, particularly from critical zone environments (e.g. thawing permafrost) with large amounts of stored nitrogenous and carbonaceous materials that are experiencing unprecedented warming. Incorporating relevant feedback effects, such as the significant N2O inhibition on methanogenesis, can refine climate models and improve predictive capabilities.

Keywords: climate change; feedback loop; greenhouse gas emissions; inhibition; methane; nitrous oxide.


Conflict of interest statement

The authors declare no competing interests.

Figures

Figure 1
Figure 1
Illustration of the major methanogenic pathways that together account for most of the biogenically produced CH4 in nature; acetoclastic (left), hydrogenotrophic (top), and methylotrophic (right) conversions channel into the methanogenic pathway; the central circles indicate steps catalyzed by corrinoid-dependent enzyme systems potentially susceptible to N2O inhibition; abbreviations: CH3-EnzComp, CH3-formation enzyme complexes; CH3-H4MPT, methyl-tetrahydromethanopterin; MTR, N5-methyltetrahydromethanopterin:CoM methyltransferase; MTs, substrate-specific methyltransferases; CH3-R, methylated compounds (e.g. methanol).
Figure 2
Figure 2
Effect of N2O on CH4 production and growth yields in axenic M. Barkeri cultures; the upper panels show time courses of CH4 production in cultures that received MeOH (A), H2 (C), or acetate (E); the bottom panels display growth yields after 38-day incubation for M. Barkeri growing with MeOH (B), H2 (D), or acetate (F); error bars represent the standard deviation of replicate samples and are not shown when smaller than the symbol size; n = 3 for (A), (C), and (E); n = 9 (including three technical replicates for triplicate biological samples) for (B), (D), and (F).
Figure 3
Figure 3
The composition and relative abundances of total sequences representing methanogenic archaea in mixed cultures enriched with acetate, H2/CO2, or MeOH; (A) phylogenetic placements of archaeal 16S rRNA gene amplicons detected in the enrichment cultures; the highlighted lobes indicate major clades of archaea known or suspected to produce CH4; the circles indicate best phylogenetic placements of archaeal taxa identified across all enrichment conditions; the size of the circle is proportional to the number of actual sequence variants (ASVs) detected; large shaded areas indicate archaeal superphyla, including Diapherotrites, Parvarchaeota, Aenigmarchaeota, Nanohaloarchaeota, and Nanoarchaeota (DPANN) and Thaumarchaeota, Aigarchaeota, Crenarchaeota, and Korarchaeota (TACK); see Supplemental Information for details on tree construction and fragment placement methodology; (B) relative abundances of total sequences representing methanogenic archaea in mixed cultures; panels (C) MeOH, (D) H2/CO2, and (E) acetate depict qPCR data showing the proportional changes of total bacterial and total archaeal (methanogen) 16S rRNA genes in the mixed cultures without N2O and in the presence of 10 and 30 μM N2O; error bars represent the standard deviation of replicate samples (n = 9, three technical replicates of triplicate biological samples).
Figure 4
Figure 4
Effects of N2O on CH4 production and growth yields in methanogenic mixed cultures enriched with MeOH, H2, or acetate; the upper panels depict CH4 production from MeOH (A), H2 (C), and acetate (E); the bottom panels demonstrate methanogen growth yield differences in cultures amended with MeOH (B), H2 (D), or acetate (F); error bars represent standard deviation and are not shown when smaller than the symbol size (n = 3 for upper panels; n = 9 for bottom panels [three technical replicates of triplicate biological samples]).
Figure 5
Figure 5
Kinetics of CH4 production from MeOH, H2, and acetate in whole-cell suspension assays of M. Barkeri and the methanogenic mixed cultures in the presence of increasing concentrations of N2O; the upper panels show the Michaelis–Menten plots of CH4 production rates versus the respective substrate concentrations in cell suspensions of M. Barkeri without and in the presence of increasing N2O concentrations in basal salt medium amended with MeOH (A), H2 (B), or acetate (C); the bottom panels show Michaelis–Menten plots of CH4 production rates versus the respective substrate concentrations in concentrated whole-cell suspensions of the methanogenic mixed cultures without N2O and in the presence of increasing N2O levels in basal salt medium amended with MeOH (D), H2 (E), or acetate (F); the shaded ribbons represent the standard distances (95% confidence interval) between the measured values and the nonlinear regression lines.

References

    1. Intergovernmental Panel on Climate Change (IPCC) . Stocker TF (ed.), Climate change 2013: the physical science basis. Working Group I contribution to the fifth assessment report of the Intergovernmental Panel on Climate Change. New York: Cambridge University Press, 2013. 10.1017/CBO9781107415324 - DOI
    1. Intergovernmental Panel on Climate Change (IPCC) . Global Warming of 1.5°C: IPCC Special Report on Impacts of Global Warming of 1.5°C above Pre-Industrial Levels in Context of Strengthening Response to Climate Change, Sustainable Development, and Efforts to Eradicate Poverty. Cambridge: Cambridge University Press, 2018. https://www.ipcc.ch/sr15/
    1. United Nations Framework Convention on Climate Change (UNFCCC) . Adoption of the Paris Agreement. Report No. FCCC/CP/2015/L.9/Rev.1. Geneva: United Nations, 2015. https://unfccc.int/resource/docs/2015/cop21/eng/l09r01.pdf
    1. Intergovernmental Panel on Climate Change (IPCC) . Shukla PR (ed.), Climate Change and Land: An IPCC Special Report on Climate Change, Desertification, Land Degradation, Sustainable Land Management, Food Security, and Greenhouse Gas Fluxes in Terrestrial Ecosystems, Geneva, Switzerland, 2019). https://www.ipcc.ch/srccl/download/.
    1. Luan J, Wu J, Liu S et al. Soil nitrogen determines greenhouse gas emissions from northern peatlands under concurrent warming and vegetation shifting. Commun Biol 2019;2:132. 10.1038/s42003-019-0370-1 - DOI - PMC - PubMed