. 2024 May 7;36(5):1088-1104.e12.
doi: 10.1016/j.cmet.2024.02.004. Epub 2024 Mar 5.

Hepatic malonyl-CoA synthesis restrains gluconeogenesis by suppressing fat oxidation, pyruvate carboxylation, and amino acid availability

Affiliations

Hepatic malonyl-CoA synthesis restrains gluconeogenesis by suppressing fat oxidation, pyruvate carboxylation, and amino acid availability

Stanislaw Deja et al. Cell Metab. .

Abstract

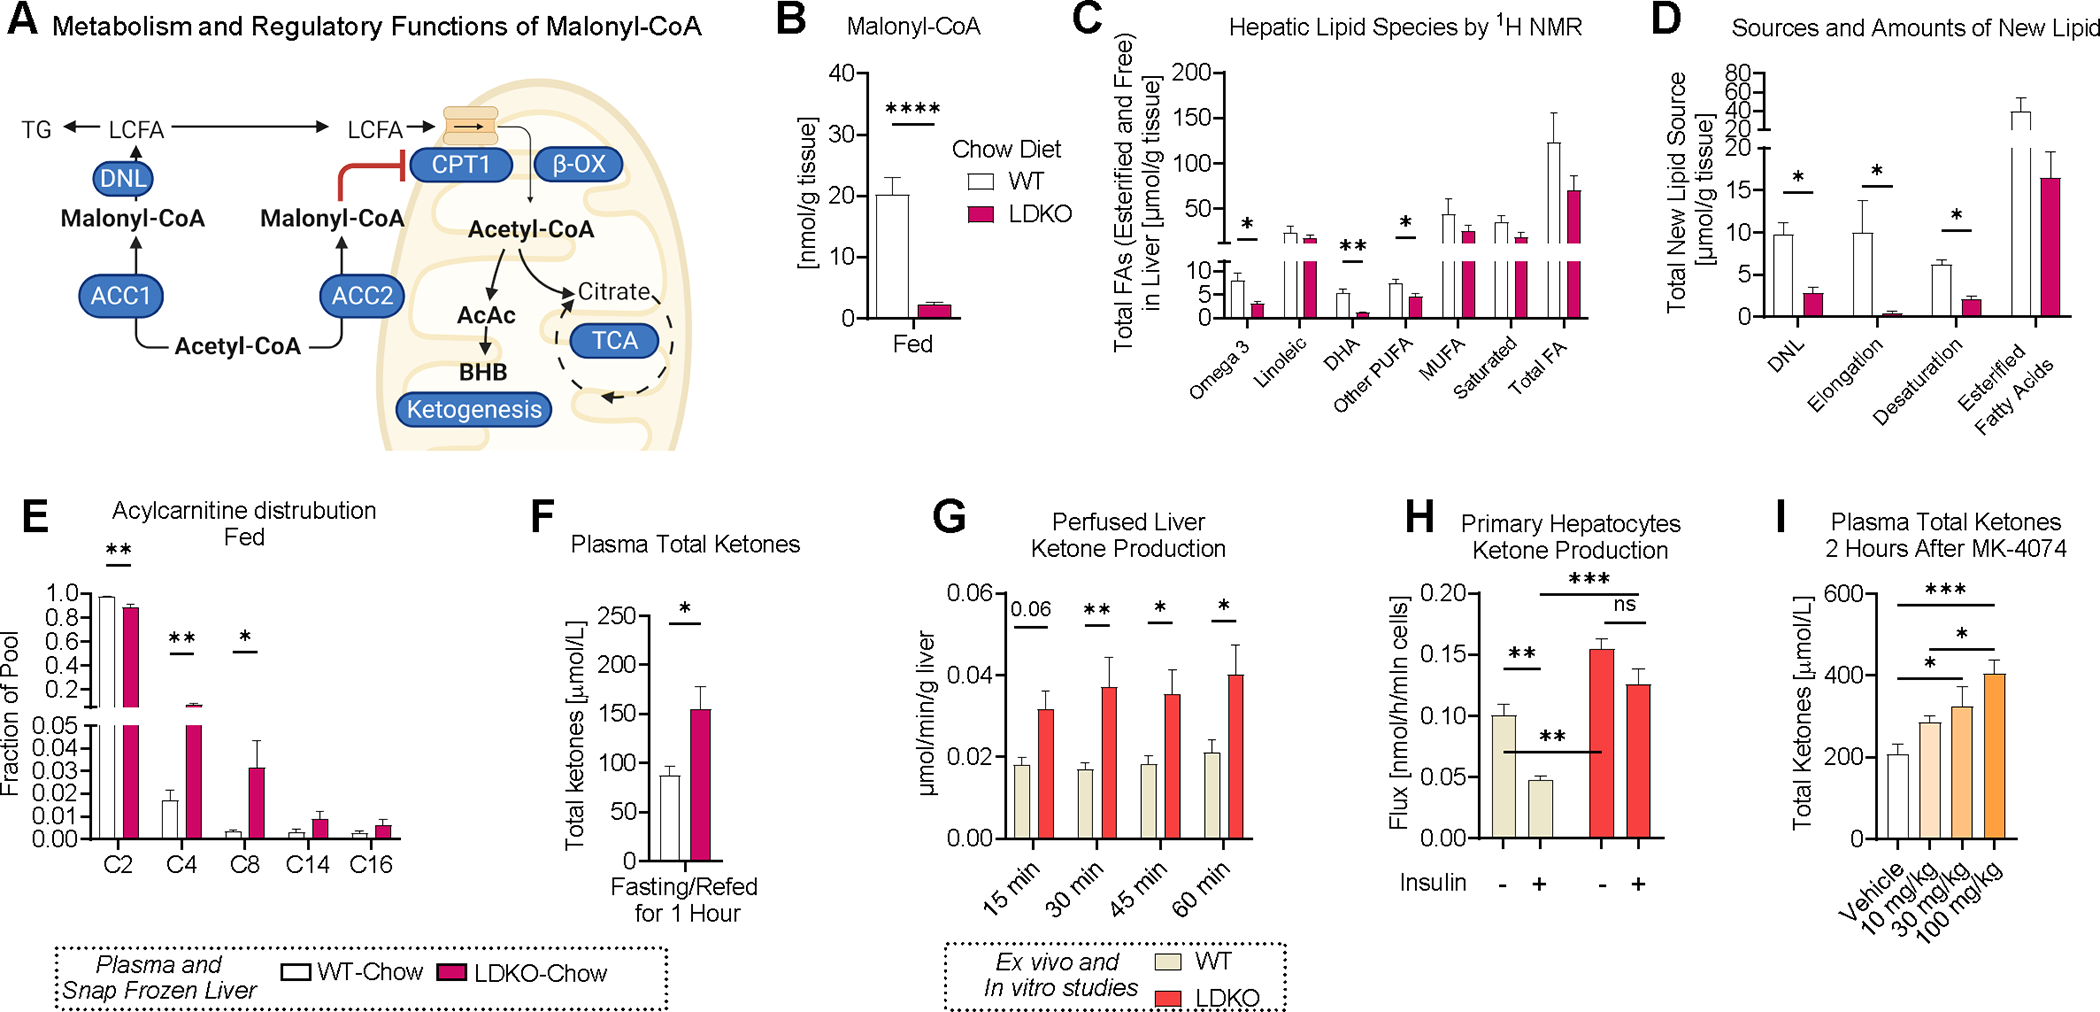
Acetyl-CoA carboxylase (ACC) promotes prandial liver metabolism by producing malonyl-CoA, a substrate for de novo lipogenesis and an inhibitor of CPT-1-mediated fat oxidation. We report that inhibition of ACC also produces unexpected secondary effects on metabolism. Liver-specific double ACC1/2 knockout (LDKO) or pharmacologic inhibition of ACC increased anaplerosis, tricarboxylic acid (TCA) cycle intermediates, and gluconeogenesis by activating hepatic CPT-1 and pyruvate carboxylase flux in the fed state. Fasting should have marginalized the role of ACC, but LDKO mice maintained elevated TCA cycle intermediates and preserved glycemia during fasting. These effects were accompanied by a compensatory induction of proteolysis and increased amino acid supply for gluconeogenesis, which was offset by increased protein synthesis during feeding. Such adaptations may be related to Nrf2 activity, which was induced by ACC inhibition and correlated with fasting amino acids. The findings reveal unexpected roles for malonyl-CoA synthesis in liver and provide insight into the broader effects of pharmacologic ACC inhibition.

Keywords: Nrf2; TCA cycle; acetyl-CoA carboxylase; anaplerosis; autophagy; gluconeogenesis; lipogenesis; malonyl-CoA; protein synthesis; proteolysis.


Conflict of interest statement

Declaration of interests J.D.H. is a consultant for Merck, Pfizer, and Regeneron.

Figures

Figure 1.
Figure 1.. Loss of hepatic malonyl-CoA inhibits DNL and induces ketogenesis in fed-mice.
(A) Scheme illustrating the role of malonyl-CoA in liver metabolism. (B) Liver malonyl-CoA concentration measured by LC-MS/MS analysis (n=8–11). (C) Absolute quantification of lipid species detected by 1H NMR of Folch extracts of liver (n=4). (D) Absolute amount of newly synthesized FA species on triglyceride following 2H2O administration (n=4). Deuterium incorporation was measured by 2H NMR of Folch extracts of liver. (E) Hepatic acylcarnitine distribution as a fraction of the total acylcarnitine pool (n=7–11). (F) Total plasma ketones (BHB and AcAc) after an 18-hour fast and 1 hour of refeeding (n=6). (G) Total ketone production by ex vivo perfused liver (normalized to liver mass) from ad libitum fed mice (n=3). (H) Total ketone production in vitro by primary mouse hepatocytes exposed to insulin (normalized to cell number) (n=3). (I) Total plasma ketones (BHB and AcAc) 2 hours after oral administration of MK-4074 at 10, 30 and 100 mg/kg doses (n=3). Data are presented as mean ± SEM with the n of each group shown as individual points. Two group comparisons were evaluated using unpaired Student’s t-test. Four group comparisons were evaluated using two-way ANOVA. Time course data were evaluated using repeated measures ANOVA. Dose effects were evaluated using a one-way ANOVA. Significance is noted as: *p < 0.05, **p < 0.01, ***p < 0.001.
Figure 2.
Figure 2.. Loss of hepatic ACC1/2 induces gluconeogenesis in fed-mice.
(A) Blood glucose measured in the morning without withholding food (ad libitum) in chow and HFD mice (n=8–11). (B) plasma insulin measured in the morning without withholding food in chow and HFD mice (n=6–12). (C) Hepatic gene expression related to gluconeogenesis from ad libitum fed chow and HFD mice (n=8–11). (D-E) Lactate/pyruvate (10/1) tolerance test (LPTT) conducted in 4-hour (morning) fasted (D) chow mice (n=7–9) (E) mice after 8-week HFD feeding (n=4–5). (F) Hepatic malonyl-CoA concentration 2 hours after oral administration of MK-4074 at 10, 30 and 100 mg/kg doses (n=6). (G) Lactate/pyruvate (10/1) tolerance test (LPTT) conducted in 2 hour (morning) fasted mice after administration of MK-4074 at a 100 mg/kg dose (n=4–5). (H) Summary of the in vivo 2H/13C stable isotope tracer infusion and metabolic flux analysis (MFA) to estimate sources and rates of glucose production. 2H2O was administered I.P., and [U-13C3]propionate and [3,4-13C2]glucose were infused through a jugular vein catheter. Deuterium labels all newly synthesized glucose on C2, but C5 can only be labeled during gluconeogenesis, and C6 can only be labeled when anaplerotic precursors pass through the TCA cycle . The independent dilution of [3,4-13C2]glucose allows glucose production and its fractional sources to be expressed as absolute rates. (I) Absolute fluxes of endogenous glucose production estimated in 4-hour fasted mice (n=10–11). Data are presented as mean ± SEM with the n of each group shown as individual points or noted in the respective legends. Two group comparisons were evaluated using unpaired Student’s t-test. Four group comparisons were evaluated using two-way ANOVA. Time course data were evaluated using repeated measures ANOVA. Dose effects were evaluated using a one-way ANOVA. The effect of genotype is given as exact p values. Significance is noted as: *p < 0.05, **p < 0.01, ***p < 0.001.
Figure 3.
Figure 3.. Inactivation of hepatic ACC1/2 promotes gluconeogenesis, TCA cycle metabolism, and pyruvate anaplerosis by increasing CPT-1 dependent fatty acid oxidation.
(A) Scheme illustrating the mechanisms by which increased fatty acid oxidation can facilitate hepatic gluconeogenesis. (B) In vivo hepatic pyruvate carboxylase (PC) mediated anaplerosis and TCA cycle turnover estimated by 2H/13C MFA (n=10–11). (C) ATP utilization and production estimated by stoichiometric analysis of in vivo flux data (n=10–11). (D) Hepatic acetyl-CoA concentration in fed mice on chow and high-fat diets (n=8–11). (E) Hepatic citrate concentration in fed mice on chow and high-fat diets (n=8–11). (F) Scheme illustrating citrate isotopomers that form in the first turn of the TCA cycle when primary mouse hepatocytes (PMHs) metabolize various substrates. [U-13C3]lac/pyr labels citrate with M+3 by PC mediated anaplerosis. Both [U13-C16]palmitate and [1-13C]octanoate label acetyl-CoA but produce M+2 and M+1 citrate, respectively. (G) Effect of CPT-1 inhibition (3 μM etomoxir) on citrate M+2 originating from [U13-C16]palmitate (0.2 mM) in LDKO PMHs (left) or MK-4074 treated WT PMHs (right) (n=3). (H) Effect of CPT-1 inhibition (3 μM etomoxir) on citrate M+1 originating from [1-13C]octanoate (0.07 mM) in LDKO PMHs (left) or MK-4074 treated WT PMHs (right) (n=3). Note the x4 multiplication to account for the fact that only 1 of 4 acetyl-CoA units are labeled by [1-13C]octanoate. (I) Effect of 3 μM etomoxir on glucose production from LDKO PMHs (n=3). (J) Blood glucose in mice prior to, and 2 hours after, oral administration of MK-4074 (100 mg/kg) and the effect of blocking CPT1 (20mg/kg etomoxir) 30 minutes prior to MK-4074 administration (n=5–6). (K) Effect of genetic and pharmacologic inactivation of ACC1/2 on pyruvate carboxylation (10 mM [U-13C3]lactate/ 1 mM [U-13C3]pyruvate) when PMHs were provided CPT-1 dependent long chain fatty acids (0.2 mM LCFAs) (n=4) or (L) CPT-1 independent octanoate (0.07 mM) (n=4). (M) Effect of CPT-1 inhibition on pyruvate carboxylation under the same conditions in LDKO PMHs (n=4). Hepatic TCA cycle intermediate concentrations in Fed (N) LDKO mice (n=8–11), (O) C57BL6 mice 2 hours after ACC1/2 inhibition (100 mg/kg MK-4074) and CPT-1 inhibition (20 mg/kg etomoxir) (n=6), and (P) liver specific pyruvate carboxylase knockout mice 2 hours after ACC1/2 inhibition (MK-4074 at 100 mg/kg) (n=7). Data are presented as the mean ± SEM with the n of each group shown as individual points or noted in the respective legends. Two group comparisons were evaluated using unpaired Student’s t-test. Multiple groups involving a single variable were evaluated using a one-way ANOVA. Multiple groups involving two variables were evaluated using a two-way ANOVA. Significance is given as: *p < 0.05, **p < 0.01, ***p < 0.001. Tendencies (p < 0.1) are noted as exact p-values.
Figure 4.
Figure 4.. Fasting mitigates the impact of ACC1/2 loss on malonyl-CoA and acetyl-CoA but not effects on glycemia and TCA cycle intermediates.
(A) Liver malonyl-CoA concentration in ad libitum fed and 18-hour fasted mice on a chow diet (n=8–11). (B) Fasting blood glucose in chow and HFD mice (n=13–17). (C) Serial blood glucose levels throughout a 24-hour fast (n=5–7). (D) Liver acetyl-CoA concentration in fasted mice on a chow or HFD (n=9–11). (E) Hepatic TCA cycle intermediate concentrations in fasted mice on a chow diet (n=9–11). (F) Hepatic lactate and pyruvate concentrations in fed and fasted mice on a chow diet (n=6–11). (G) Glucose production by ex vivo livers from 18-h fasted mice that were perfused with 0.2 mM LCFAs and variable amounts of lactate/pyruvate (data expressed as % of WT baseline) (n=3–4). (H) Effect of loss of the gluconeogenic pathway on fasting plasma glucose in LDKO mice using ACC1/2 and Pck1 liver specific triple knockout mice (n=4–9). (I) Scheme illustrating the metabolic connectivity between anaplerotic substrate, cataplerosis via PEPCK-C and ACC activity. Data are presented as mean ± SEM with the n of each group shown as individual points or noted in the respective legends. Two group comparisons were evaluated using an unpaired Student’s t-test. Single cohorts with multiple variables were evaluated by a one-way ANOVA. Groups with multiple variables were evaluated by a two-way ANOVA. Significance is given as: *p < 0.05, **p < 0.01, ***p < 0.001. Tendencies (p < 0.1) are noted as exact p values.
Figure 5.
Figure 5.. A surplus of endogenous pyruvate maintains TCA cycle intermediates and gluconeogenesis during fasting in LDKO mice.
(A) Schematic of a [U-13C3]lactate/pyruvate tolerance test (LPTT) in 18-hour fasted mice. 50% enriched [U-13C3]lactate and [U-13C3]pyruvate was administered analogous to a normal LPTT except that blood and liver tissue were collected at 30-min to approximate a pseudo-steady state. Samples were analyzed by GC-MS to determine the mass isotopomer distributions (MID) of glucose and liver metabolites (excluding M+0 for clarity). (B) Blood glucose and lactate dynamics (n=6–9). MIDs of (C) plasma glucose carbons C4-C6 (originating from single triose precursor) (n=6–9) and (D) liver lactate (n=6–9). (E) Illustration of how carbon sources of plasma glucose are determined during a [U-13C3]lactate/pyruvate experiment. Atom percent enrichment (APE) of the product, relative to the APE of the respective precursor represents the fractional contribution of precursor carbons to product carbons. For example, the glucose C4-C6 APE relative to the 50% APE of exogenous lactate/pyruvate indicates the fraction of plasma glucose carbons that originate from exogenous lactate and pyruvate carbons. Likewise, the glucose C4-C6 APE relative to the APE of hepatic lactate indicates the fraction of plasma glucose carbons that originate from all sources of lactate and pyruvate. Glucose carbons that originate from all endogenous pyruvate sources and all non-pyruvate sources were derived from these measurements. The latter includes carbon sources such as glycerol, acetyl-CoA, bicarbonate, and preexisting glucose. (F) Concentration of plasma glucose attributed to all pyruvate carbon sources (n=6–9). (G) Concentration of plasma glucose attributed to LPTT carbon sources (n=6–9). (H) Concentration of plasma glucose attributed to endogenous pyruvate carbons (n=6–9). (I) Concentration of plasma glucose attributed to all non-pyruvate carbons (n=6–9). (J) Schematic of the 13C MFA model network for the [U-13C3] labeled LPTT. Highlighted are 9 different liver intermediates yielding 19 different MID fragments that were used to regress fluxes relative to the input of pyruvate from the LPTT (VLPTT = 1). (K) Substrate source fluxes (n=6–9) and (L) TCA cycle related fluxes (n=6–9) determined by MFA. (M) Schematic illustrating that surplus sources of endogenous pyruvate contribute to glucose production in LDKO livers. Data are presented as mean ± SEM with the n of each group shown as individual points or noted in the respective legends. Two group comparisons were evaluated using an unpaired Student’s t-test. Single cohorts with multiple variables were evaluated by a one-way ANOVA. Groups with multiple variables were evaluated by a two-way ANOVA. Significance is given as: *p < 0.05, **p < 0.01, ***p < 0.001.
Figure 6.
Figure 6.. Surplus hepatic amino acids support glycemia in fasting LDKO mice.
(A) Effect of ACC1/2 inactivation on alanine M+3 in hepatocytes incubated with [U-13C3]lactate/pyruvate (left) (n=4) and liver of LDKO mice during an [U-13C3]LPTT (right) (n=6–9). Hepatic concentrations of (B) essential amino acids (EAA) (n=8–11), (C) urea cycle amino acids (n=8–11), and (D) non-essential amino acids in fed and fasted mice on a chow diet (n=8–11). (E) Difference between fed and fasted concentrations of various amino acid classes (n=9–11). (F) Liver and plasma essential (EAA) and branch-chain amino acids (BCAA) in fasted mice (n=4). (G) Correlations of hepatic alanine with hepatic essential amino acids (left), lactate (middle), and 4-carbon TCA cycle intermediates (right) (n=9–11). (H) Effect of inhibiting proteolysis on hepatic EAAs and BCAAs (n=5–9). Proteolysis was inhibited by intraperitoneal injection of leupeptin (1st dose = 4mg/kg at 10 AM, 2nd dose = 2mg/kg at 6AM next day, mice were fasted for total of 24h). (I) Effect of inhibiting proteolysis on the time course of blood glucose during fasting (n=6–9). (J) Correlation between fasting blood glucose and hepatic BCAA during inhibition of proteolysis (n=5–6). (K) Western blot quantification of autophagy related proteins LC3-II (n=4–6) and (L) phosphorylated (S349) P62 (n=4–6) 4 hours after a single 40mg/kg dose of leupeptin in 20-hour fasted mice (24 hours fasted in total). Data are presented as mean ± SEM with the n of each group shown as individual points or noted in the respective legends. Two group comparisons were evaluated using an unpaired Student’s t-test. Groups with multiple variables were evaluated by a two-way ANOVA. Significance is given as: *p < 0.05, **p < 0.01, ***p < 0.001. Tendencies (p < 0.1) are noted as exact p-values.
Figure 7.
Figure 7.. Chronic adaptations to loss of ACC1/2 promote amino acid availability and elevated glycemia during fasting.
(A) Western blot quantification of Akt signaling (i.e., pAKT/AKT) and mTORC1 signaling (i.e., pS6/S6) in livers of fed, 24-hour fasted, and refed mice (n=4). (B) Hepatic Nrf2 activation based on the western blot quantification of NQO1 and HO-1 in fed and fasted LDKO mice (n=4). (C) Correlation between hepatic NQO1 and hepatic BCAA (n=4). (D) Hepatic NQO1 content 2 hours after oral administration of various doses of MK-4074 (left) (n=6) and its correlation with hepatic malonyl-CoA (right) (n=5–6). Correlation between hepatic NQO1 and (E) the redox states of NAD(H) (i.e., lactate:pyruvate ratio) and NADP(H) redox (i.e., malate:pyruvate ratio) (n=5–6), and (F) hepatic fumarate concentration in MK-4074 treated mice (n=5–7). (G) Correlation between hepatic NQO1 and phospho-P62 in livers from LDKO and WT mice (n=4). (H) Summary of the factors that influence Nrf2 activation during loss of ACC1/2 function. (I) Liver weights (n=4–10) and (J) Loss of liver mass during fasting, calculated as the difference between the mass of livers from 24-hour and 4-hour fasted mice (n=10). (K) Fractional new protein synthesis measured by 2H incorporation into total liver protein after a baseline 12-hour fast and subsequent additional 12 hours of fasting or 12 hours of refeeding (n=5–6). The differential effects of acute MK-4074 administration on fed and mice with regard to: (L) Nrf2 activation (n=6–7), (M) Hepatic TCA cycle intermediates (n=6–7), and (N) Hepatic BCAAs (n=6–7). The effects of a 5-day MK-4074 administration (twice/day at 100 mg/kg) on (O) blood glucose (n=6), (P) hepatic citrate and total TCA cycle intermediate concentrations (n=6), (Q) hepatic EAA and BCAA concentrations (n=6), and (R) liver size (% of body weight) (n=6). (S) correlation between liver size and hepatic BCAA concentrations (n=6). Data are presented as mean ± SEM with the n of each group shown as individual points or noted in the respective legends. Two group comparisons were evaluated using an unpaired Student’s t-test. Single cohorts with multiple variables were evaluated by a one-way ANOVA. Groups with multiple variables were evaluated by a two-way ANOVA. Significance is given as: *p < 0.05, **p < 0.01, ***p < 0.001. Tendencies (p < 0.1) are noted as exact p-values.

References

    1. Foster DW (1984). Banting lecture 1984. From glycogen to ketones--and back. Diabetes 33, 1188–1199. 10.2337/diab.33.12.1188. - DOI - PubMed
    1. Martínez-Reyes I, and Chandel NS (2020). Mitochondrial TCA cycle metabolites control physiology and disease. Nature communications 11, 102. 10.1038/s41467-019-13668-3. - DOI - PMC - PubMed
    1. Frezza C (2017). Mitochondrial metabolites: undercover signalling molecules. Interface Focus 7, 20160100. 10.1098/rsfs.2016.0100. - DOI - PMC - PubMed
    1. Inigo M, Deja S, and Burgess SC (2021). Ins and Outs of the TCA Cycle: The Central Role of Anaplerosis. Annual review of nutrition 41, 19–47. 10.1146/annurev-nutr-120420-025558. - DOI - PubMed
    1. Baker SA, and Rutter J (2023). Metabolites as signalling molecules. Nature reviews. Molecular cell biology 24, 355–374. 10.1038/s41580-022-00572-w. - DOI - PubMed

Publication types

LinkOut - more resources