

Unlocking melanoma Suppression: Insights from Plasma-Induced potent miRNAs through PI3K-AKT-ZEB1 axis
- PMID: 38447612
- PMCID: PMC11785563
- DOI: 10.1016/j.jare.2024.02.022
Unlocking melanoma Suppression: Insights from Plasma-Induced potent miRNAs through PI3K-AKT-ZEB1 axis
Abstract
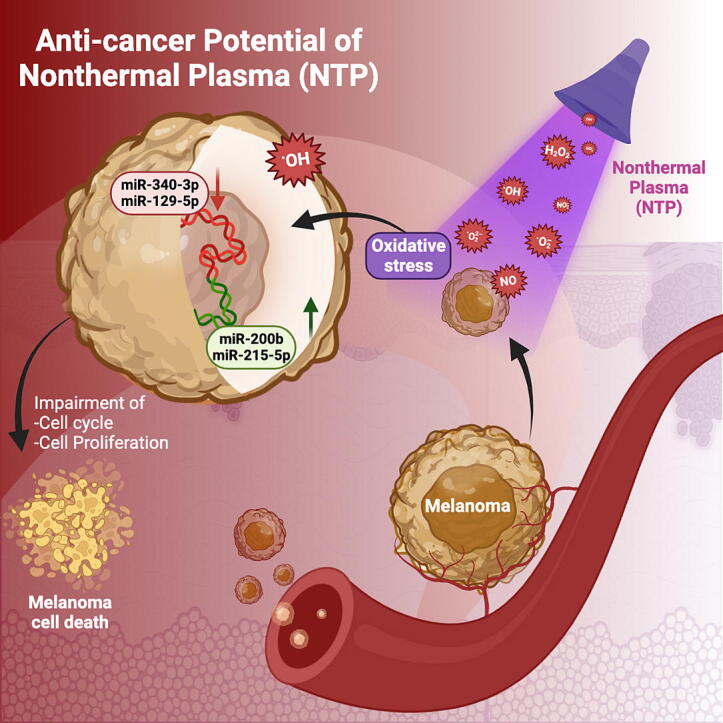
Introduction: Melanoma is a rare but highly malignant form of skin cancer. Although recent targeted and immune-based therapies have improved survival rates by 10-15%, effective melanoma treatment remains challenging. Therefore, novel, combinatorial therapy options such as non-thermal atmospheric pressure plasma (NTP) are being investigated to inhibit and prevent chemoresistance. Although several studies have reported the apoptotic and inhibitory effects of reactive oxygen species produced by NTP in the context of melanoma, the intricate molecular network that determines the role of microRNAs (miRNAs) in regulating NTP-mediated cell death remains unexplored.
Objectives: This study aimed to explore the molecular mechanisms and miRNA networks regulated by NTP-induced oxidative stress in melanoma cells.
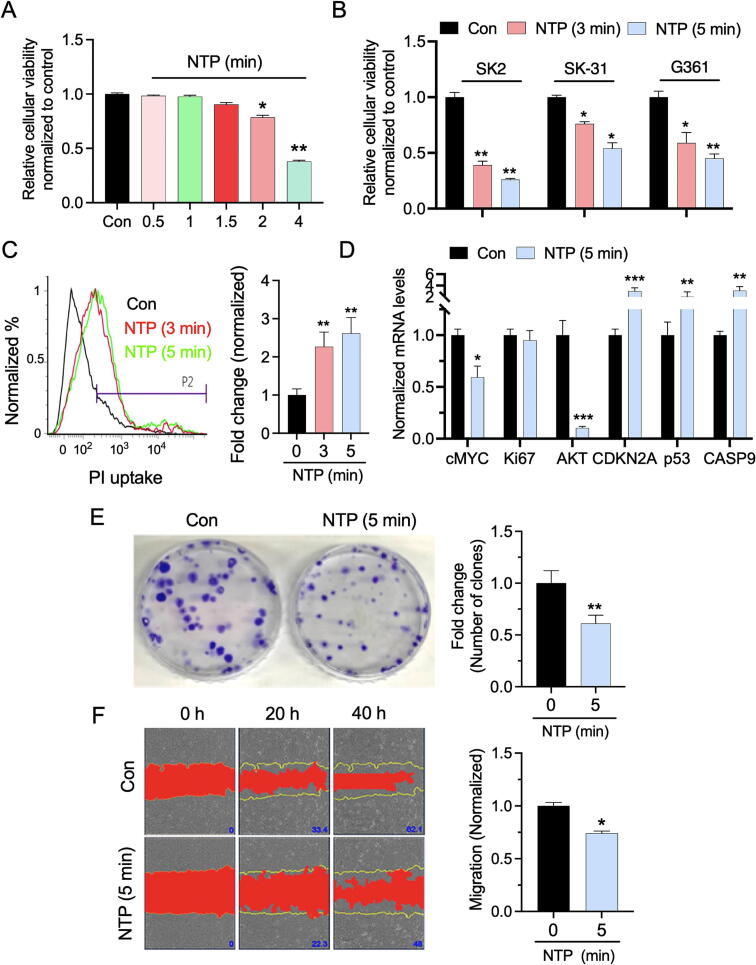
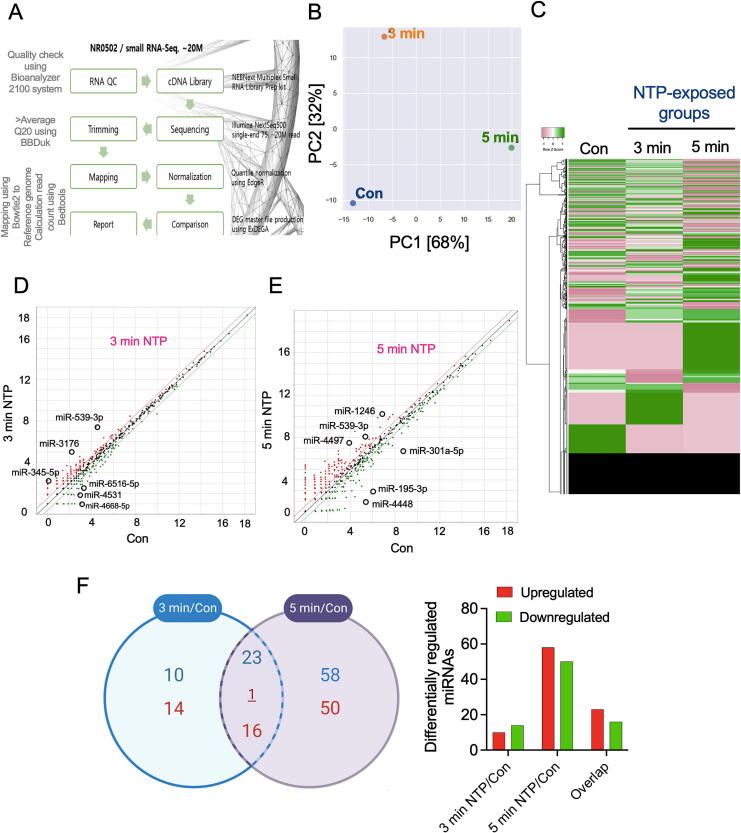
Methods: Melanoma cells were exposed to NTP and then subjected to high-throughput miRNA sequencing to identify NTP-regulated miRNAs. Various biological processes and underlying molecular mechanisms were assessed using Alamar Blue, propidium iodide (PI) uptake, cell migration, and clonogenic assays followed by qRT-PCR and flow cytometry.
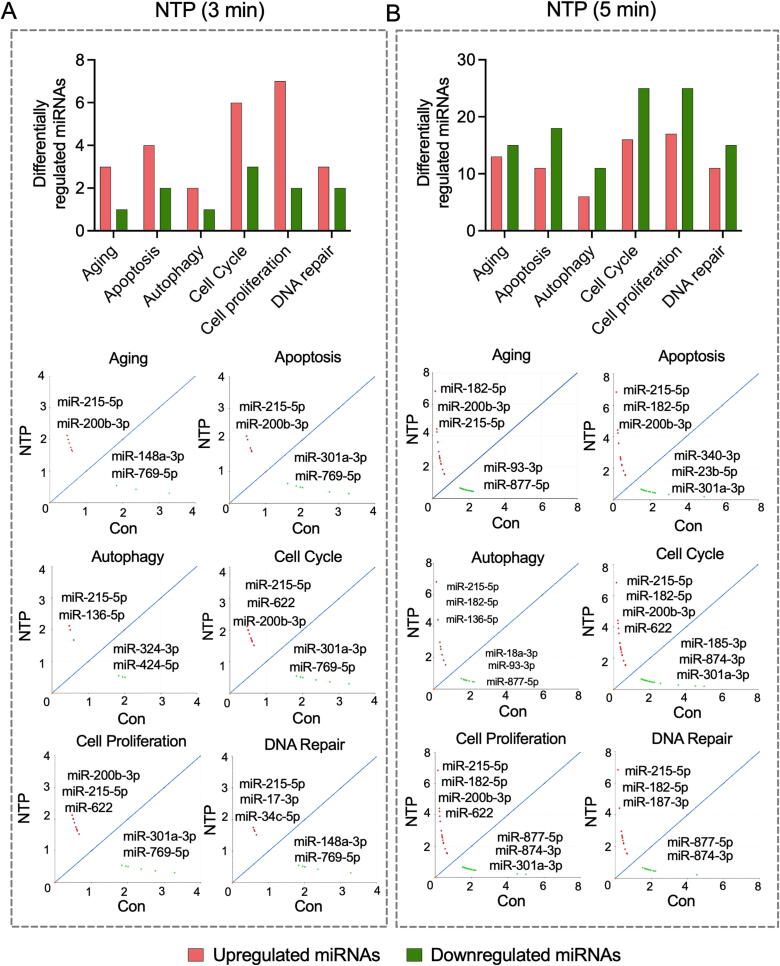
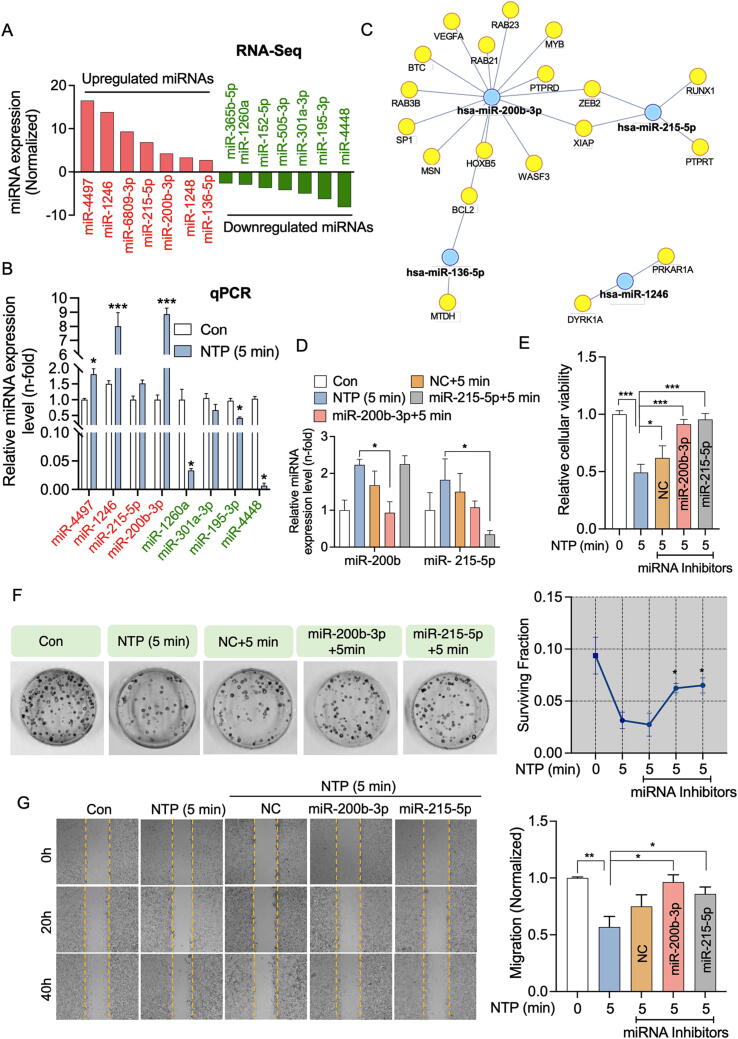
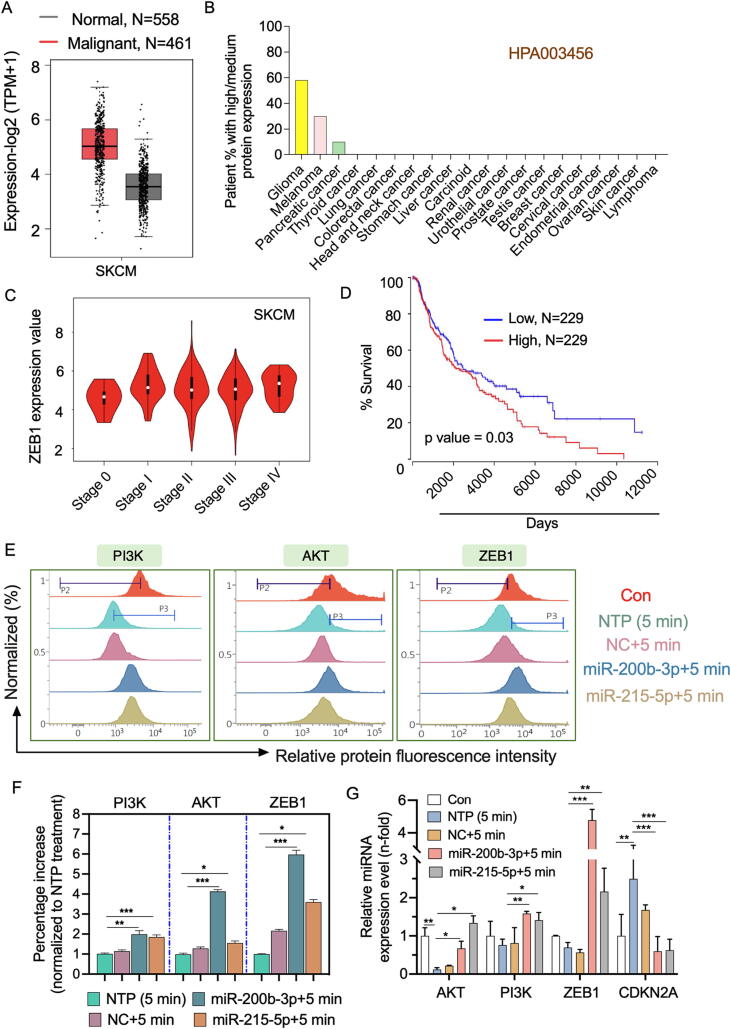
Results: NTP exposure for 3 min was sufficient to modulate the expression of several miRNAs, inhibiting cell growth. Persistent NTP exposure for 5 min increased differential miRNA regulation, PI uptake, and the expression of genes involved in cell cycle arrest and death. qPCR confirmed that miR-200b-3p and miR-215-5p upregulation contributed to decreased cell viability and migration. Mechanistically, inhibiting miR-200b-3p and miR-215-5p in SK-2 cells enhancedZEB1, PI3K, and AKT expression, increasing cell proliferation and viability.
Conclusion: This study demonstrated that NTP exposure for 5 min results in the differential regulation of miRNAs related to the PI3K-AKT-ZEB1 axis and cell cycle dysregulation to facilitate melanoma suppression.
Keywords: Differential regulation; Melanoma inhibition; Non-thermal plasma; miRNA sequencing.
Copyright © 2023. Published by Elsevier B.V.
Conflict of interest statement
Declaration of competing interest The authors declare that they have no known competing financial interests or personal relationships that could have appeared to influence the work reported in this paper.
Figures
Similar articles
-
miR-200c enhances sensitivity of drug-resistant non-small cell lung cancer to gefitinib by suppression of PI3K/Akt signaling pathway and inhibites cell migration via targeting ZEB1.Biomed Pharmacother. 2017 Jan;85:113-119. doi: 10.1016/j.biopha.2016.11.100. Epub 2016 Dec 5. Biomed Pharmacother. 2017. PMID: 27930974
-
miR-34a inhibits melanoma growth by targeting ZEB1.Aging (Albany NY). 2021 Jun 8;13(11):15538-15547. doi: 10.18632/aging.203114. Epub 2021 Jun 8. Aging (Albany NY). 2021. Retraction in: Aging (Albany NY). 2024 Nov 30;16(21):13432-13433. doi: 10.18632/aging.206155. PMID: 34102608 Free PMC article. Retracted.
-
Effects of miR-145-5p through NRAS on the cell proliferation, apoptosis, migration, and invasion in melanoma by inhibiting MAPK and PI3K/AKT pathways.Cancer Med. 2017 Apr;6(4):819-833. doi: 10.1002/cam4.1030. Epub 2017 Mar 23. Cancer Med. 2017. Retraction in: Cancer Med. 2023 Feb;12(4):5173. doi: 10.1002/cam4.5232. PMID: 28332309 Free PMC article. Retracted.
-
MicroRNA-Directed Cancer Therapies: Implications in Melanoma Intervention.J Pharmacol Exp Ther. 2018 Jan;364(1):1-12. doi: 10.1124/jpet.117.242636. Epub 2017 Oct 20. J Pharmacol Exp Ther. 2018. PMID: 29054858 Free PMC article. Review.
-
Sphingolipid metabolism and regulated cell death in malignant melanoma.Apoptosis. 2024 Dec;29(11-12):1860-1878. doi: 10.1007/s10495-024-02002-y. Epub 2024 Jul 28. Apoptosis. 2024. PMID: 39068623 Review.
Cited by
-
Enhancing Ferroptosis in Lung Adenocarcinoma Cells via the Synergistic Action of Nonthermal Biocompatible Plasma and a Bioactive Phenolic Compound.Biomolecules. 2025 May 9;15(5):691. doi: 10.3390/biom15050691. Biomolecules. 2025. PMID: 40427585 Free PMC article.
-
Exploring MAP3K genes in gastric cancer: biomarkers, tumor microenvironment dynamics, and chemotherapy resistance.Hereditas. 2025 Feb 3;162(1):15. doi: 10.1186/s41065-025-00364-0. Hereditas. 2025. PMID: 39901302 Free PMC article.
-
"Friends or foes": a new perspective of tumour metabolic transcriptional modification.Cell Death Dis. 2025 Feb 17;16(1):106. doi: 10.1038/s41419-025-07429-y. Cell Death Dis. 2025. PMID: 39962057 Free PMC article. Review.
-
Inhibition of PNCK inflames tumor microenvironment and sensitizes head and neck squamous cell carcinoma to immune checkpoint inhibitors.J Immunother Cancer. 2024 Oct 12;12(10):e009893. doi: 10.1136/jitc-2024-009893. J Immunother Cancer. 2024. PMID: 39395840 Free PMC article.
References
-
- Davies H., Bignell G.R., Cox C., Stephens P., Edkins S., Clegg S., et al. Mutations of the BRAF gene in human cancer. Nature. 2002;417:949–954. - PubMed
MeSH terms
Substances
LinkOut - more resources
Full Text Sources
Medical
Research Materials
Miscellaneous
