. 2024 May;629(8010):228-234.
doi: 10.1038/s41586-024-07255-w. Epub 2024 Mar 6.

The molecular basis of sugar detection by an insect taste receptor

Affiliations

The molecular basis of sugar detection by an insect taste receptor

João Victor Gomes et al. Nature. 2024 May.

Abstract

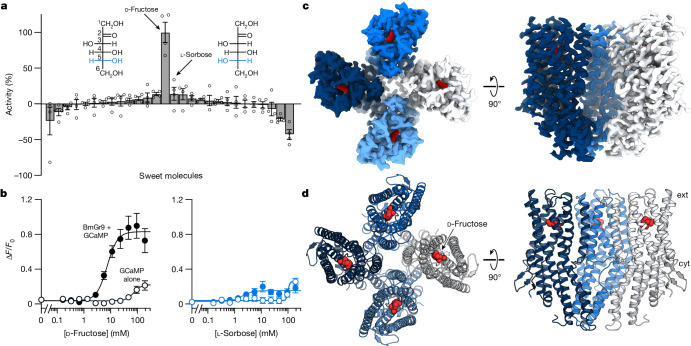
Animals crave sugars because of their energy potential and the pleasurable sensation of tasting sweetness. Yet all sugars are not metabolically equivalent, requiring mechanisms to detect and differentiate between chemically similar sweet substances. Insects use a family of ionotropic gustatory receptors to discriminate sugars1, each of which is selectively activated by specific sweet molecules2-6. Here, to gain insight into the molecular basis of sugar selectivity, we determined structures of Gr9, a gustatory receptor from the silkworm Bombyx mori (BmGr9), in the absence and presence of its sole activating ligand, D-fructose. These structures, along with structure-guided mutagenesis and functional assays, illustrate how D-fructose is enveloped by a ligand-binding pocket that precisely matches the overall shape and pattern of chemical groups in D-fructose. However, our computational docking and experimental binding assays revealed that other sugars also bind BmGr9, yet they are unable to activate the receptor. We determined the structure of BmGr9 in complex with one such non-activating sugar, L-sorbose. Although both sugars bind a similar position, only D-fructose is capable of engaging a bridge of two conserved aromatic residues that connects the pocket to the pore helix, inducing a conformational change that allows the ion-conducting pore to open. Thus, chemical specificity does not depend solely on the selectivity of the ligand-binding pocket, but it is an emergent property arising from a combination of receptor-ligand interactions and allosteric coupling. Our results support a model whereby coarse receptor tuning is derived from the size and chemical characteristics of the pocket, whereas fine-tuning of receptor activation is achieved through the selective engagement of an allosteric pathway that regulates ion conduction.


Conflict of interest statement

The authors declare no competing interests.

Figures

Fig. 1
Fig. 1. Structure of an insect taste receptor.
a, Activation of BmGr9 by a panel of sweet compounds, measured as the change in fluorescence relative to that for d-fructose. Bars are mean ± s.e.m. with independent samples (n = 4) shown as open circles. Insets show Fischer projections of the epimers d-fructose and l-sorbose, with carbons numbered and difference highlighted in blue. b, Dose–response of raw fluorescence changes of HEK293 cells transfected with BmGr9 and GCaMP (filled circles) or GCaMP alone (open circles) when titrated with d-fructose (left) or l-sorbose (right). d-Fructose data are best fitted by an EC50 of 8.2 (5.9–11.5) mM with a Hill coefficient of 2.3 (1.3–4.6) (n = 8 independent samples; points are mean ± s.e.m.; fitted 95% confidence intervals are given in parentheses). For l-sorbose (n = 5 independent samples), the maximum activity is less than that for control wells with GCaMP alone. c,d, Cryogenic electron microscopy density map (c) and ribbon model (d) of BmGr9 bound to d-fructose (red) shown from the top (left) and side (right). Approximate boundaries for the extracellular (ext) and cytoplasmic (cyt) sides are indicated. In c,d, the front subunit has been removed from the side views to expose the pore.
Fig. 2
Fig. 2. Sugar-binding pocket in BmGr9.
a,b, Position of β-d-fructopyranose (grey, carbons; red, oxygens) within a subunit of BmGr9 (blue) viewed from the top (a) and side (b). c,d, Close-up views showing interactions between BmGr9 and d-fructose (with carbons numbered). Polar interactions are drawn as dashed lines. In c, hydrogens on d-fructose (white) are shown to highlight hydrophobic interactions with Trp354 and Phe333 (indicated by vertical dashes). e, Effect of substitutions within the sugar-binding pocket on the activity of BmGr9. Bars are mean ± s.e.m. with independent samples shown as open circles. Only wild-type BmGr9 and Q351A have significantly different activity from that of GCaMP alone (indicated by grey bars). Statistical significance was determined using one-way analysis of variance (ANOVA) followed by Dunnett’s multiple comparison tests (***P < 0.0001, *P = 0.035). f, Dose response of select mutants from e. Data points are mean ± s.e.m. from n = 6 (Q351A and T330A) or 8 (wild-type BmGr9) independent samples measured from the same plates.
Fig. 3
Fig. 3. Ligand-binding locus is conserved in insect chemoreceptors.
a,b, Slices through the pockets of BmGr9 bound to d-fructose (a) and MhOr5 bound to eugenol (b; Protein Data Bank: 7LID) highlighting the positions of their respective ligands. The dashed line in b denotes the location of the slice presented in e. c,d, Superposition of a single subunit of BmGr9 (blue) and MhOr5 (gold) showing the relative positions of d-fructose (fru) and eugenol (eug), viewed from the top (c) and side (d). e, A vertical slice through the pocket of MhOr5, in a similar orientation to the structures in Fig. 4b,c, showing eugenol encapsulated by MhOr5 with no direct means of egress.
Fig. 4
Fig. 4. Gating of BmGr9.
a,b, The ion permeation pathway of BmGr9, coloured according to pore diameter, in the absence (a) or presence (b) of d-fructose (red spheres). c,d, Close-up views of the pore helices in the absence (c) or presence (d) of d-fructose shown from the top, highlighting key residues in the wetting transition of BmGr9. Hydrogen bonds between Gln443 and Gln445 of adjacent subunits in the closed state are indicated by black dashed lines. Central grey spheres illustrate the narrowest pore diameter, near Phe444 (1.2 Å; c) or Gln445 (3.1 Å; d). e, Fluorescence changes of BmGr9 and mutants when stimulated with 100 mM d-fructose. Q443E and Q445A substitutions yield channels that are more active than those of the wild-type BmGr9. Bars are mean ± s.e.m. with independent samples shown as open circles; grey bars indicate statistically significant activity compared to that of GCaMP alone. Statistical significance was determined using one-way ANOVA followed by Dunnett’s multiple comparison tests (***P < 0.0001, *P = 0.012). f, Dose–response curves of select mutants compared to wild-type BmGr9. Data points are mean ± s.e.m. from n = 6 (Q443A, Q443E and Q445A) or 12 (wild type) independent samples measured from the same plates.
Fig. 5
Fig. 5. Aromatic bridge connecting d-fructose to the channel pore.
a, Conformational changes following binding of d-fructose. Arrows indicate movement of key regions in BmGr9 from the unbound (grey) to the bound (blue) state. b,c, Outline of the sugar-binding pocket in the absence (b) or presence (c) of d-fructose, showing that the pocket volume decreases following binding of d-fructose. d, Fluorescence changes of BmGr9 and aromatic bridge mutants when stimulated with d-fructose. Bars are mean ± s.e.m. with replicates shown as open circles; grey bars indicate statistically significant activity compared to that of GCaMP alone. Statistical significance was determined using one-way ANOVA followed by Dunnett’s multiple comparison tests (***P < 0.0001) e, Dose response of select mutants. Data points are mean ± s.e.m. from n = 6 (Y332F and F333Y) or 8 (wild type) independent experiments collected on the same plates.
Fig. 6
Fig. 6. Several sugars bind BmGr9.
a, Representative tryptophan fluorescence emission spectra of BmGr9 in the absence (dashed line) and presence (solid line) of 100 mM d-fructose. a.u., arbitrary units. b, Titration of purified BmGr9 with hexoses induces a blueshift in the tryptophan fluorescence emission spectrum whereas that with larger sugars does not. The fitted Kd values for d-fructose and l-sorbose are 15.8 (6.4–38.5) mM and 63 (28–140) mM, respectively (n = 4 independently purified samples; points are mean ± s.e.m.; fitted 95% confidence intervals are given in parentheses). c, Change in Trp emission maxima in the presence of 100 mM of a variety of sugars (mean ± s.d., with independent samples shown as open circles). Statistical significance was determined using paired t-tests comparing fluorescence before and after sugar addition (***P = 0.0016, **P = 0.010, *P = 0.016). d, Structure of BmGr9 bound to α-l-sorbopyranose (grey, carbons; red, oxygens), viewed from the side. e,f, Close-up views showing interactions between BmGr9 and α-l-sorbopyranose. Polar interactions are drawn as dashed lines. In f, the C5 hydroxyl facing Phe333 is indicated by an asterisk.
Extended Data Fig. 1
Extended Data Fig. 1. BmGr9 is narrowly tuned to D-fructose.
a, Change in fluorescence upon the addition of 100 mM sweet compounds (except for aspartame and saccharin, which were at 10 mM) in HEK293 cells transfected with BmGr9 plus GCaMP (grey bars) or with GCaMP only (white bars). Bars are mean ± s.e.m with replicates (n = 4) shown as open circles. Only D-fructose (****P < 0.0001) and sucralose (*P = 0.012) additions yielded significantly different activity with BmGr9. Statistical significance determined using unpaired t-tests comparing BmGr9 sugar response to respective GCaMP-only controls. b, Dose-response of fluorescence changes of HEK293 cells transfected with BmGr9 and GCaMP (closed circles) or GCaMP only (open circles) when titrated with select sugars from (a) (n = 4, points are mean ± s.e.m.). Insets show Fischer projections of hexoses and perspective projections of myo-inositol, sucrose, and trehalose. For all data, n values represent biological replicates.
Extended Data Fig. 2
Extended Data Fig. 2. Purification of BmGr9 and cryo-EM workflows.
a, Superose 6 elution profile of purified BmGr9. The majority of the protein elutes as a tetramer. b, Coomassie staining of denaturing and native gels confirm BmGr9 is a homotetramer with an effective molecular weight of approximately 700 kDa (including detergent micelle), similar to Orco. Molecular weight markers are labeled for each gel (similar results were obtained from more than three independent purifications). c, A representative motion-corrected micrograph showing the distribution of fructose-bound BmGr9 single particles (scale bar, 50 nm). The numbers of micrographs and auto-picked particles are shown. d, Example two-dimensional class averages of particles selected for further processing. e, Fourier shell correlation (FSC) curves for the final cryo-EM density maps. Half-map FSC (with tight mask) (left), model-map FSC curves (right). The horizontal dashed line represents the FSC = 0.143 cutoff value. f, Local resolution of fructose-bound BmGr9 density map viewed from the top (top) and side (bottom). In side views, the nearest subunit has been removed to expose the pore. g-m, Equivalent data for unbound BmGr9 (g-j) and sorbose-bound Bmgr9 (k-n).
Extended Data Fig. 3
Extended Data Fig. 3. Computational docking of D-fructose anomers and density within ligand-binding pockets.
a-c, Five lowest energy poses for β-D-fructopyranose, (a), β-D-fructofuranose (b), and α-D-fructofuranose (c) with their respective energy scores (kcal/mol). Experimental ligand density is shown as a grey mesh. The equilibrium composition in solution at room temperature is shown in parenthesis,. d,e, The final positions of β-D-fructopyranose (d, light blue) and β-D-fructofuranose (e, dark blue) after real-space refinement, with carbons numbered. f, Superposition of refined β-D-fructopyranose and β-D-fructofuranose positions. Both ring conformations have similarly positioned hydrogen-bonding groups and hydrophobic surfaces. Stronger density is observed on the side where both conformers of D-fructose have hydroxymethyl groups, consistent with both confomers being bound in our structure and contributing to ligand density. g, Final position of α-L-sorbopyranose after real-space refinement, with carbons numbered. h-k, Side views of ligand-binding pockets of BmGr9 bound to β-D-fructopyranose (h), bound to β-D-fructofuranose (i), unbound (j), and bound to α-L-sorbopyranose (k). Density is shown in light grey.
Extended Data Fig. 4
Extended Data Fig. 4. Structure conservation among sugar-sensing GRs.
a-c, Superposition of fructose-bound BmGr9 (blue), unbound BmGr9 (white), and BmGr9 predicted using AlphaFold2 (yellow). Top views (b,c) of the ligand-binding pocket with residues shown (and labelled in (b)). d, Aligned AlphaFold2 models of known Gr43a-like receptors: BmGr9 (yellow); BmGr10 (purple); DmGr43a (light green); Anopheles gambiae Gr25 (cyan); Helicoverpa armigera Gr9 (grey); Apis mellifera Gr3 (light pink); and Trichogramma chillonis Gr43a (dark pink). e, Comparison of AlphaFold2 models of BmGr9 and DmGr43a, with pocket residues shown. Logo representation of amino acid conservation among the Gr43a-like receptors in (d). Residues that interact with D-fructose are highlighted. f, AlphaFold2 models of D. melanogaster sugar GRs: DmGr5a (light red); DmGr43a (light green); DmGr61a (light blue); DmGr64a (magenta); DmGr64b (dark green); DmGr64c (red); DmGr64d (dark grey); DmGr64e (orange); and DmGr64f (gold). g,h, Comparison of AlphaFold2 models of DmGr43a (light green) and DmGr5a (g, light red) or DmGr64a (h, magenta) with pocket residues shown. No residues in the pocket are conserved between these receptors. In all images, loops are hidden for clarity.
Extended Data Fig. 5
Extended Data Fig. 5. Mutational analysis of the sugar-binding pocket in BmGr9.
a, Fluorescence changes of BmGr9 and mutants when stimulated with 100 mM D-fructose. Bars are mean ± s.e.m with replicates shown as open circles; grey bars indicate statistically significant activity compared to GCaMP only. Statistical significance was determined using one-way ANOVA followed by Dunnett’s multiple comparison tests. F189Y, Y190F, and Q351A are active, but with significantly decreased activity compared to wild-type (WT) BmGr9 (****P < 0.0001). b, D-Fructose dose-response curves of HEK293 cells transfected with WT BmGr9 plus GCaMP, GCaMP only, or select mutants with GCaMP. Data points are mean ± s.e.m from n = 6 (mutants) or 36 (WT and GCaMP only) independent experiments. c,d, SDS-PAGE (c) and NativePAGE (d) gels showing expression of BmGr9 and mutant receptors (single experiment). Molecular weight markers and position of the monomer (M) or tetramer (T) are indicated. Full gel images are presented in Supplementary Fig. 1.
Extended Data Fig. 6
Extended Data Fig. 6. Conserved gating in insect chemoreceptors.
a-c, Comparison of pore helices in BmGr9 (a), MhOr5 (b), and Orco (c) in the closed (top) and open (bottom) configurations. In the closed states, hydrophobic residues line the channel gates, which are replaced by hydrophilic residues in the open states. Intersubunit polar interactions are shown as dashed lines. PDB codes are: 7LIC (MhOr5), 7LID (MhOr5 bound to eugenol), and 6C70 (Orco). d, When bound to L-sorbose, BmGr9 maintains a closed conformation. e,f, Locations of columnar detergent/lipid-like density (wire mesh) reorganize between the closed (e, unbound) and open (f, fructose-bound) conformations of BmGr9. The aromatic bridge is only exposed to the lipid environment in the closed state. g, Detergent/lipid-like density surrounding BmGr9 when bound to L-sorbose resembles the unbound state.
Extended Data Fig. 7
Extended Data Fig. 7. Mutational analysis of BmGr9 gating.
a, Fluorescence changes of BmGr9 and mutants when stimulated with 100 mM D-fructose. Bars are mean ± s.e.m with independent replicates shown as open circles; grey bars indicate statistically significant activity compared to GCaMP only. Statistical significance was determined using one-way ANOVA followed by Dunnett’s multiple comparison tests. Q443D, Q443E, and Q445A mutation have significantly increased activity compared to wild-type (WT) BmGr9 (****P < 0.0001, ***P = 0.0006, *P = 0.012). b, D-Fructose dose-response curves of HEK293 cells transfected with WT BmGr9 plus GCaMP, GCaMP only, or select mutants with GCaMP. Data points are mean points are mean ± s.e.m from n = 6 (mutants) or 36 (WT and GCaMP only) independent experiments. WT and GCaMP-only data are the same as presented in Extended Data Fig. 6, but with y-axis adjusted. c,d, SDS-PAGE (c) and NativePAGE (d) gels showing expression of BmGr9 and mutant receptors (single experiment). Molecular weight markers and position of the monomer (M) or tetramer (T) are indicated. Full gel images are presented in Supplementary Fig. 1.
Extended Data Fig. 8
Extended Data Fig. 8. Other sweet molecules bind to BmGr9.
a, Superimposed bars of the docking scores (kcal/mol) of sweet molecules in fructose-bound BmGr9 (blue) and apo-BmGr9 (grey). Only predominant anomers in solution were selected for docking, except for D-fructose. b-e, Wavelength of the maximum tryptophan fluorescence emission spectrum of BmGr9 when titrated with D-fructose (b), L-sorbose (c), D-glucose (d), and sucrose (e). Data points are mean ± s.e.m from n = 4 independently purified samples. f-i, Lowest energy poses for docked β-D-fructopyranose (f), α-L-sorbopyranose (g), β-D-glucopyranose (h), and sucrose (i) into the fructose-bound structure of BmGr9 (blue, top) or unbound structure (white, bottom).

References

    1. Kent LB, Robertson HM. Evolution of the sugar receptors in insects. BMC Evol. Biol. 2009;9:41–20. doi: 10.1186/1471-2148-9-41. - DOI - PMC - PubMed
    1. Sato K, Tanaka K, Touhara K. Sugar-regulated cation channel formed by an insect gustatory receptor. Proc. Natl Acad. Sci. USA. 2011;108:11680–11685. doi: 10.1073/pnas.1019622108. - DOI - PMC - PubMed
    1. Miyamoto T, Slone J, Song X, Amrein H. A fructose receptor functions as a nutrient sensor in the Drosophila brain. Cell. 2012;151:1113–1125. doi: 10.1016/j.cell.2012.10.024. - DOI - PMC - PubMed
    1. Tsuneto K, et al. BmGr10 is a putative functional gustatory receptor in the myo-inositol neuron in the epipharyngeal sensillum. J. Insect Biotechnol. Sericol. 2019;88:7–15.
    1. Chyb S, Dahanukar A, Wickens A, Carlson JR. Drosophila Gr5a encodes a taste receptor tuned to trehalose. Proc. Natl Acad. Sci. USA. 2003;100:14526–14530. doi: 10.1073/pnas.2135339100. - DOI - PMC - PubMed

Publication types

MeSH terms