. 2024 Jun;20(6):1359-1382.
doi: 10.1080/15548627.2024.2309904. Epub 2024 Mar 6.

CLU (clusterin) and PPARGC1A/PGC1α coordinately control mitophagy and mitochondrial biogenesis for oral cancer cell survival

Affiliations

CLU (clusterin) and PPARGC1A/PGC1α coordinately control mitophagy and mitochondrial biogenesis for oral cancer cell survival

Prakash P Praharaj et al. Autophagy. 2024 Jun.

Abstract

Mitophagy involves the selective elimination of defective mitochondria during chemotherapeutic stress to maintain mitochondrial homeostasis and sustain cancer growth. Here, we showed that CLU (clusterin) is localized to mitochondria to induce mitophagy controlling mitochondrial damage in oral cancer cells. Moreover, overexpression and knockdown of CLU establish its mitophagy-specific role, where CLU acts as an adaptor protein that coordinately interacts with BAX and LC3 recruiting autophagic machinery around damaged mitochondria in response to cisplatin treatment. Interestingly, CLU triggers class III phosphatidylinositol 3-kinase (PtdIns3K) activity around damaged mitochondria, and inhibition of mitophagic flux causes the accumulation of excessive mitophagosomes resulting in reactive oxygen species (ROS)-dependent apoptosis during cisplatin treatment in oral cancer cells. In parallel, we determined that PPARGC1A/PGC1α (PPARG coactivator 1 alpha) activates mitochondrial biogenesis during CLU-induced mitophagy to maintain the mitochondrial pool. Intriguingly, PPARGC1A inhibition through small interfering RNA (siPPARGC1A) and pharmacological inhibitor (SR-18292) treatment counteracts CLU-dependent cytoprotection leading to mitophagy-associated cell death. Furthermore, co-treatment of SR-18292 with cisplatin synergistically suppresses tumor growth in oral cancer xenograft models. In conclusion, CLU and PPARGC1A are essential for sustained cancer cell growth by activating mitophagy and mitochondrial biogenesis, respectively, and their inhibition could provide better therapeutic benefits against oral cancer.

Keywords: Clusterin; PPARGC1A/PGC1α; mitochondrial biogenesis; mitophagy; mitophagy-associated cell death.


Conflict of interest statement

No potential conflict of interest was reported by the author(s).

Figures
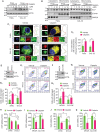
Figure 1.
Figure 1.
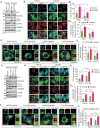
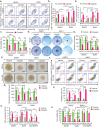
CLU maintains mitochondrial functionality through its mitochondrial translocation during cisplatin-induced membrane depolarization. (A-D) FaDu and CAL-33 cells were treated with different concentrations of cisplatin (1, 5, and 10 µM), followed by (A) western blot analysis to monitor CLU expression, (B) fractionation analysis to determine the subcellular distribution of CLU. (Ci) Representative confocal microscopy images of FaDu and CAL-33 cells treated with cisplatin (10 µM; 24 h) followed by immunofluorescence analysis monitoring CLU (red) and TOMM20 (green). DAPI (blue) is used to stain the nucleus. Scale bars: 25 µm. (Cii) Quantification of colocalization (%) represented as Pearson’s co-efficient value calculated from images of each condition of three independent experiments using the JACoP plugin of ImageJ. (D, F) Western blot analysis for CLU expression in CLU overexpressed and knockdown cells (Ei, Gi) flow cytometry analysis using MTG and MTR shows mitochondrial damage in (Ei) CLU-OE and (Gi) CLU KD cells treated with cisplatin (10 µM; 24 h). (Eii, Gii) Quantification shows the cells with damaged mitochondria (%) in CLU KD and CLU-OE cells treated with cisplatin. (H-I) OCR analysis in CLU KD and CLU-OE cells treated with cisplatin (10 µM; 24 h). (J-K) MTT assay representing cell viability in CLU KD and CLU-OE cells treated with cisplatin. Data were normalized to the untreated groups or shNC or MOCK cells (mean ± S.D., n = 3). *p < 0.05, **p < 0.01, and ***p < 0.001.
Figure 2.
Figure 2.
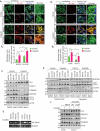
CLU regulates mitophagy status to eliminate cisplatin-induced damaged mitochondria in oral cancer cells. (A-C) CAL-33 cells expressing shNC and shCLU treated with cisplatin followed by western blotting analysis showing (A) the change in expression of SQSTM1, TOMM20, COX4I1, and LC3 for mitophagy status evaluation, (Bi) confocal microscopy-based colocalization analysis for CLU (cyan), LC3 (green; representing autophagosomes) and TOMM20 (red; representing mitochondria), and (Ci) for LysoTracker red (LTR; representing lysosomes) and MitoTracker green (MTG; representing mitochondria). (Bii) Quantification showing the number of LC3 puncta per cell in shNC or shCLU cells treated with cisplatin (10 µM; 24 h) and (Biii, Cii) quantification showing colocalization (%) defined as Pearson’s co-efficient value calculated from images of each condition of three independent experiments using the JACoP plugin of ImageJ. (D-F) FaDu cells stably expressing a construct encoding CLU and MOCK (empty vector) and treated with cisplatin followed by western blotting analysis showing (D) the change in expression of SQSTM1, TOMM20, COX4I1, and LC3 for mitophagy status evaluation, (Ei) confocal microscopy-based colocalization analysis for CLU (cyan), LC3 (green; representing autophagosomes) and TOMM20 (red; representing mitochondria), and (Fi) for LysoTracker Red (LTR; representing lysosomes) and MitoTracker Green (MTG; representing mitochondria). (Eii) Quantification showing the number of LC3 puncta per cells in MOCK or CLU-OE cells treated with cisplatin (10 µM; 24 h) and (Eiii, Fii) quantification of colocalization (%) defined as Pearson’s co-efficient value calculated from images of each condition of three independent experiments using the JACoP plugin of ImageJ. Data were normalized to the shNC or MOCK cells or DMSO (0.1%)-treated cells (mean ± S.D., n = 5). *p < 0.05, and **p < 0.01.
Figure 3.
Figure 3.
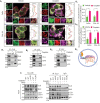
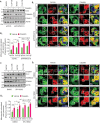
The LIR motif is essential for CLU-mediated clearance of mitochondrial proteins during cisplatin treatment. (Ai, Bi) Representative confocal microscopy images of cells with gain and loss of function of CLU stably expressing mKeima-red-Mito7, followed by cisplatin treatment (10 µM; 24 h). (Aii, Bii) ImageJ-based quantification showing the mitophagy index (red:green ratio) of respective conditions. All the images used for quantification were from three independent experiments. Scale bars: 10 µm. (C) Western blotting analysis showing the mitophagic flux in CLU-OE cells treated with cisplatin combined with BafA1 (mitophagic flux inhibitor). (D) Western blotting analysis of the subcellular fraction isolated from CLU-OE cells treated with cisplatin combined with BafA1. (E) Representative gel image showing the MT-RNR1 level in CLU-OE or shCLU cells treated with cisplatin (10 µM; 24 h). (F) Western blotting analysis showing the impaired mitophagy status in CLU-deficient cells expressing MOCK, wild-type, and mLIR variant of CLU followed by cisplatin treatment (10 µM; 24 h). Data were normalized to the MOCK cells treated with DMSO (0.1%) (mean ± S.D., n = 3). *p < 0.05, **p < 0.01, and ***p < 0.001.
Figure 4.
Figure 4.
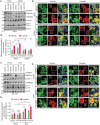
CLU interacts with conformation-altered BAX to remove cisplatin-induced dysfunctional mitochondria. (Ai) Confocal microscopy-based colocalization analysis of FaDu and CAL-33 cells treated with cisplatin followed by staining with antibodies against LC3 (green), CLU (red), and BAX (6A7) (magenta). Scale bars: 25 µm. (Aii-iii) Quantification of colocalization (%) represented as Pearson’s co-efficient value calculated from images of each condition of three independent experiments using the JACoP plugin of ImageJ. (B) Co-immunoprecipitation assay of cisplatin-treated CAL-33 cells using (Bi) anti-CLU (Bii), anti-LC3 and (Biii), anti-BAX (6A7) antibodies and detection of CLU, LC3 and BAX in each condition. (Biv) Schematic showing the proposed trimeric complex on a damaged mitochondrion within a mitophagosome. (C) Immunoprecipitation assay on FaDu-CLU cells expressing different variants of CLU (wild-type or mLIR) followed by treatment with cisplatin in combination with BAX chelator (50 nm; 3 h) using anti-CLU antibody and detection of CLU, LC3 and BAX in this condition.
Figure 5.
Figure 5.
Gain and loss of function of BAX regulate CLU-mediated mitophagy during cisplatin treatment. (A, C) Western blot analysis in CLU-OE FaDu and DU 145 cells with loss of function (transfected with shNC, shBAX) or gain of function (transfected with vector, BAX) of BAX followed by cisplatin treatment, respectively. (Bi, Di) Confocal microscopy-based live-cell imaging of cisplatin-treated CLU-OE FaDu and DU 145 cells with loss of function (transfected with shNC, shBAX) and gain of function (transfected with vector, BAX) of BAX followed by labelling with LTR (red; representing lysosomes) and MTG (green; representing mitochondria). Scale bars: 25 µm. (Bii, Dii) Quantification showing colocalization (%) defined as Pearson’s co-efficient value calculated from images of each condition of three independent experiments using the JACoP plugin of ImageJ. Data were normalized to the MOCK or shNC cells (mean ± S.D., n = 3). *p < 0.05, **p < 0.01, and ***p < 0.001.
Figure 6.
Figure 6.
CLU promotes ATG16L1 and ATG13 puncta accumulation near mitochondria during cisplatin treatment in oral cancer cells. (Ai) Confocal microscopy-based colocalization analysis in CLU-OE and CLU KD cells transiently expressing an NCF4/p40(phox) PX-EGFP plasmid followed by cisplatin (10 µM; 24 h) treatment and labeled with MitoTrackerTM Deep Red (MTDR; representing mitochondria). The magnified image represents the boxed area. (Aii) Quantification of the number of cells with perinuclear mitochondrial clusters in contact with NCF4 PX-EGFP hotspots denoted as a percentage of the total number of mitochondria-containing cells. All images from three independent experiments were randomly taken for each condition and analyzed through ImageJ software. Scale bars: 25 µm. (B-E) Representative confocal microscopy-based colocalization analysis in CLU-OE and CLU KD cells treated with cisplatin (10 µM; 24 h) followed by staining with (B, C) CLU (cyan), ATG13 (green), and TOMM20 (red), (D, E) CLU (cyan), ATG16L1 (green), and TOMM20 (red). The magnified image represents the boxed area. All images represent three independent experiments and were randomly taken for each condition and analyzed through ImageJ software. Scale bars: 25 µm.
Figure 7.
Figure 7.
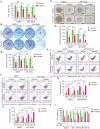
Inhibition of mitophagy flux triggers mtROS-dependent apoptosis in oral cancer cells. (A-F) FaDu-MOCK or FaDu-CLU cells treated with cisplatin (10 µM; 24 h) in combination with BafA1 (50 nM; 3 h). (Ai-ii) Flow cytometry analysis to assess mitochondrial dysfunction using MitoTracker Green (MTG) and MitoTracker Red CMXRos (MTR) (mean ± S.D., n = 3) followed by its quantification. (B) Flow cytometry analysis to quantify the mitochondrial superoxide levels, as indicated by MitoSOX fluorescence (mean ± S.D., n = 3). MFI, mean fluorescence intensity. (C) Cell viability using MTT assay (mean ± S.D., n = 5). (Di-ii) Clone-forming ability, and its quantification (mean ± S.D., n = 3). (Ei) Representative images of orospheres formed after MOCK or CLU-OE cells were treated with vehicle control, cisplatin and BafA1, followed by culturing for 7 days. Scale bar: 200 μm. (Eii) Quantifications of orosphere diameter numbers formed after treatment (mean ± S.D., n = 25). **p < 0.01, and ***p < 0.001. (Fi-ii) Flow cytometry analysis to access apoptosis using ANXA5-PI staining, followed by its quantification (mean ± S.D., n = 3). (G) Flow cytometry analysis to quantify the mitochondrial superoxide levels, as indicated by MitoSOX fluorescence in MitoTEMPO (mitochondrial superoxide mimetic)-pretreated FaDu-MOCK or FaDu-CLU cells treated with cisplatin (10 µM; 24 h) in combination with BafA1 (50 nM; 3 h), (mean ± S.D., n = 3). (H) Cell viability assay estimating the growth rate in FaDu-MOCK or FaDu-CLU cells treated with cisplatin+BafA1 in the presence or absence of mitoTEMPO. Data were normalized to the untreated cells of each group (mean ± S.D., n = 5). *p < 0.05, **p < 0.01, and ***p < 0.001.
Figure 8.
Figure 8.
Cisplatin triggers PPARGC1A-mediated mitochondrial biogenesis to maintain mitochondrial content. (A-B) Western blotting analysis showing the expression of PPARGC1A, PPARGC1B, and PPRC1 in both FaDu and CAL-33 cells treated with (A) various concentrations of cisplatin (1, 5, and 10 μM; 24 h), (B) for different time-points (0, 6, 12, and 24 h). (Ci, Ei) Flow cytometry analysis to assess mitochondrial dysfunction using MitoTracker Green (MTG) and MitoTracker Red CMXRos (MTR) in PPARGC1A-deficient (siPPARGC1A and SR-18292 treated) and control (siCNTL and DMSO treated) cells treated with different concentrations of cisplatin (1, 5, and 10 μM; 24 h). (Cii, Eii) Quantification showing the cells with damaged mitochondria (%) (mean ± S.D., n = 3). (D, F) ATP measurement in PPARGC1A-deficient (siPPARGC1A and SR-18292 treated) and control (siCNTL and DMSO treated) cells treated with different concentrations of cisplatin (1, 5, and 10 μM; 24 h). (G, H) Western blotting analysis showing the expression of TOMM20, and COX4I1 in PPARGC1A-deficient (siPPARGC1A and SR-18292 treated) and control (siCNTL and DMSO treated) cells treated with different concentrations of cisplatin (1, 5, and 10 μM; 24 h) (mean ± S.D., n = 3).
Figure 9.
Figure 9.
Inhibition of PPARGC1A caused excessive loss of mitochondrial mass through exaggerating CLU-mediated mitophagy. PPARGC1A-deficient (siPPARGC1A and SR-18292 treated) and control (siCNTL and DMSO treated) MOCK or CLU-OE cells were treated with cisplatin (10 μM; 24 h), followed by (A, C) western blotting analysis showing the expression of TOMM20, and COX4I1. (Bi, Di) Confocal microscopy-based colocalization analysis for LysoTracker Red (LTR; representing lysosomes) and MitoTracker Green (MTG; representing mitochondria). (Bii, Dii) Quantification represents the colocalization of MTG with LTR from the confocal microscopy-based live-cell image analysis using Pearson’s co-efficient value calculated from images of each condition taken from three independent experiments using the JACoP plugin of ImageJ. Scale bar: 25 μm. Error bars: S.D. *p < 0.05, **p < 0.01.
Figure 10.
Figure 10.
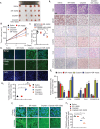
SR-18292 synergistically improves cisplatin-mediated cytotoxicity in oral cancer cells. (A-E) PPARGC1A-deficient and control (siCNTL and DMSO treated) MOCK or CLU-OE cells were treated with cisplatin (10 μM; 24 h), followed by (A) cell viability measurement using an MTT assay to estimate the growth rate, and (Bi-ii) clone-forming ability and its quantification (mean ± S.D., n = 3). (Ci, Ei) Flow cytometry analysis to access apoptosis using ANXA5-PI staining, followed by its quantification (mean ± S.D., n = 3), and (Cii, Eii) quantification showing the apoptosis rate in respective conditions (mean ± S.D., n = 3). (Di-ii) Representative images of orospheres formed after MOCK or CLU-OE cells were treated with vehicle control, or cisplatin alone or in combination with SR-18292, followed by culturing for 7 days. Scale bar: 200 μm. (Dii) Quantifications of orospheres diameters formed after treatment (mean ± S.D., n = 25). *p < 0.05, **p < 0.01, and ***p < 0.001. (F) Cell viability assay to monitor PPARGC1A-deficient and control (DMSO treated) MOCK or CLU-OE cells treated with cisplatin (10 μM; 24 h), in combination with wortmannin (50 nM) or caspase inhibitor (CI; 50 nM). Data were normalized to the untreated cells of each group (mean ± S.D., n = 5). **p < 0.01, and ***p < 0.001.
Figure 11.
Figure 11.
Cisplatin activates mitophagy-associated cell death in the absence of mitochondrial biogenesis in vivo. (A) Tumor volume was monitored every other day during treatments: vehicle (DMSO), SR-18292 (20 mg/kg), cisplatin (1 mg/kg), or SR-18292 plus cisplatin for 14 days. At the end of the treatment period, the tumors were taken out and photographed. (B) The graph shows changes in the tumor volume. The data represented are the means ± S.D. (n = 5). (C) The size and weight of the dissected tumors are shown. (Di-ii) Representative images of tumor sections that were analyzed by TUNEL assay. DAPI is used to stain nuclei. Scale bar: 50 μm. TUNEL-positive cells were quantified by counting nuclei in five randomly chosen fields. (Ei) The tumor sections were subjected to H&E staining and immunohistochemistry staining for MKI67, LC3, CASP3, CLU, and PPARGC1A, scale bar: 100 μm. (Eii) Quantification shows the expression of the indicated proteins. (Fi-ii) Representative microscopy images of tumor sections immunostained with TOMM20. DAPI is used to stain nuclei. Scale bar: 50 μm. All images were taken from a randomly chosen field. *p < 0.05, #p < 0.01.
Figure 12.
Figure 12.
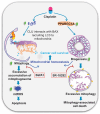
Proposed mechanism by which CLU and PPARGC1A coordinately regulate mitochondrial homeostasis through activating mitophagy and mitochondrial biogenesis, respectively. CLU interacts with activated BAX and LC3 recruiting a mitophagosome around damaged mitochondria to enhance mitophagic flux during chemotherapeutic stress. Moreover, chemotherapeutic stress also activates PPARGC1A-mediated mitochondrial biogenesis in oral cancer cells. Inhibition of CLU-mediated mitophagy leads to the accumulation of damaged mitochondria, generating excessive mitochondrial superoxide leading to apoptosis. Similarly, targeted inhibition of PPARGC1A-mediated mitochondrial biogenesis triggers excessive mitophagy, sensitizing oral cancer cells toward mitophagy-associated cell death.

References

    1. Siegel RL, Miller KD, Jemal A.. Cancer statistics, 2019. CA Cancer J Clin. 2019;69(1):7–34. doi: 10.3322/caac.21551 - DOI - PubMed
    1. Mansoori B, Mohammadi A, Davudian S, et al. The different mechanisms of cancer drug resistance: a brief review. Adv Pharm Bull. 2017;7(3):339–348. doi: 10.15171/apb.2017.041 - DOI - PMC - PubMed
    1. Tang L, Wei F, Wu Y, et al. Role of metabolism in cancer cell radioresistance and radiosensitization methods. J Exp Clin Cancer Res. 2018;37(1):87. doi: 10.1186/s13046-018-0758-7 - DOI - PMC - PubMed
    1. Praharaj PP, Naik PP, Panigrahi DP, et al. Intricate role of mitochondrial lipid in mitophagy and mitochondrial apoptosis: its implication in cancer therapeutics. Cell Mol Life Sci. 2019;76(9):1641–1652. doi: 10.1007/s00018-018-2990-x - DOI - PMC - PubMed
    1. Onishi M, Yamano K, Sato M, et al. Molecular mechanisms and physiological functions of mitophagy. EMBO J. 2021;40(3):e104705. doi: 10.15252/embj.2020104705 - DOI - PMC - PubMed

Publication types

MeSH terms

Substances