. 2024 Mar 6;15(3):192.
doi: 10.1038/s41419-024-06566-0.

The RNA m6A reader IGF2BP3 regulates NFAT1/IRF1 axis-mediated anti-tumor activity in gastric cancer

Affiliations

The RNA m6A reader IGF2BP3 regulates NFAT1/IRF1 axis-mediated anti-tumor activity in gastric cancer

Lichen Ge et al. Cell Death Dis. .

Abstract

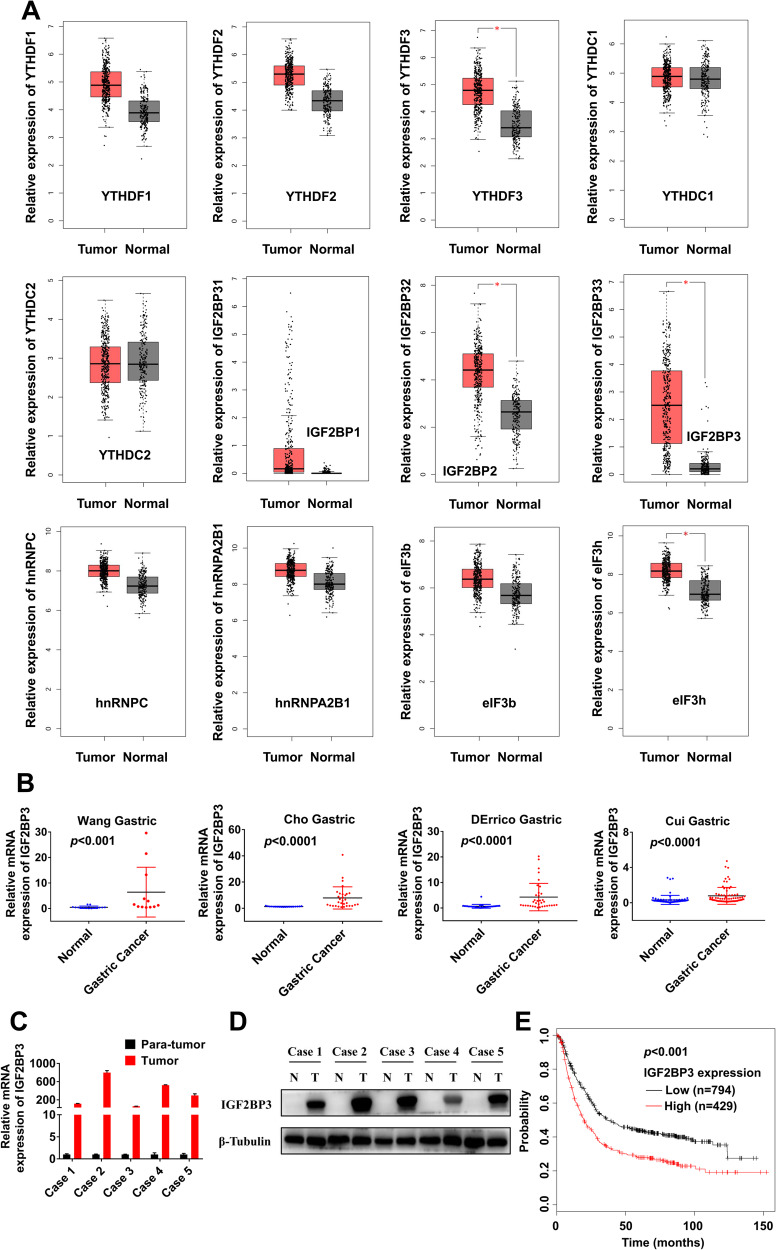
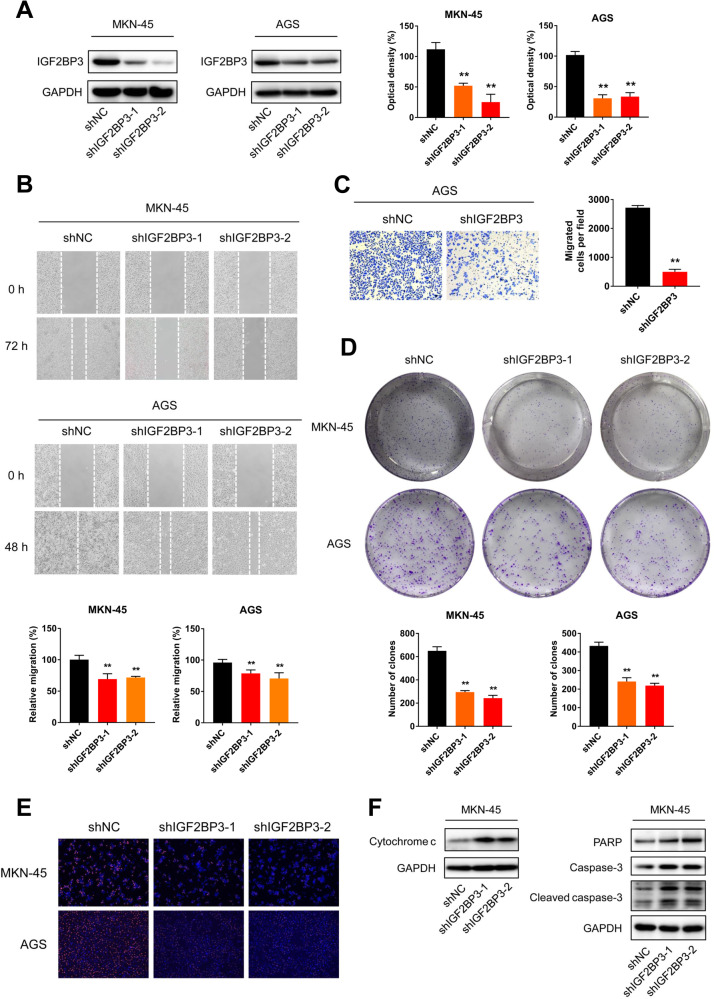
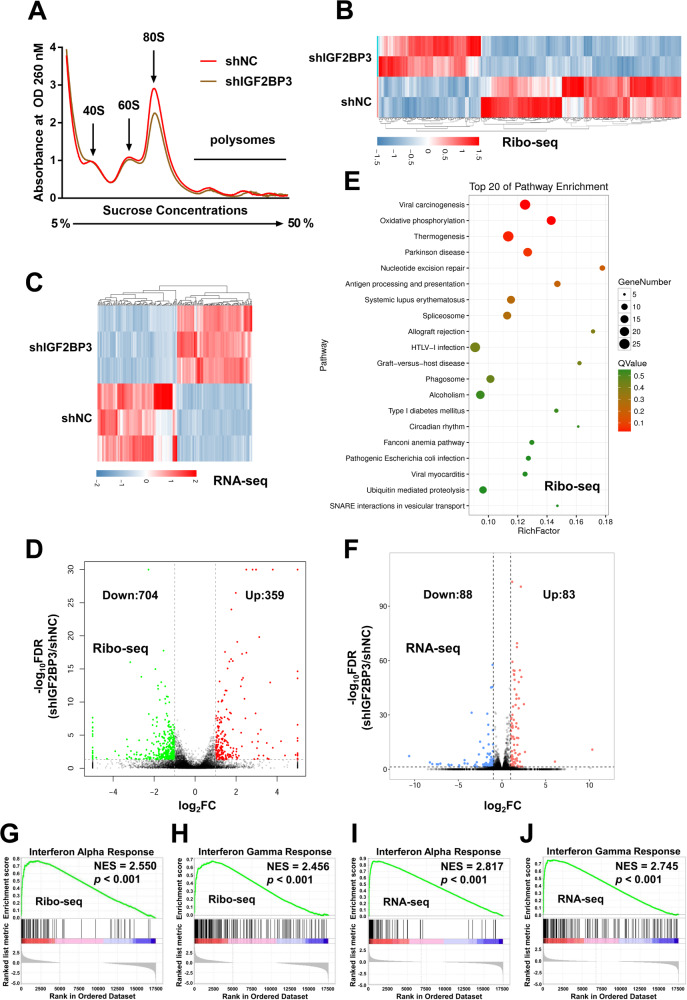
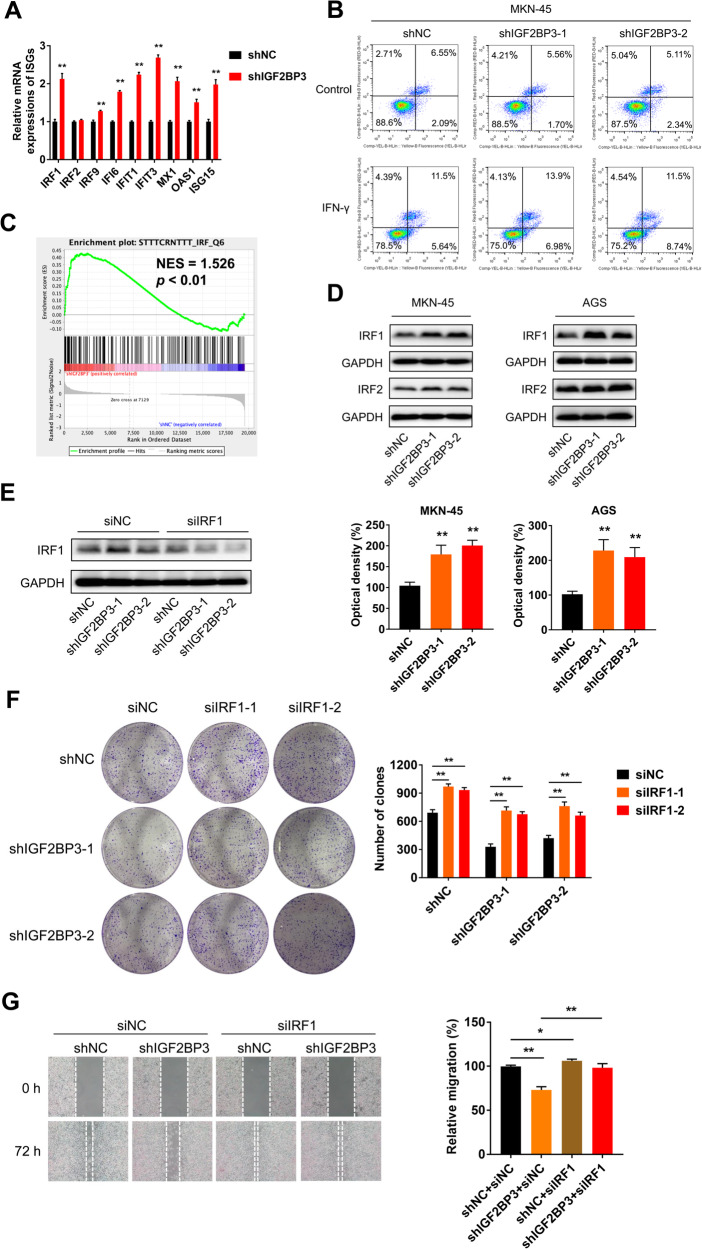
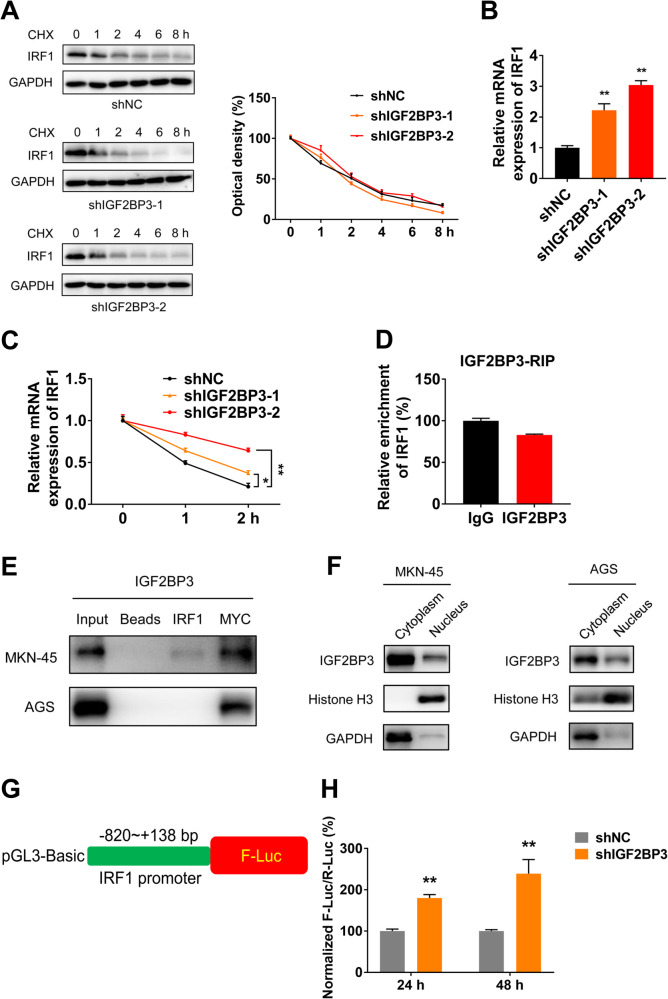
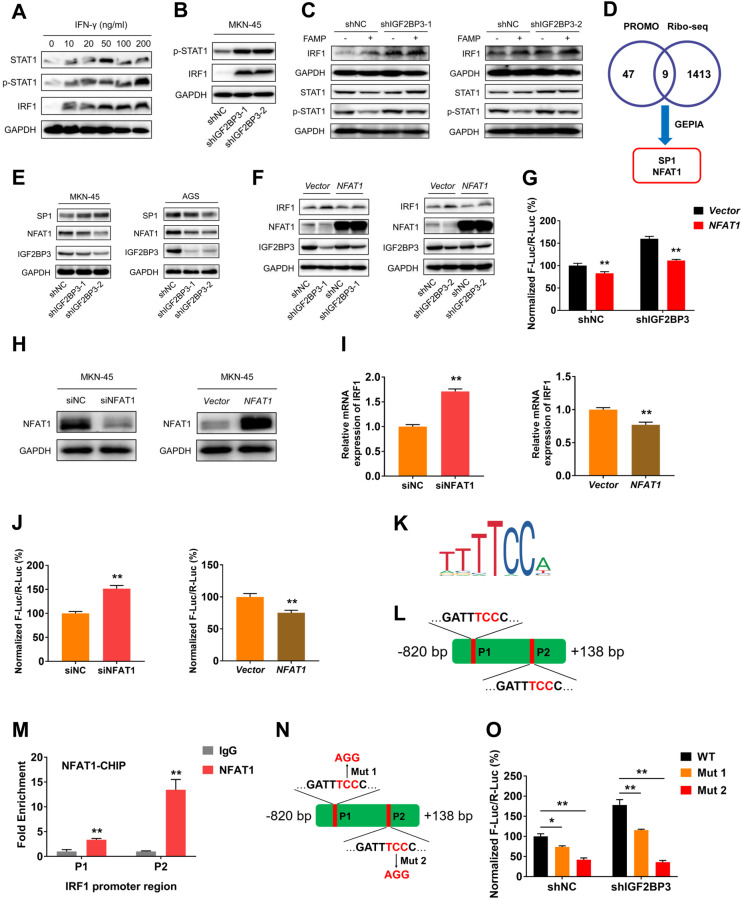
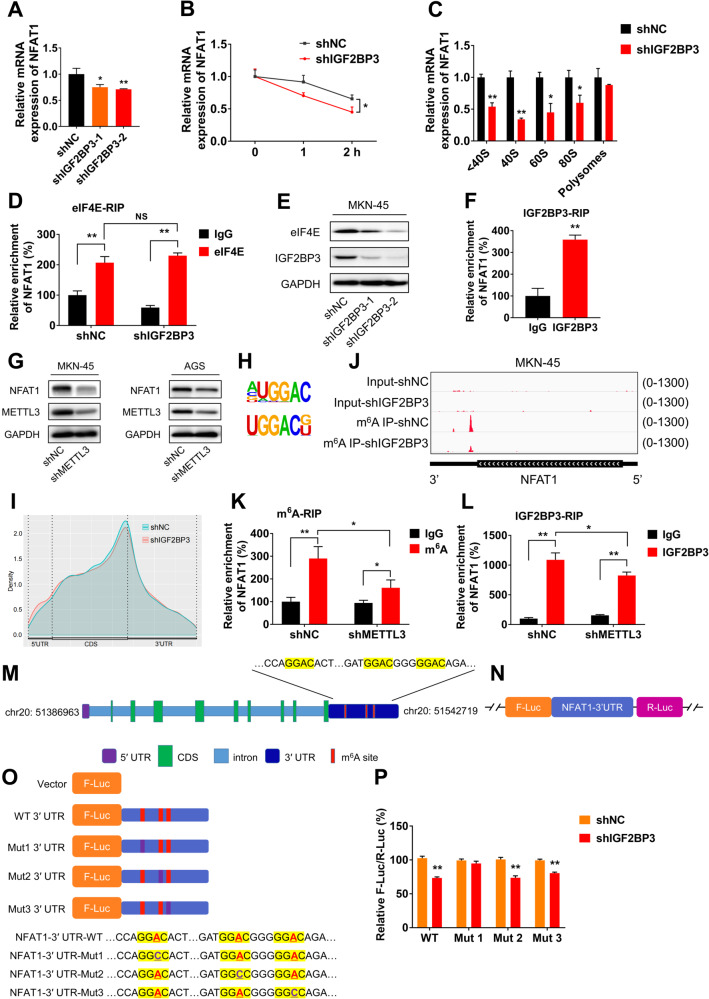
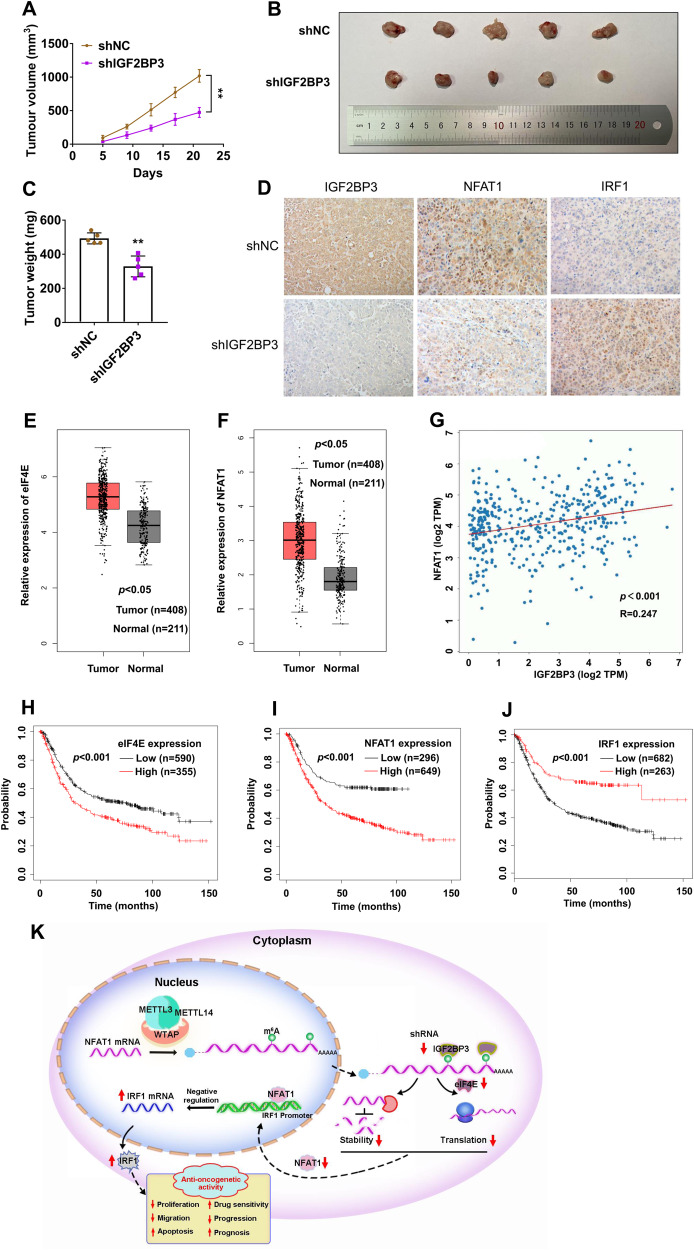
N6-methyladenosine (m6A) and its associated reader protein insulin like growth factor 2 mRNA binding protein 3 (IGF2BP3) are involved in tumor initiation and progression via regulating RNA metabolism. This study aims to investigate the biological function and clinical significance of IGF2BP3 in gastric cancer (GC). The clinical significance of IGF2BP3 was evaluated using tumor related databases and clinical tissues. The biological role and molecular mechanism of IGF2BP3 in GC progression were investigated by multi-omics analysis including Ribosome sequence (Ribo-seq), RNA sequence (RNA-seq) and m6A sequence (m6A-seq) combined with gain- and loss- of function experiments. IGF2BP3 expression is significantly elevated in GC tissues and associated with poor prognosis of GC patients. Knockdown of IGF2BP3 significantly weakens the migration and clonogenic ability, promotes the apoptosis, inhibits translation, and suppresses in vitro growth and progression of GC cells. Mechanistically, IGF2BP3 regulates the mRNA stability and translation of the nuclear factor of activated T cells 1(NFAT1) in a m6A dependent manner. Then NFAT1 induced by IGF2BP3 acts as a transcription factor (TF) to negatively regulates the promoter activities of interferon regulatory factor 1 (IRF1) to inhibit its expression. Inhibition of IGF2BP3-induced expression of IRF1 activates interferon (IFN) signaling pathway and then exerts its anti-tumor effect. Elevated IGF2BP3 promotes in vivo and in vitro GC progression via regulation of NFAT1/IRF1 pathways. Targeted inhibition of IGF2BP3 might be a potential therapeutic approach for GC treatment.


Conflict of interest statement

The authors declare that they have no competing interests.

Figures

Fig. 1
Fig. 1. Elevated expression of m6A reader IGF2BP3 is associated with poor prognosis of patients with GC.
A The mRNA expressions of YTHDF1, YTHDF2, YTHDF3, YTHDC1, YTHDC2, IGF2BP1, IGF2BP2, IGF2BP3, hnRNPC, hnRNPA2B1, eIF3b and eIF3h in GC tissues (408 cases) compared with gastric normal tissues (211 cases) in the GEPIA database. B The relative mRNA expressions of IGF2BP3 in GC tissues compared with gastric normal tissues in four independent datasets from the Oncomine database. C, D The relative mRNA (C) and protein (D) expressions of IGF2BP3 in tumor and para-tumor tissues of GC patients were measured by RT-qPCR and western blot analysis respectively. E Correlation between expression of IGF2BP3 and OS in GC patients analyzed by the Kaplan-Meier Plotter.
Fig. 2
Fig. 2. Inhibition of IGF2BP3 suppresses GC cell growth and migration in vitro.
A The expressions of IGF2BP3 in MKN-45 and AGS cells infected with two independent shRNAs targeting IGF2BP3 or a control shRNA were measured by western blot analysis (left) and quantitatively analyzed (right), respectively. B Wound healing of shNC and shIGF2BP3 MKN-45 and AGS cells were recorded (up) and quantitatively analyzed (down), respectively. C Migration and invasion of shNC and shIGF2BP3 AGS cells were recorded (left) and quantitatively analyzed (right), respectively. D Colony formation of shNC and shIGF2BP3 MKN-45 and AGS cells were recorded (up) and quantitatively analyzed (down), respectively. E Cell proliferation of shNC and shIGF2BP3 MKN-45 and AGS cells were detected using EdU staining, respectively. F The expressions of Cytochrome c, PARP, Caspase-3 and Cleaved caspase-3 in shNC and shIGF2BP3 MKN-45 cells were measured by western blot analysis.
Fig. 3
Fig. 3. Identification of the targets of IGF2BP3 in GC cells by Ribo-seq and RNA-seq.
A Polysome profiling of shNC and shIGF2BP3 MKN-45 cells were analyzed. B, C Differentially expressed genes (DEGs, |fold change| ≥ 2 and p < 0.05) between shNC (control) and shIGF2BP3 MKN-45 cells were identified by Ribo-seq (B) and RNA-seq (C) were presented in heatmaps, respectively. D, E DEGs (|fold change| ≥ 2 and p < 0.05) between shNC and shIGF2BP3 MKN-45 cells identified by Ribo-seq were presented in number statistics (D) and GO enrichment analysis (E). F DEGs (|fold change| ≥ 2 and p < 0.05) between shNC and shIGF2BP3 MKN-45 cells identified by RNA-seq were presented in number statistics analysis. G, H GSEA for Interferon Alpha/Gamma Response gene sets between shNC and shIGF2BP3 MKN-45 cells were identified by Ribo-seq. I, J GSEA for Interferon Alpha/Gamma Response gene sets between shNC and shIGF2BP3 MKN-45 cells were identified by RNA-seq.
Fig. 4
Fig. 4. IRF1 is involved in IGF2BP3-regulated cell growth and migration in GC cells.
A The relative mRNA expressions of IRF1, IRF2, IRF9, IFI6, IFIT1, IFIT3, MX1, OAS1 and ISG15 in shNC and shIGF2BP3 MKN-45 cells were investigated by qRT-PCR analysis. B Cell apoptosis of shNC and shIGF2BP3 MKN-45 cells after treated with IFN-γ (50 ng/mL) for 48 h were measured by flow cytometric analysis, respectively. C Gene expressions in STTTCRNTTT_IRF_Q6 set of shNC and shIGF2BP3 MKN-45 cells identified by Ribo-seq were performed with GSEA. D The expressions of IRF1 and IRF2 in shNC and shIGF2BP3 MKN-45 and AGS cells were measured by western blot analysis (up) and quantitatively analyzed (down), respectively. E The expressions of IRF1 in shNC and shIGF2BP3 MKN-45 cells after transfected with siRNA targeting IRF1 (si-IRF1_001) or a negative control siRNA (siNC) for 48 h were measured by western blot analysis, respectively. F Colony formation of shNC and shIGF2BP3 MKN-45 cells after transfected with siIRF1(si-IRF1_001, si-IRF1_002) or siNC for 48 h were recorded (left) and quantitatively analyzed (right), respectively. G Wound healing of shNC and shIGF2BP3 MKN-45 cells after transfected with siIRF1 (si-IRF1_001) or siNC for 48 h were recorded (left) and quantitatively analyzed (right), respectively.
Fig. 5
Fig. 5. IGF2BP3 regulates the transcription and mRNA stability of IRF1.
A The protein expressions of IRF1 in shNC and shIGF2BP3 MKN-45 cells after treated with CHX (10 μg/mL) for indicated times were examined by western blot analysis (left) and quantitatively analyzed (right). B The relative mRNA expressions of IRF1 in shNC and shIGF2BP3 MKN-45 cells were examined by RT-qPCR analysis. C The relative mRNA expressions of IRF1 in shNC and shIGF2BP3 MKN-45 cells after treated with ACTD (2 μM) for indicated times were examined by RT-qPCR analysis. D IGF2BP3 RIP-qPCR analysis of IRF1 mRNA in MKN-45 cells. E The binding capacity between IRF1 mRNA and IGF2BP3 protein in MKN-45 and AGS cells were examined by RNA pulldown and western blot analysis, respectively. MYC mRNA as the classical target of IGF2BP3 [40] was used as positive control. F Protein expressions of IGF2BP3 in cytoplasm and nucleus of MKN-45 and AGS cells were measured by subcellular fractionation and western blot analysis, respectively. The GAPDH and Histone H3 were used as cytoplasmic control and nuclear control respectively. G Schematic representation of pGL3-Basic-IRF1 promoter reporter plasmid to investigate the role of IGF2BP3 on IRF1 promoter activities. H shNC and shIGF2BP3 MKN-45 cells were co-transfected with pGL3-Basic-IRF1 promoter reporter plasmid and pRL-TK plasmid for 24 h or 48 h. The promoter activities were determined as a relative signal of F-luc divided by R-luc.
Fig. 6
Fig. 6. IGF2BP3 regulates IRF1 via its upstream transcription factor NFAT1.
A The protein expressions of IRF1, p-STAT1 and STAT1 in MKN-45 cells after treated with indicated dose of IFN-γ for 48 h were examined by western blot analysis. B The protein expressions of IRF1 and p-STAT1 in shNC and shIGF2BP3 MKN-45 cells were examined by western blot analysis. C The protein expressions of IRF1, p-STAT1 and STAT1 in shNC and shIGF2BP3 MKN-45 cells after treated with FAMP for 24 h were examined by western blot analysis. D Overlapping genes of TFs of IRF1 predicted by the PROMO (Maximun matrix dissimilarity rate: 10%), downregulation (|fold change| ≥ 1.5) in shIGF2BP3 MKN-45 cells compared with shNC MKN-45 cells based on Ribo-seq data and upregulation in GC tissues based on the GEPIA were identified; E The protein expressions of SP1 and NFAT1 in shNC and shIGF2BP3 MKN-45 and AGS cells were examined by western blot analysis, respectively. F The expressions of IRF1 in shNC and shIGF2BP3 MKN-45 cells after transfected over expression plasmid targeting NFAT1 or vector control for 48 h were measured by western blot analysis, respectively. G shNC and shIGF2BP3 MKN-45 cells were co-transfected with NFAT1 over expression or vector control plasmid, pGL3-Basic-IRF1 promoter reporter plasmid and pRL-TK plasmid for 24 h. The promoter activities were determined as a relative signal of F-luc divided by R-luc. H Protein expressions of NFAT1 in MKN-45 cells were measured by western blot analysis after transfected siRNA or over expression plasmid targeting NFAT1 for 48 h, respectively. I After transfected siRNA or over expression plasmid targeting NFAT1 for 48 h, the relative mRNA expressions of IRF1 in MKN-45 cells were investigated by qRT-PCR analysis. J After transfected siRNA or over expression plasmid targeting NFAT1 for 24 h, MKN-45 cells were co-transfected with pGL3-Basic-IRF1 promoter reporter plasmid and pRL-TK plasmid for 24 h. The promoter activities were determined as a relative signal of F-luc divided by R-luc. K The consensus sequences of TF binding sites in IRF1 promoter region were predicted by motif analysis from the JASPAR database. L The specific TF binding sites in IRF1 promoter region were predicted. M The binding between NFAT1 protein and specific TF binding sites in IRF1 promoter region in MKN-45 cells were measured by ChIP-qPCR assay. N Schematic representation of mutated (TCC to AGG) promoter region of pGL3-Basic-IRF1 promoter reporter plasmid to investigate the role of specific TF binding sites on IRF1 promoter activities. O shNC and shIGF2BP3 MKN-45 cells were co-transfected with wild-type pGL3-Basic-IRF1 promoter reporter plasmid or mutated (TCC to AGG) promoter plasmid and pRL-TK plasmid for 24 h. The promoter activities were determined as a relative signal of F-luc divided by R-luc.
Fig. 7
Fig. 7. IGF2BP3 regulates NFAT1 stabilization and translation in a m6A-dependent manner.
A The relative mRNA expressions of NFAT1 in shNC and shIGF2BP3 MKN-45 cells were investigated by qRT-PCR analysis. B The relative mRNA expressions of NFAT1 in shNC and shIGF2BP3 MKN-45 cells after treated with ACTD (2 μM) for indicated times were examined by RT-qPCR analysis. C The relative mRNA expressions of NFAT1 in non-ribosome portion (< 40S), 40S, 60S, 80S, and polysomes of shNC and shIGF2BP3 MKN-45 cells were examined by RT-qPCR analysis. D The binding between eIF4E protein and NFAT1 mRNA in shNC and shIGF2BP3 MKN-45 cells were measured by RIP-qPCR assay. E The expressions of eIF4E in shNC and shIGF2BP3 MKN-45 cells were measured by western blot analysis. F The binding between IGF2BP3 protein and NFAT1 mRNA in MKN-45 cells were measured by RIP-qPCR assay. G The expressions of NFAT1 in shNC and shMETTL3 MKN-45 and AGS cells were measured by western blot analysis, respectively. H Predominant consensus motifs GGAC were identified in shNC (up) and shIGF2BP3 (down) MKN-45 cells based on m6A-seq data. I Distribution of m6A peaks across mRNA transcripts in shNC and shIGF2BP3 MKN-45 cells. J The m6A signal peaks enriched in the 3’UTR of NFAT1 mRNA were identified by m6A-seq data. K The m6A level of NFAT1 mRNA in shNC and shMETTL3 MKN-45 cells were measured by m6A-RIP-qPCR assay. L The binding between IGF2BP3 protein and NFAT1 mRNA in shNC and shMETTL3 MKN-45 cells were measured by RIP-qPCR assay. M Schematic representation of potential m6A sites (GGAC) in NFAT1 mRNA. N Schematic representation of pmirGLO-NFAT1-3’UTR vector. O Schematic representation of mutation (GGAC to GGCC) in 3’UTR to investigate the roles of m6A on NFAT1 expression. P shNC and shIGF2BP3 MKN-45 cells were transfected with pmirGLO-NFAT1-3’UTR-WT or pmirGLO-NFAT1-3’UTR-Mut1/2/3 reporter for 48 h, the relative luciferase activities of F-Luc/R-Luc were measured.
Fig. 8
Fig. 8. IGF2BP3/NFAT1/IRF1 axis regulate in vivo GC progression.
A The shNC and shIGF2BP3 MKN-45 cells were subcutaneously injected into the nude mice (n = 5). Tumor volume was monitored every five days, and tumor growth curves were generated. B, C Images (B) and volumes (C) of xenografted tumor tissues were analyzed. D The expressions of IGF2BP3, NFAT1 and IRF1 in xenograft tumor tissues were examined by IHC assay. E, F The relative mRNA expressions of eIF4E (E) and NFAT1 (F) in GC tissues compared with gastric normal tissues from the GEPIA database. G Correlation between IGF2BP3 and NFAT1 mRNA expressions in GC tissues were analyzed from the OncoDB database. HJ Correlation between the expression of eIF4E (H), NFAT1 (I), IRF1 (J) and OS in GC patients were analyzed by the Kaplan-Meier Plotter. K The graphic illustration of IGF2BP3/NFAT1/IRF1 axis regulate GC progression.

Similar articles

Cited by

References

    1. Sung H, Ferlay J, Siegel RL, Laversanne M, Soerjomataram I, Jemal A, et al. Global Cancer Statistics 2020: GLOBOCAN Estimates of Incidence and Mortality Worldwide for 36 Cancers in 185 Countries. CA Cancer J Clin. 2021;71:209–49. doi: 10.3322/caac.21660. - DOI - PubMed
    1. He Y, Liang D, Li D, Shan B, Zheng R, Zhang S, et al. Incidence and mortality of laryngeal cancer in China, 2015. Chin J Cancer Res. 2020;32:10–7. doi: 10.21147/j.issn.1000-9604.2020.01.02. - DOI - PMC - PubMed
    1. Desrosiers R, Friderici K, Rottman F. Identification of methylated nucleosides in messenger RNA from Novikoff hepatoma cells. Proc Natl Acad Sci USA. 1974;71:3971–5. doi: 10.1073/pnas.71.10.3971. - DOI - PMC - PubMed
    1. Dominissini D, Moshitch-Moshkovitz S, Schwartz S, Salmon-Divon M, Ungar L, Osenberg S, et al. Topology of the human and mouse m6A RNA methylomes revealed by m6A-seq. Nature. 2012;485:201–6. doi: 10.1038/nature11112. - DOI - PubMed
    1. Meyer KD, Saletore Y, Zumbo P, Elemento O, Mason CE, Jaffrey SR. Comprehensive analysis of mRNA methylation reveals enrichment in 3’ UTRs and near stop codons. Cell. 2012;149:1635–46. doi: 10.1016/j.cell.2012.05.003. - DOI - PMC - PubMed

Publication types