. 2024 Mar 6;15(1):2022.
doi: 10.1038/s41467-024-46097-y.

In situ electrochemical regeneration of nanogap hotspots for continuously reusable ultrathin SERS sensors

Affiliations

In situ electrochemical regeneration of nanogap hotspots for continuously reusable ultrathin SERS sensors

Sarah May Sibug-Torres et al. Nat Commun. .

Abstract

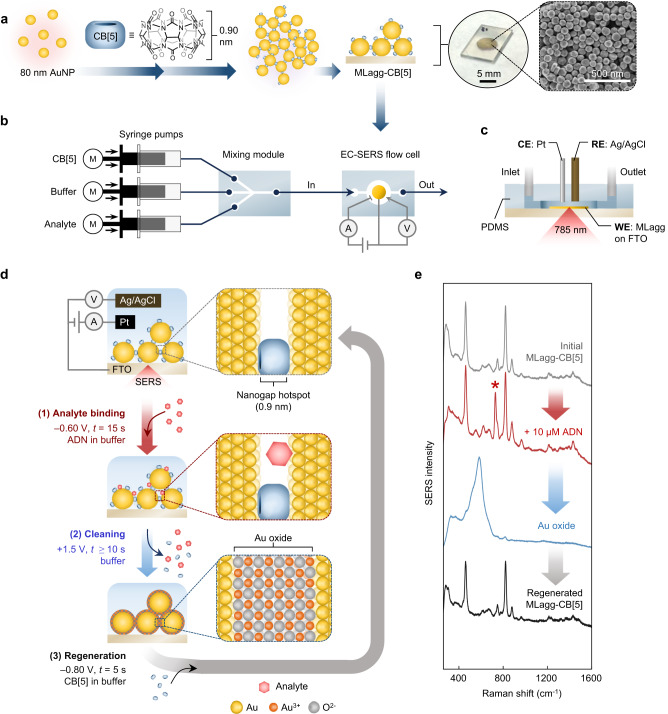
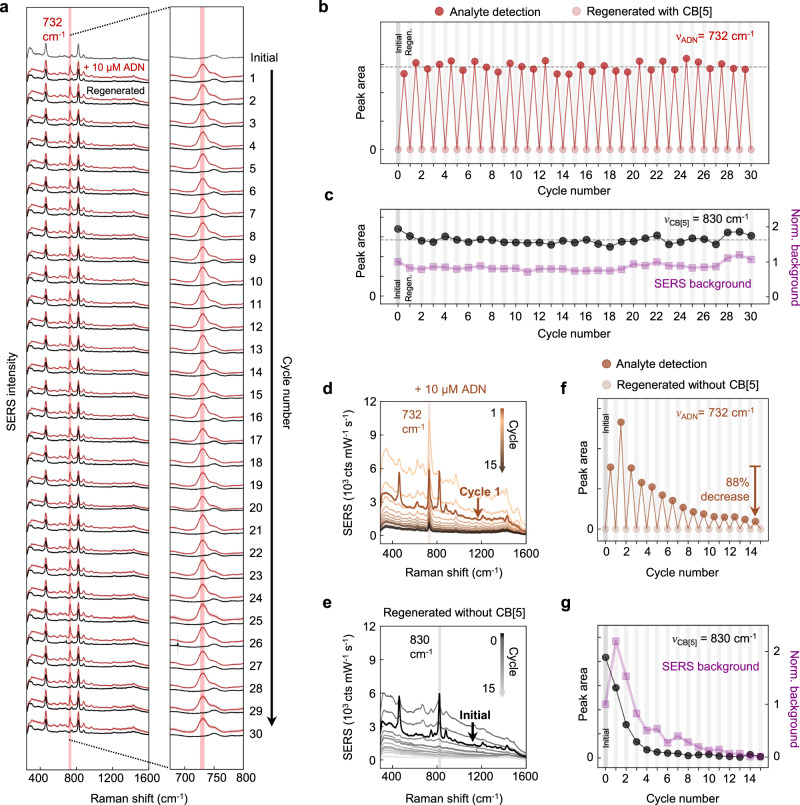
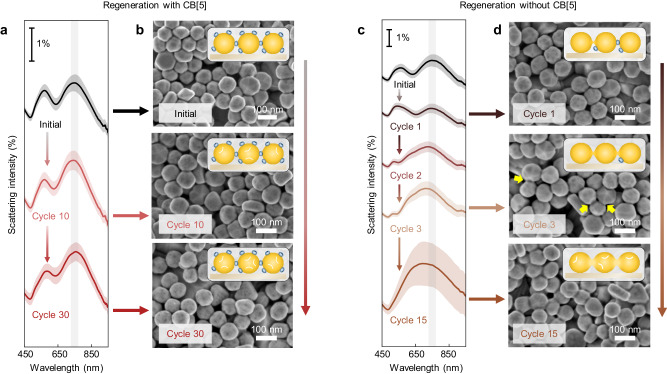
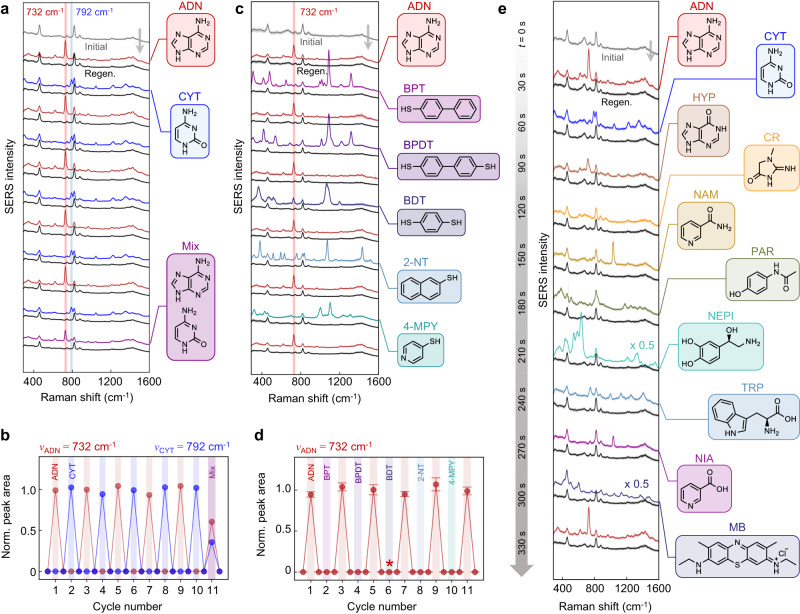
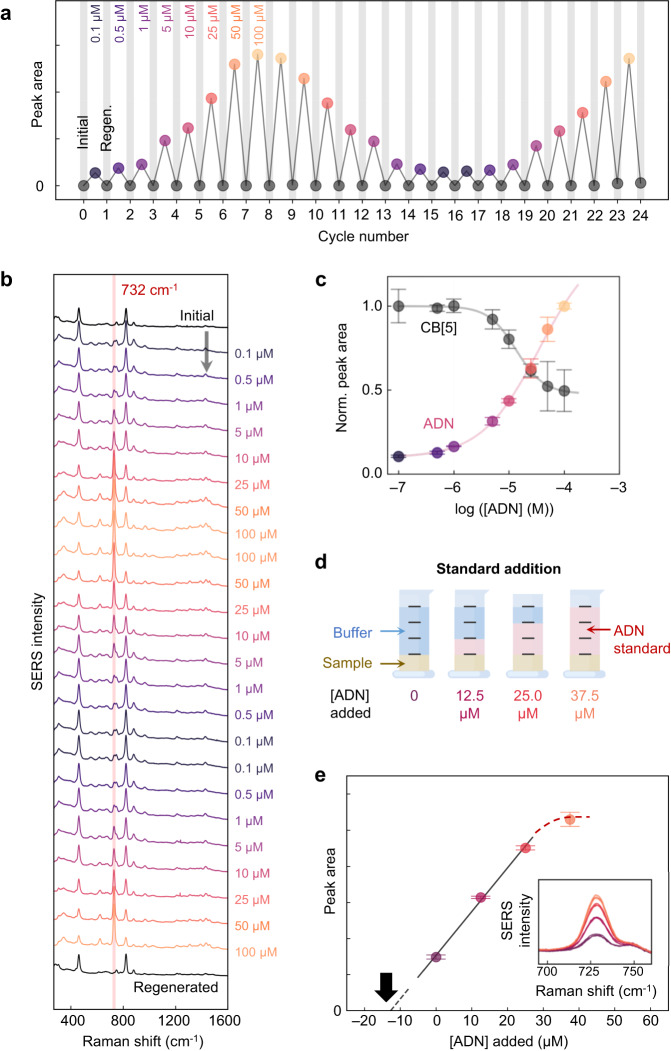
Surface-enhanced Raman spectroscopy (SERS) harnesses the confinement of light into metallic nanoscale hotspots to achieve highly sensitive label-free molecular detection that can be applied for a broad range of sensing applications. However, challenges related to irreversible analyte binding, substrate reproducibility, fouling, and degradation hinder its widespread adoption. Here we show how in-situ electrochemical regeneration can rapidly and precisely reform the nanogap hotspots to enable the continuous reuse of gold nanoparticle monolayers for SERS. Applying an oxidising potential of +1.5 V (vs Ag/AgCl) for 10 s strips a broad range of adsorbates from the nanogaps and forms a metastable oxide layer of few-monolayer thickness. Subsequent application of a reducing potential of -0.80 V for 5 s in the presence of a nanogap-stabilising molecular scaffold, cucurbit[5]uril, reproducibly regenerates the optimal plasmonic properties with SERS enhancement factors ≈106. The regeneration of the nanogap hotspots allows these SERS substrates to be reused over multiple cycles, demonstrating ≈5% relative standard deviation over at least 30 cycles of analyte detection and regeneration. Such continuous and reliable SERS-based flow analysis accesses diverse applications from environmental monitoring to medical diagnostics.


Conflict of interest statement

The authors J.J.B., S.M.S.-T., D.-B.G., M.N., and E.W. declare the following competing interests: filed patent, Surface-enhanced spectroscopy substrates, UK 2304765.7, 30/3/2023. The authors G.K., N.S., A.R., and B.d.N. declare no competing interests.

Figures

Fig. 1
Fig. 1. Preparation and in-flow EC-SERS analyte detection, cleaning, and regeneration with MLagg-CB[5].
a Preparation of MLagg-CB[5] SERS aggregate from self-assembly of AuNPs with CB[5], followed by deposition onto solid support. Photo and scanning electron micrograph (SEM) show MLagg-CB[5] deposited on FTO-coated glass. b Schematic illustraties the integration of an MLagg-CB[5] into an EC-SERS flow system. c Cross-section of the EC-SERS flow cell (CE = counter electrode, RE = reference electrode, and WE = working electrode). d Schematic of in situ electrochemical SERS analyte detection and cleaning/regeneration protocol. Potentials are vs Ag/AgCl. e SERS spectra from: initial MLagg-CB[5] (grey), after detection of 10 µM adenine (ADN) (red), after oxidative cleaning step (blue), and after regeneration step (black). ADN peak at 732 cm−1 is marked by asterisk. SERS spectra are collected with 1 s integration time and 1 mW 785 nm laser.
Fig. 2
Fig. 2. Analyte detection, cleaning, and regeneration cycles with and without CB[5].
a SERS spectra from 30 cycles of 10 µM ADN detection (red) and regeneration with CB[5] (black). Spectra are offset for clarity. b ADN peak areas (νADN = 732 cm−1) from the SERS spectra of each ADN detection and cleaning/CB[5]-regeneration cycle. Dotted horizontal line represents the average ADN peak area of all analyte detection cycles. c CB[5] peak areas (νCB[5] = 830 cm−1, black circles) and integrated SERS background (purple squares) for the CB[5]-regenerated MLagg. Dotted horizontal line represents the average CB[5] peak area of all regeneration cycles. d Overlaid SERS spectra from 15 cycles of 10 µM ADN detection and e after regeneration without CB[5]. A constant background was subtracted from all spectra to facilitate comparison across 15 cycles. f ADN peak areas (νADN = 732 cm−1) from the SERS spectra of each ADN detection and cleaning/regeneration cycle without CB[5]. g CB[5] peak areas (νCB[5] = 830 cm−1, black circles) and integrated SERS background (purple squares) for the MLagg regenerated without CB[5].
Fig. 3
Fig. 3. Morphology changes with or without CB[5] during regeneration.
a DF scattering spectra and (b) representative SEM images of the MLagg-CB[5] before and after undergoing 10 and 30 cycles of analyte detection, cleaning, and regeneration with CB[5]. c DF scattering spectra and (d) representative SEM images of the MLagg-CB[5] throughout different cycles of analyte detection, cleaning, and regeneration without CB[5]. Yellow arrows in (d) point to bridges formed between neighbouring AuNPs. For the DF spectra, solid lines and shaded area represent mean and ±1 s.d. of n = 150 spectra obtained across the area of a MLagg-CB[5]. Grey line highlights initial chain mode peak wavelength. Spectra are offset for clarity.
Fig. 4
Fig. 4. In situ analyte switching.
a Sequential SERS spectra from alternating detection of 100 µM ADN (red) and 100 µM CYT (blue) with the corresponding regenerated MLagg-CB[5] (black). A 50:50% mixture of 100 µM ADN and 100 µM CYT (purple) is also tested. b Normalized peak areas of ADN (νADN = 732 cm−1, red) and CYT (νCYT = 792 cm−1, blue) per detection-regeneration cycle. c Sequential spatially-averaged SERS spectra from alternating detection of 100 µM ADN (red) and 100 µM 4-biphenylthiol (BPT), 4,4-biphenyldithiol (BPDT), 1,4-benzenedithiol (BDT), 2-naphthalenethiol (2-NT), and 4-mercaptopyridine (4-MPY) with the corresponding regenerated MLagg-CB[5] (black). d Normalized peak area of νADN per ADN/thiol detection-regeneration cycle. Peak areas are plotted as the mean with error bars representing ±1 s.d. of n = 10 spectra obtained from different points across the MLagg-CB[5] area. For cycle 6 (marked by asterisk), alternative ADN peak at 970 cm−1 is used due to overlap with BDT peak at 732 cm−1. e Sequential SERS spectra from detection of a series of biological compounds: ADN, CYT, hypoxanthine (HYP), creatinine (CR), nicotinamide (NAM), paracetamol (PAR), norepinephrine (NEPI), tryptophan (TRP), nicotinic acid (NIA), methylene blue (MB), and ADN (red) again with the corresponding regenerated MLagg-CB[5] (black). Time (t) axis marks progress of both analyte detection and ReSERS (30 s between each detection cycle). All SERS spectra collected a1 s integration time and with 1 mW 785 nm excitation laser.
Fig. 5
Fig. 5. Quantitative analysis of ADN.
a ADN peak areas at νADN from sequentially measured calibration standards (0.1 to 100 µM) in 50 mM potassium phosphate buffer (pH 7.0) and regenerated MLagg-CB[5] (black circles). b Sequential SERS spectra from ADN calibration standards measured from the same MLagg-CB[5] SERS substrate. SERS spectra collected at 1 s integration time and 1 mW 785 nm laser. c Relative peak areas of CB[5] (νCB[5] = 830 cm−1) and ADN (νADN.  = 732 cm−1) vs [ADN] (log scale). Peak areas are plotted as the mean with error bars representing ±1 s.d. from n = 3 measurements of an ADN calibration standard using the same MLagg-CB[5] SERS substrate after multiple ReSERS cycles. Solid lines are fits. d Schematic of the standard addition analysis of ADN in urine. e ADN peak area vs added [ADN] standard. Points are plotted as mean ±1 s.d. from n = 3 measurements of an ADN calibration standard using the same MLagg-CB[5] SERS substrate after multiple ReSERS cycles. Grey solid line is linear fit, dashed grey line is linear extrapolation. Black arrow points to the extrapolated x-intercept. Red dashed line highlights the trend towards non-linearity at higher concentration. Inset shows close-up of ADN peak from SERS spectra of calibration standards.

Similar articles

Cited by

References

    1. De Nijs B, et al. Inhibiting analyte theft in surface-enhanced raman spectroscopy substrates: subnanomolar quantitative drug detection. ACS Sensors. 2019;4:2988–2996. doi: 10.1021/acssensors.9b01484. - DOI - PMC - PubMed
    1. Ong TTX, Blanch EW, Jones OAH. Surface enhanced Raman spectroscopy in environmental analysis, monitoring and assessment. Sci. Total Environ. 2020;720:137601. doi: 10.1016/j.scitotenv.2020.137601. - DOI - PubMed
    1. Kasera S, et al. Quantitative multiplexing with nano-self-assemblies in SERS. Sci. Rep. 2014;4:1–6. doi: 10.1038/srep06785. - DOI - PMC - PubMed
    1. Chen W-H, et al. Plasmonic Sensing Assay for Long-Term Monitoring (PSALM) of neurotransmitters in urine. ACS Nanosci. Au. 2023;3:161–171. doi: 10.1021/acsnanoscienceau.2c00048. - DOI - PMC - PubMed
    1. Niihori M, et al. SERS sensing of dopamine with Fe(III)‐sensitized nanogaps in recleanable AuNP monolayer films. Small. 2023;19:2302531. doi: 10.1002/smll.202302531. - DOI - PubMed