. 2024 Mar 6;15(1):2029.
doi: 10.1038/s41467-024-46379-5.

Microtubule damage shapes the acetylation gradient

Affiliations

Microtubule damage shapes the acetylation gradient

Mireia Andreu-Carbó et al. Nat Commun. .

Abstract

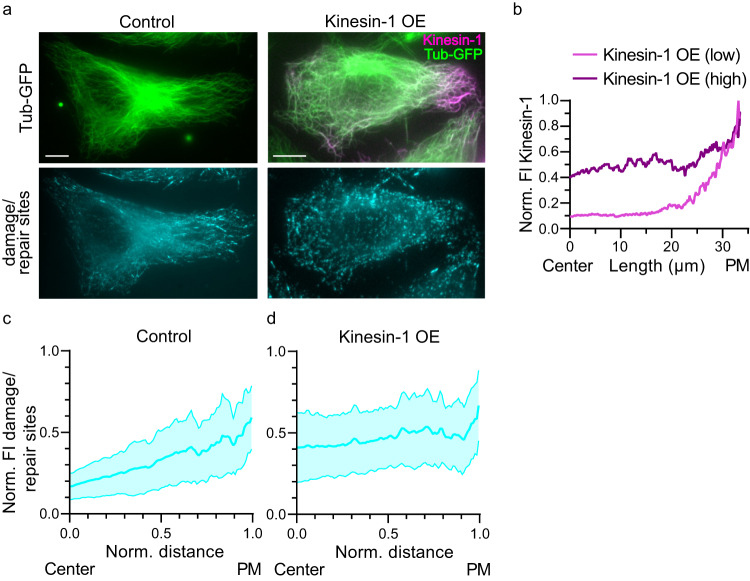
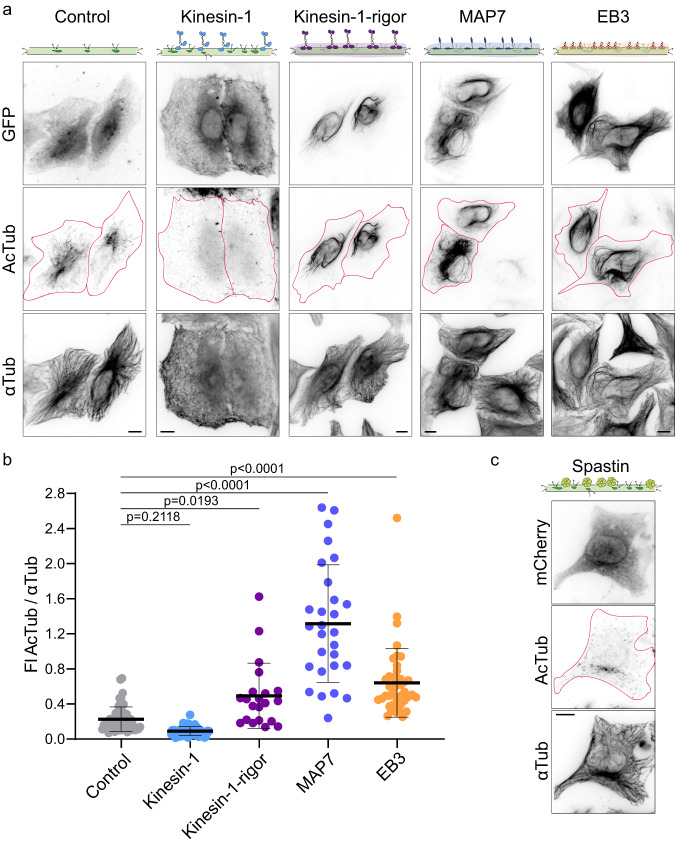
The properties of single microtubules within the microtubule network can be modulated through post-translational modifications (PTMs), including acetylation within the lumen of microtubules. To access the lumen, the enzymes could enter through the microtubule ends and at damage sites along the microtubule shaft. Here we show that the acetylation profile depends on damage sites, which can be caused by the motor protein kinesin-1. Indeed, the entry of the deacetylase HDAC6 into the microtubule lumen can be modulated by kinesin-1-induced damage sites. In contrast, activity of the microtubule acetylase αTAT1 is independent of kinesin-1-caused shaft damage. On a cellular level, our results show that microtubule acetylation distributes in an exponential gradient. This gradient results from tight regulation of microtubule (de)acetylation and scales with the size of the cells. The control of shaft damage represents a mechanism to regulate PTMs inside the microtubule by giving access to the lumen.


Conflict of interest statement

The authors declare no competing interests.

Figures

Fig. 1
Fig. 1. Kinesin-1 activity alters the distribution of microtubule damage sites.
a Representative immunofluorescence images of the microtubule network (top) and damage/repair sites (bottom) in HeLa Tubulin-GFP (Tub-GFP) cells (Control; left) and cells overexpressing K560-mCherry (Kinesin-1 OE in magenta; right) and stained for damage/repair sites (hMB11, recognizes GTP-tubulin and thus also labels MT tips). Scale bars: 10 µm. b Representative, normalized fluorescence intensity (FI) profile of kinesin-1 at low and high expression levels from the cell center to the periphery. c and d Spatial distribution profile of the hMB11 FI relative to the FI of Tub-GFP, normalized intensity maxima, in non-transfected cells (Control, n = 45, c) and Kinesin-1 OE cells (n = 40, d) from 3 different experiments. Blue lines: Mean with SD. Source data are provided as a Source Data file.
Fig. 2
Fig. 2. Microtubule acetylation is distributed in an exponential gradient and running kinesin-1 variants reduce acetylation.
a Representative immunofluorescence image with zoom-in of a HeLa cell stained for acetylated tubulin (AcTub) and α-tubulin (αTub). Note the decrease of acetylation levels from the cell center to the cell periphery and the discrete acetylated microtubule segments. b Length of acetylated microtubule segments (AcMT segments) in HeLa cells (n = 80 cells) from 3 independent experiments. Mean with SD. c Mean acetylation profile with SD (gray) and with exponential fit (red) and the characteristic length λ. Function of the normalized intensity maxima (AcTub/αTub) to the normalized distance from the nucleus (center) to the plasma membrane (PM) in HeLa cells (n = 42 cells) from 3 independent experiments. d Representative immunofluorescence images of HeLa cells overexpressing pEGFP-N1 (Control), K560-GFP (Kinesin-1 OE) and K560Δ6-GFP (Kinesin-1Δ6 OE) at different expression levels, and stained for AcTub and αTub. e Fraction of AcMTs (total acetylated microtubule length / total microtubule network length) after skeletonizing the microtubule network and f Length of AcMT segments. e, f For HeLa cells overexpressing pEGFP-N1 (Control, n = 80 cells), K560-GFP (Kinesin-1, n = 83 cells), K560Δ6-GFP (Kinesin-1Δ6, n = 90 cells), HeLa cells knock-down for kinesin-1 (siKin-1, n = 101 cells) compared to siRNA control cells (siCtrl, n = 100 cells) from 3 independent experiments. Statistics: one-way ANOVA. Mean with SD. FI of kinesin-1-GFP and kinesin-1Δ6-GFP expression was grouped into low, medium, and high (see Methods). g Left, Representative immunofluorescence image of HeLa cells siCtrl and siKin-1 treated with 5 µM Nocodazole for 1 h at 37°C before fixation. Cells were stained for AcTub. Right, Quantification of the area of the AcMT array/total cell area in siKin-1 cells (n = 112) compared to siCtrl cells (n = 101) from 3 independent experiments. Statistics: two tailed t test. Mean with SD (right). The magenta outline defines the edges of the cells. Scale bars: 10 µm. Source data are provided as a Source Data file.
Fig. 3
Fig. 3. Running kinesin-1 affects the exponential acetylation gradient and microtubules are deacetylated around damage sites.
a Representative immunofluorescence image of a HeLa cell overexpressing K560-GFP and stained for AcTub (left). Normalized FI profile of the kinesin-1 and the acetylation distribution along the cell length (right) of the boxed area. b, c Mean acetylation profile (blue) and kinesin-1 profile (magenta) with SD. Function of the normalized intensity maxima (AcTub/αTub, or Kinesin-1/αTub) to the normalized distance from the nucleus (center) to the plasma membrane (PM) for b Low (n = 11 cells) and c High levels of kinesin-1 overexpression (n = 19 cells) in HeLa cells. d Relative mean acetylation profiles in presence of different kinesin-1 expression levels with exponential fit (red) and the characteristic length λ. Control HeLa cells from Fig. 2c, low and high K560 expressing cells from b, c (see “Methods”). e Representative immunofluorescence image of a HeLa Tubulin-GFP (Tub-GFP) cell stained for AcTub and damage/repair sites (hMB11, also labeling the growing tip). Zoom-in of merge of AcTub and hMB11. White arrowhead: AcMT with a damage/repair site. Scale bars: 10 µm. f Representative AcMT with a damage/repair site. Yellow arrowhead indicates dAcMT stretch. Scale bar: 1 µm; corresponding line scan below. g Length of damage/repair sites and dAcMT stretches. Mean with SD of a total of n = 65 sites. h Extension of dAcMT stretches beyond damage/repair sites to microtubule plus- or minus-ends with respect to the damage/repair site (0 = border of damage/repair site), see also line scan in f extensions indicated by arrows. Gray dots correspond to dAcMT stretches embedded within damage/repair sites. Mean with SD of a total of n = 65 analyzed sites with a total of n = 86 extensions. i Distances between centers of damage/repair sites and centers dAcMT stretches. Displacement of the dAcMT center relative to the damage/repair center towards the microtubule plus- or minus-end. Grey dots, colocalization of the centers. Mean with SD of a total of n = 65 sites. b, c, d, g, h, i Statistics: two tailed t test from 3 independent experiments. Source data are provided as a Source Data file.
Fig. 4
Fig. 4. HDAC6 colocalizes with deacetylated microtubules.
a Representative immunofluorescence image stained for alfa, AcTub and αTub with quantification of acetylation levels in HeLa WT cells (n = 64) and HDAC6-alfa overexpressing cells (n = 91) from 3 independent experiments. Statistics: two tailed t test. Mean with SD. HDAC6-alfa at low (magenta arrowhead) and high (blue arrowhead) expression levels. The magenta outline defines the edges of the cell. b Representative immunofluorescence image of HeLa cells overexpressing HDAC6-alfa and stained for alfa, AcTub and αTub after cytoplasm extraction. Scale bars: 10 µm. Right, zoom-in of the three channels with merge. Scale bar: 2 µm. Yellow arrowhead points out the microtubule of corresponding line scan in c, d Manders’ colocalization between AcMT segments and HDAC6 (n = 20 cells) from 3 different experiments. Note that, we considered only HDAC6 along the microtubule network, by using a mask-based analysis (see Methods). Statistics: two tailed t test. Mean with SD. Source data are provided as a Source Data file.
Fig. 5
Fig. 5. Kinesin-1-induced microtubule deacetylation depends on HDAC6 activity.
a Representative immunofluorescence images of HeLa WT cells, control cells (siCtrl) and kinesin-1 knock-down (siKin-1), both siRNA conditions were treated with 2 µM Tubacin for 1 h at 37°C before fixation. Cells were stained for AcTub and αTub. b Representative immunofluorescence images of HeLa cells overexpressing pEGFP-N1 (Control) or K560-GFP (Kinesin-1 OE) treated and stained as in (a). The magenta outline defines the edges of the cells. Scale bars: 10 µm. c Fraction of AcMTs after with 0.5 µM Tubacin treatment in siCtrl cells (n = 59) and siKin-1 cells (n = 57) and with 2 µM Tubacin in siCtrl cells (n = 80) and siKin-1 cells (n = 75), all from 3 independent experiments; Control cells from Fig. 2e. Statistics: one-way ANOVA. Mean with SD. d Fraction of AcMTs in cells overexpressing pEGFPN-1 cells (n = 89) and K560-GFP cells (n = 89) after Tubacin treatment (2 µM) from 3 independent experiments. Statistics: two tailed t test. Mean with SD. e Representative western blot analysis with quantification of AcTub levels relative to GAPDH in HeLa siCtrl and siKin-1 cells after incubation with 2 µM Tubacin for 0, 5, 15, 30, and 60 min, from 3 independent experiments. Statistics: two-way ANOVA. Mean with SD. Source data are provided as a Source Data file.
Fig. 6
Fig. 6. The establishment of the acetylation pattern during microtubule regrowth can be boosted by kinesin-1.
a Scheme of microtubule regrowth assay (see Methods). b Representative western blot analysis with (c) quantification of AcTub levels relative to GAPDH in untreated HeLa WT cells (Ctrl), cells just after cold treatment (0’), after 30 min of microtubule regrowth (30′) in presence of DMSO or 2 µM Tubacin, from 3 independent experiments. Statistics: one-way ANOVA. Mean with SD. d Representative immunofluorescence images of an untreated cell (Ctrl), cells at 0, 10, 15 and 30 min of microtubule regrowth, and a cell at 30 min regrowth in presence of 2 µM Tubacin, all stained for AcTub and αTub. Zoom-in of acetylated microtubules. The magenta outline defines the edges of the cells. Scale bars: 10 µm. For images at further timepoints, cells overexpressing kinesin-1 or treated with tubacin see Supplementary Fig. 6. e Number of AcMT segments in HeLa WT (Ctrl) and overexpressing K560-GFP cells (Kinesin-1) after 0, 10 min (n = 60 cells Ctrl; n = 38 cells Kinesin-1), 15 min (n = 66 cells Ctrl; n = 40 cells Kinesin-1) and 30 min (n = 60 cells Ctrl; n = 36 cells Kinesin-1) of microtubule regrowth, from 3 independent experiments. Statistics: two tailed t test. Mean with SD. f Length of the AcMT segments in Ctrl cells, Kinesin-1 cells and cells treated with 2 µM Tubacin (Tubacin) after 0, 10, 15 and 30 min during microtubule regrowth (n = 48, n = 49, n = 62 cells for Tubacin; analyzed Ctrl and Kinesin-1 cells are the same as in (e) and at steady state conditions (n = 80 cells Ctrl; n = 76 cells Tubacin; n = 45 cells kinesin-1). Statistics: two tailed t test. Mean with SD. Source data are provided as a Source Data file.
Fig. 7
Fig. 7. Shaft damage independent of kinesin-1 affects microtubule deacetylation.
a Representative immunofluorescence images of HeLa cells overexpressing pEGFP-N1 (Control), K560-GFP (Kinesin-1), K560-rigor-GFP (Kinesin-1-rigor), MAP7-GFP (MAP7) or EB3-GFP (EB3) and stained for AcTub and αTub. The magenta outline defines the edges of the overexpressing cells. b FI of AcTub relative to the total FI of αTub per cell in each condition in (a): Control (n = 57), Kinesin-1 (n = 54), Kinesin-1-rigor (n = 21), MAP7 (n = 28) or EB3 (n = 43), each from 3 independent experiments. Note that values above 1 are due to differences in the acetylation and tubulin antibodies and are not informative for the fraction of AcTub (for details see Methods). Statistics: one-way ANOVA. Mean with SD. c Representative immunofluorescence images of HeLa cells overexpressing mCherry-Spastin (Spastin) and stained for AcTub and αTub from 3 independent experiments. The magenta outline defines the edges of the cell. Scale bars: 10 µm. Source data are provided as a Source Data file.

Similar articles

Cited by

References

    1. Vale RD. The molecular motor toolbox for intracellular transport. Cell. 2003;112:467–480. doi: 10.1016/S0092-8674(03)00111-9. - DOI - PubMed
    1. Nédélec F, Surrey T, Maggs AC. Dynamic concentration of motors in microtubule arrays. Phys. Rev. Lett. 2001;86:3192–5. doi: 10.1103/PhysRevLett.86.3192. - DOI - PubMed
    1. Banks RA, et al. Motor processivity and speed determine structure and dynamics of microtubule-motor assemblies. Elife. 2023;12:e79402. doi: 10.7554/eLife.79402. - DOI - PMC - PubMed
    1. Verhey KJ, Hammond JW. Traffic control: regulation of kinesin motors. Nat. Rev. Mol. Cell Biol. 2009;10:765–777. doi: 10.1038/nrm2782. - DOI - PubMed
    1. Hollenbeck PJ. The distribution, abundance and subcellular localization of kinesin. J. Cell Biol. 1989;108:2335–2342. doi: 10.1083/jcb.108.6.2335. - DOI - PMC - PubMed