. 2024 Mar 6;15(1):2039.
doi: 10.1038/s41467-024-46308-6.

An artificial protein modulator reprogramming neuronal protein functions

Affiliations

An artificial protein modulator reprogramming neuronal protein functions

Peihua Lin et al. Nat Commun. .

Abstract

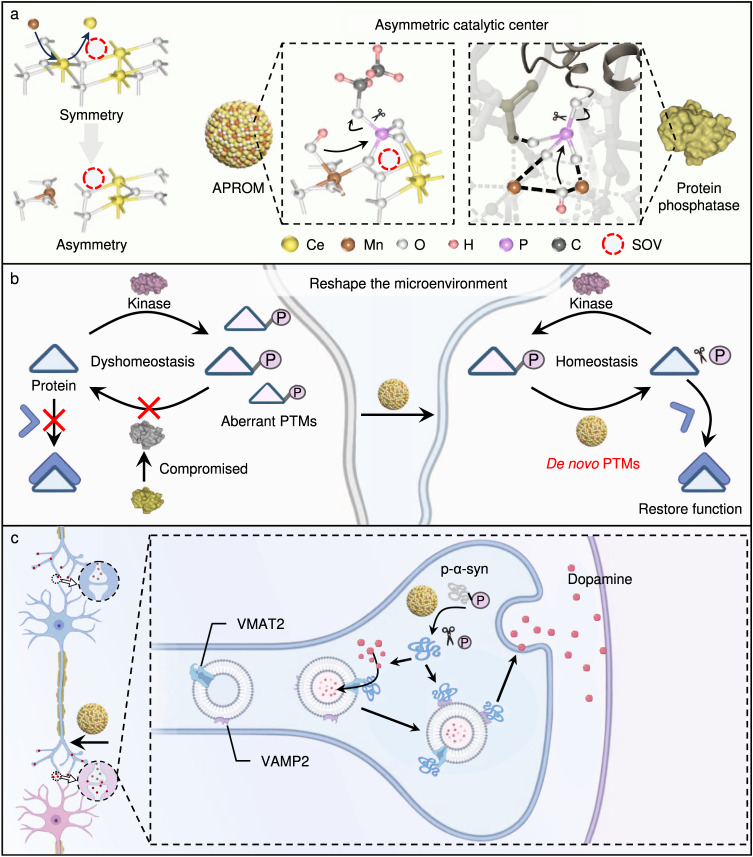
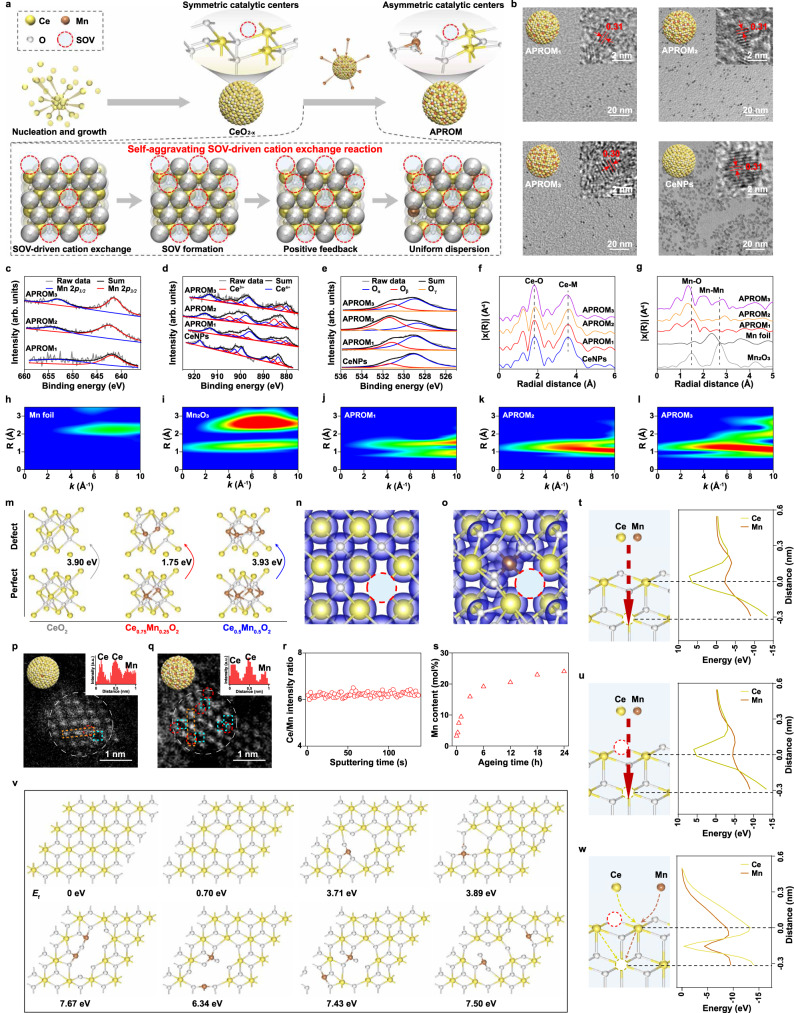
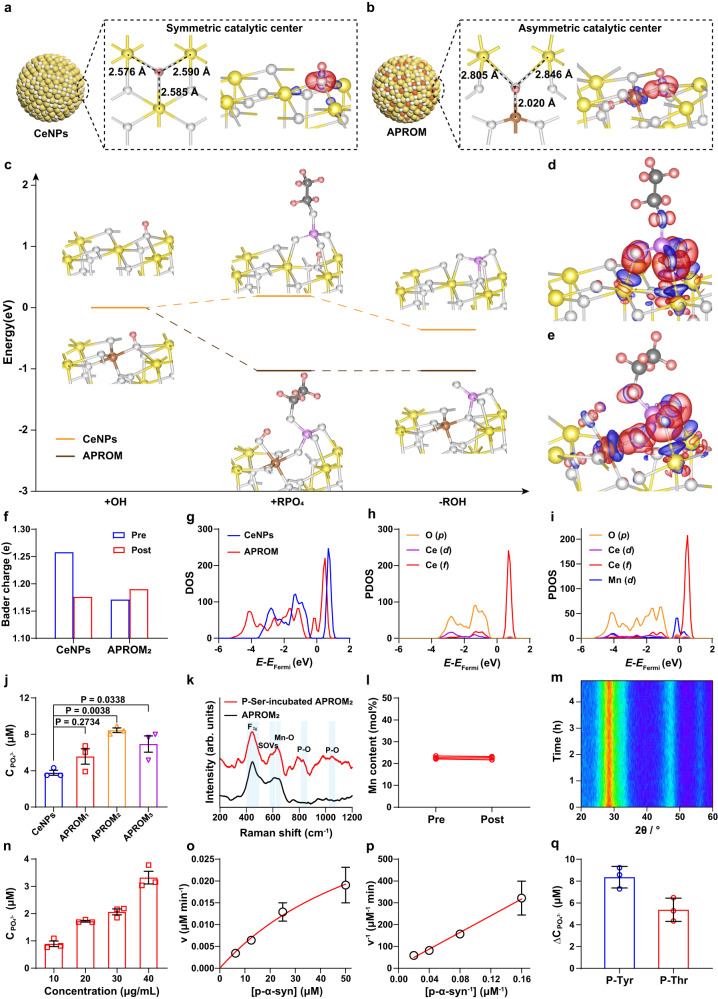
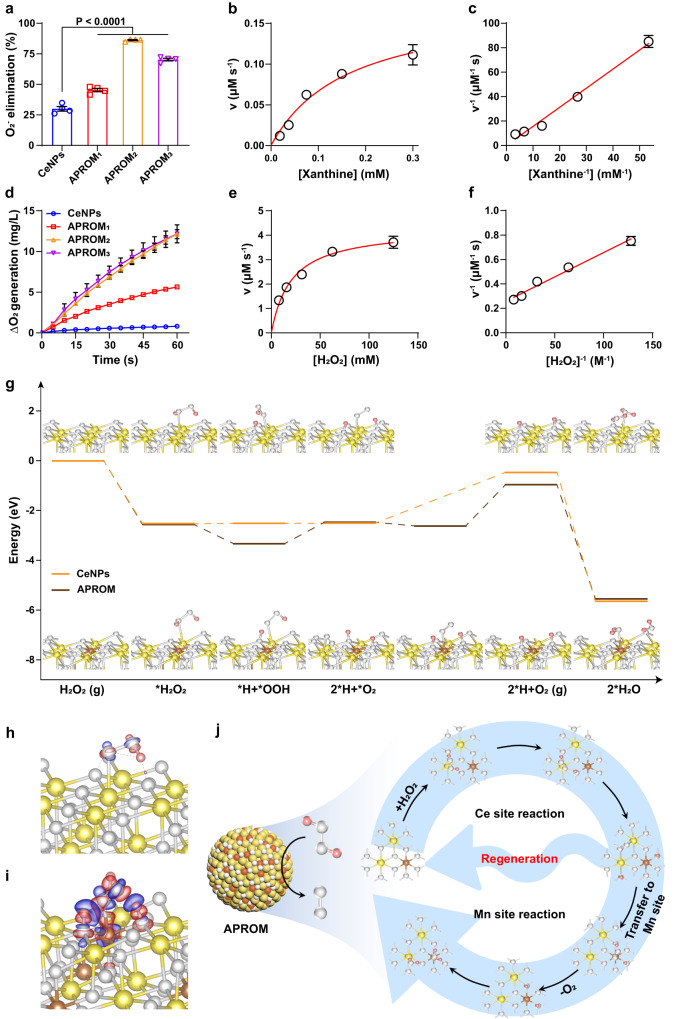
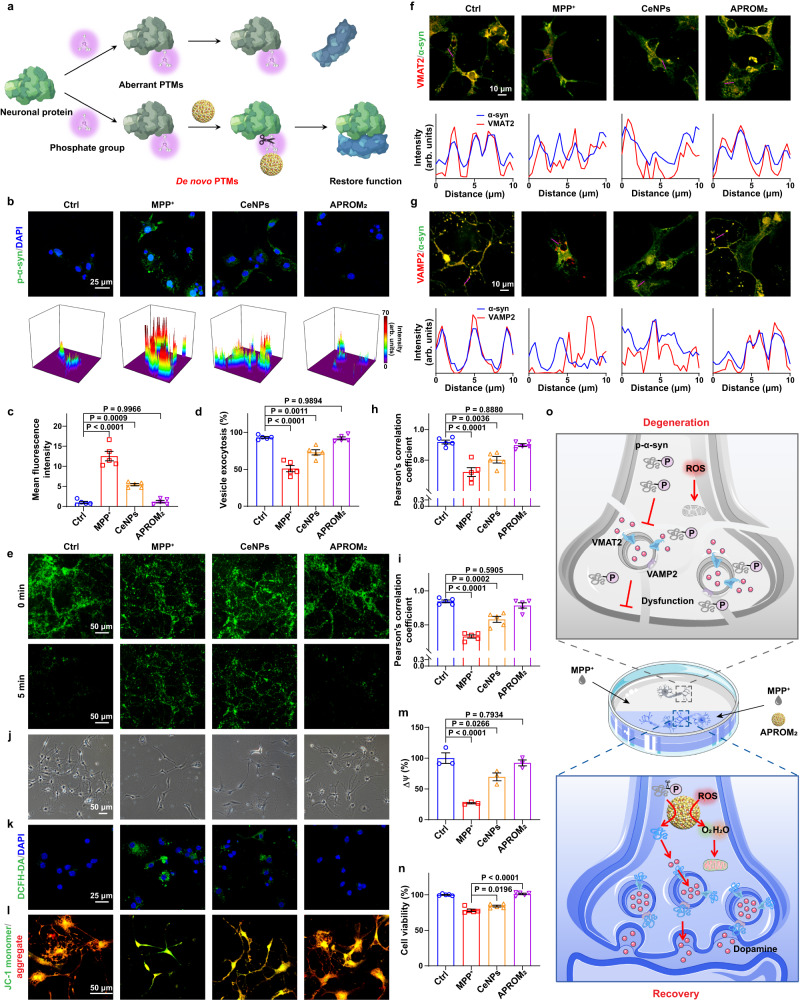
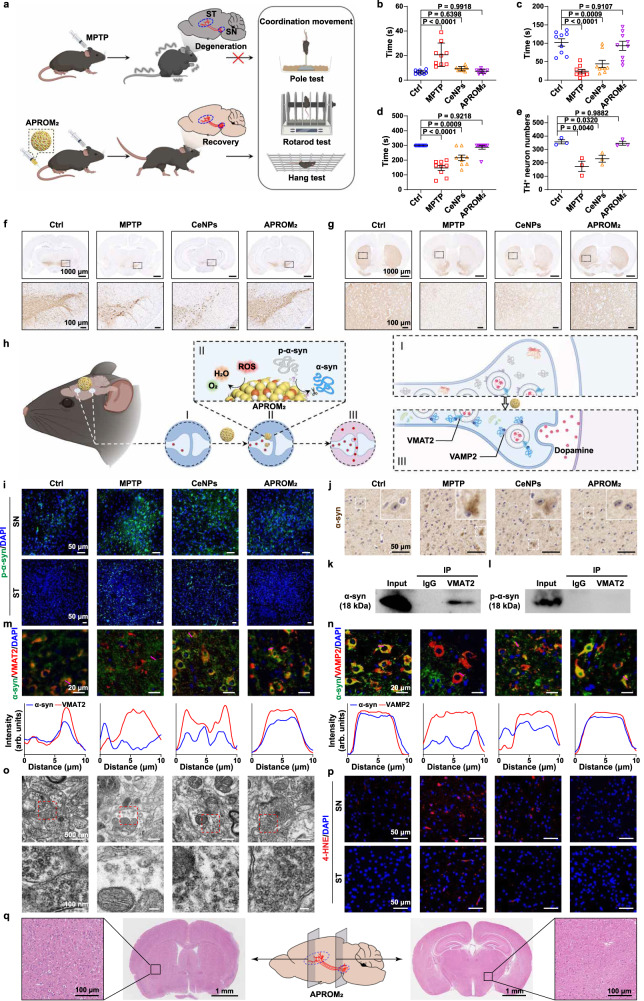
Reversible protein phosphorylation, regulated by protein phosphatases, fine-tunes target protein function and plays a vital role in biological processes. Dysregulation of this process leads to aberrant post-translational modifications (PTMs) and contributes to disease development. Despite the widespread use of artificial catalysts as enzyme mimetics, their direct modulation of proteins remains largely unexplored. To address this gap and enable the reversal of aberrant PTMs for disease therapy, we present the development of artificial protein modulators (APROMs). Through atomic-level engineering of heterogeneous catalysts with asymmetric catalytic centers, these modulators bear structural similarities to protein phosphatases and exhibit remarkable ability to destabilize the bridging μ3-hydroxide. This activation of catalytic centers enables spontaneous hydrolysis of phospho-substrates, providing precise control over PTMs. Notably, APROMs, with protein phosphatase-like characteristics, catalytically reprogram the biological function of α-synuclein by directly hydrolyzing hyperphosphorylated α-synuclein. Consequently, synaptic function is reinforced in Parkinson's disease. Our findings offer a promising avenue for reprogramming protein function through de novo PTMs strategy.


Conflict of interest statement

The authors declare no competing interests.

Figures

Fig. 1
Fig. 1. Designing the artificial protein modulator (APROM) through atomic-level engineering of heterogeneous catalysts with asymmetric catalytic centers to reprogram neuronal protein functions via the de novo post-translational modification (PTM) strategy.
a The scheme illustrates the unique features of the APROM, which possesses asymmetric catalytic centers similar to natural protein phosphatases through precisely incorporating site-specific single manganese atoms into heterogeneous ceria nanoparticular catalysts. These catalytic centers facilitate the conversion of the asymmetric bridging μ3-hydroxide into Mn-bonded OH, resulting in the activation of active catalytic centers capable of binding phospho-substrates and initiating spontaneous hydrolysis. b The APROM, characterized by protein phosphatase-like characteristics, plays a vital role in reversing aberrant PTM processes by compensating for compromised protein phosphatases through de novo PTMs. This mechanism ultimately leads to the restoration of protein function. c Notably, APROM2 directly modulates phosphorylated α-syn (p-α-syn) by cleaving the phosphate monoester bond, enabling α-syn to regain its biological functions of binding to vesicular monoamine transporter 2 (VMAT2) and vesicle-associated membrane protein 2 (VAMP2). This restoration of α-syn function catalytically fuels synaptic activity, thereby contributing to the enhancement of synaptic plasticity in PD. SOV, surface oxygen vacancy. Structure of protein phosphatase and kinase is from PDB ID 1S95 and 4RS6, respectively. Panels ac were created with BioRender.com.
Fig. 2
Fig. 2. Synthesis, and characterization of APROMs, as well as the evolution of asymmetric catalytic centers in APROMs.
a Schematic illustration of the synthesis of the APROM with asymmetric catalytic centers through the self-aggravating SOV-driven cation exchange strategy. b TEM image of APROMs and CeNPs. Inset, schematic illustration (left) and HRTEM (right). High-resolution XPS spectra of Mn 2p peaks (c), Ce 3d peaks (d) and O 1s peaks (e) of APROMs and CeNPs. Peaks of Oα correspond to lattice oxygen species, peaks of Oβ correspond to surface oxygen species derived from defective sites, and peaks of Oγ correspond to chemisorbed water and carbonates. f Fourier-transform Ce-L3-edge EXAFS spectra of APROMs and CeNPs. g Fourier-transform Mn-K-edge EXAFS spectra of Mn foil, Mn2O3 and APROMs. WT images of the Mn-K-edge of Mn foil (h), Mn2O3 (i), and APROMs (jl). m Unit cell configurations and corresponding ∆ESOV of CeO2, Ce0.75Mn0.25O2, and Ce0.5Mn0.5O2. Simulated charge-density isosurface plots of CeO2-x (n) and Ce0.75Mn0.25O2-x (o). The red dashed circle represents SOVs, and the blue area represents a charge density of 0.05 e/bohr. Atomic-resolution HAADF-STEM images of APROM2 obtained after aging for 15 min (p) and 24 h (q). Inset, schematic illustration of nanoparticles (left) and line intensity profile in the orange rectangle highlighting the positions of single Ce atom and Mn atom (right). The red dashed circle represents Mn, and the cyan dashed square represents SOVs. r Time-of-flight secondary ion mass spectrometry depth profile of APROM2, showing the in-depth distribution of the Ce-to-Mn ratio. s The Mn content of APROM2 at different aging times. Schematic illustration and computational energy of the movement of Ce and Mn toward the subsurface of CeO2 (t) and CeO2-x (u). v Structural configurations and corresponding Ef of CeO2, CeO2-x, and different Mn/CeO2-x. w Schematic illustration and corresponding computational energy of self-aggravating SOV-driven cation exchange in CeO2-x unit cell. Source data are provided as a Source Data file.
Fig. 3
Fig. 3. Asymmetric catalytic centers confer protein phosphatase-like characteristics to APROMs.
Local coordination environments and corresponding differential charge density maps of OH absorbed CeNPs (a) and APROM (b). Red and blue represent accumulation and depletion charge areas, respectively. Ce, yellow; Mn, brown; O, white; H, pink; C, dark gray. c Free-energy diagram of phospho-substrate hydrolysis on the APROM and CeNPs. Differential charge density maps of OH and phospho-substrate absorbed CeNPs (d) and APROM (e). f Bader charge of the O atom of OH before and after phospho-substrate absorption. A positive value indicates that the atom gains electrons. g DOS of CeNPs and the APROM. E = energy level, EFermi = Fermi level. PDOS of CeNPs (h) and the APROM (i). j Protein phosphatases-mimetic activity of APROMs and CeNPs by using P-Ser as the phospho-substrate (n = 3 independent experiments). k Raman spectra of APROM2 with and without incubation of P-Ser. The P-Ser is used as the phospho-substrate for the dephosphorylation reaction. F2g, the Raman-active vibrational mode of the cubic fluorite structure. l The Ce-to-Mn ratio of APROM2 before and after catalyzing phospho-substrate dephosphorylation. m In situ XRD of APROM2 under dephosphorylation reaction conditions. n Protein phosphatases-mimetic activity of APROM2 by using p-α-syn as the phospho-substrates (n = 3 independent experiments). Michaelis–Menten kinetics (o) and Lineweaver–Burk plotting (p) of APROM2 obtained by adding different concentrations of p-α-syn (n = 3 independent experiments). q Protein phosphatases-mimetic activity of APROM2 by using P-Tyr and P-Thr as the phospho-substrates (n = 3 independent experiments). All the data are presented as means ± s.e.m. Statistical significance was analyzed by one-way ANOVA with multiple comparisons test. Source data are provided as a Source Data file.
Fig. 4
Fig. 4. Asymmetric catalytic centers endow APROMs with exceptional antioxidant activity.
a SOD-mimetic activity of APROMs and CeNPs (n = 4 independent experiments). Michaelis–Menten kinetics (b) and Lineweaver–Burk plotting (c) of APROM2 obtained by adding different concentrations of xanthine (n = 3 independent experiments). d CAT-mimetic activity of APROMs and CeNPs (n = 3 independent experiments). Michaelis–Menten kinetics (e) and Lineweaver–Burk plotting (f) of APROM2 obtained by adding different concentrations of H2O2 (n = 3 independent experiments). g The free-energy diagrams for H2O2 decomposition on the APROM and CeNPs. Ce, yellow; Mn, brown; O, white; H, pink. Differential charge density maps of H2O2 adsorbed CeNPs (h) and APROM (i). Red and blue represent accumulation and depletion charge areas, respectively. The isosurface level is 0.005 arb. units. j Schematic illustration of the catalytic mechanism of H2O2 decomposition in the asymmetric catalytic center. H2O2 is decomposed at the Ce site of the asymmetric catalytic center, and then the formed O2 is transformed to the Mn site, so that the Ce site is regenerated for a new round of H2O2 decomposition. Moreover, O2 can be readily desorbed at the Mn site with a low energy barrier. All the data are presented as means ± s.e.m. Statistical significance was analyzed by one-way ANOVA with multiple comparisons test. Source data are provided as a Source Data file.
Fig. 5
Fig. 5. APROM2 reprograms neuronal protein functions via de novo PTMs to fuel synaptic function.
a Schematic illustration of the de novo PTM strategy of neuronal proteins using APROM2. APROM2 with protein phosphatase-like characteristics can dephosphorylate phospho-proteins, and thus restore the function of neuronal proteins. Created with BioRender.com. b Top, representative confocal laser scanning microscopy (CLSM) images of p-α-syn in primary neurons after different treatments. Bottom, 3D mapping of intracellular fluorescence. c Mean fluorescence intensity of p-α-syn in primary neurons after different treatments (n = 5 biologically independent cultures). Quantitative analysis (d) and representative CLSM images (e) of synaptic vesicle function indicated by FM1-43 after different treatments (n = 5 biologically independent cultures). Immunofluorescence and quantification analysis of the colocalization of α-syn with VMAT2 (f, h) or VAMP2 (g, i) in primary neurons after different treatments (n = 5 biologically independent cultures). j Microscopy images showing the neurite branches and neuronal connectivity of primary neurons after different treatments. k Intracellular ROS levels in primary neurons after different treatments. l, m Mitochondrial membrane potential (∆ψ) is indicated by JC-1 staining (l) and quantified by normalized JC-1 aggregates/monomers ratio (m) (n = 3 biologically independent cultures). JC-1 monomers (green) represent low ∆ψ, and JC-1 aggregates (red) represent high ∆ψ. n Protective effect of APROM2 and CeNPs on MPP+ treated cells (n = 5 biologically independent cultures). o Schematic illustration of APROM2 that reprograms α-syn function by the de novo PTM strategy and protects mitochondria for fueling synaptic function. APROM2 directly modulates p-α-syn by cleaving the phosphate monoester bond, thus, α-syn regains biological functions of binding to VMAT2 and VAMP2. In addition, APROM2 protects mitochondria against ROS to maintain presynaptic energy homeostasis. All the data are presented as means ± s.e.m. Statistical significance was analyzed by one-way ANOVA with multiple comparisons test. Source data are provided as a Source Data file.
Fig. 6
Fig. 6. APROM2 mediated synaptic plasticity improvement in vivo.
a Schematic illustration of APROM2 that protects dopaminergic neurons against neurodegeneration for rescuing motor coordination in PD. Created with BioRender.com. Behavioral evaluation of pole test (b) rotarod test (c) and hang test (d) of mice after different treatments (n = 9 biologically independent mice). Quantitative analysis (e) and representative immunohistochemical staining images (f) of TH positive neurons in the SN (n = 3 biologically independent mice). Regions of interest (white square) in the top panels are shown at higher magnification in the bottom panels. g Representative immunohistochemical staining images of dopaminergic fibers in the ST. Regions of interest (white square) in the top panels are shown at higher magnification in the bottom panels. h Schematic illustration of APROM2 that improves synaptic plasticity of dopaminergic neurons in PD. I hyperphosphorylation of α-syn and oxidative stress impair synaptic function of dopaminergic neurons. II, APROM2 dephosphorylates p-α-syn via protein phosphatase-mimetic activity and scavenges ROS via antioxidant activity. III, APROM2 reprograms α-syn biological function via the de novo PTM strategy and alleviates oxidative stress for fueling synaptic function. Created with BioRender.com. i Representative immunofluorescence staining images of p-α-syn in the SN and ST. j Representative immunohistochemical staining images of α-syn inclusion in the SN. Inset, higher magnification of dopaminergic neurons. Co-immunoprecipitation of VMAT2 with α-syn (k) or p-α-syn (l) in the midbrain of APROM2 treated PD mice. Representative immunofluorescence staining images and colocalization analysis along the white line of α-syn with VMAT2 (m) or VAMP2 (n). o Bio-TEM images of synaptic vesicles in the SN of mice after different treatments. Regions of interest (red square) in the top panels are shown at a higher magnification in the bottom panels. p Representative immunofluorescence staining images of 4-HNE. q Schematic of the midbrain section and histological assay with H&E staining for the SN and ST of APROM2 treated mice. All the data are presented as means ± s.e.m. Statistical significance was analyzed by one-way ANOVA with multiple comparisons test. Source data are provided as a Source Data file.

Similar articles

Cited by

References

    1. Conibear AC. Deciphering protein post-translational modifications using chemical biology tools. Nat. Rev. Chem. 2020;4:674–695. doi: 10.1038/s41570-020-00223-8. - DOI - PubMed
    1. Yu Z-H, Zhang Z-Y. Regulatory mechanisms and novel therapeutic targeting strategies for protein tyrosine phosphatases. Chem. Rev. 2018;118:1069–1091. doi: 10.1021/acs.chemrev.7b00105. - DOI - PMC - PubMed
    1. Needham EJ, Parker BL, Burykin T, James DE, Humphrey SJ. Illuminating the dark phosphoproteome. Sci. Signal. 2019;12:eaau8645. doi: 10.1126/scisignal.aau8645. - DOI - PubMed
    1. Shi Y. Serine/threonine phosphatases: Mechanism through structure. Cell. 2009;139:468–484. doi: 10.1016/j.cell.2009.10.006. - DOI - PubMed
    1. Hunter T. Protein kinases and phosphatases: The Yin and Yang of protein phosphorylation and signaling. Cell. 1995;80:225–236. doi: 10.1016/0092-8674(95)90405-0. - DOI - PubMed

Substances