

Gene expression analyses reveal differences in children's response to malaria according to their age
- PMID: 38448421
- PMCID: PMC10918175
- DOI: 10.1038/s41467-024-46416-3
Gene expression analyses reveal differences in children's response to malaria according to their age
Abstract
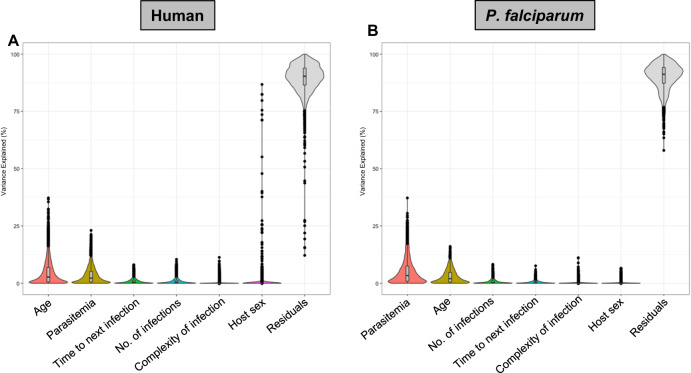
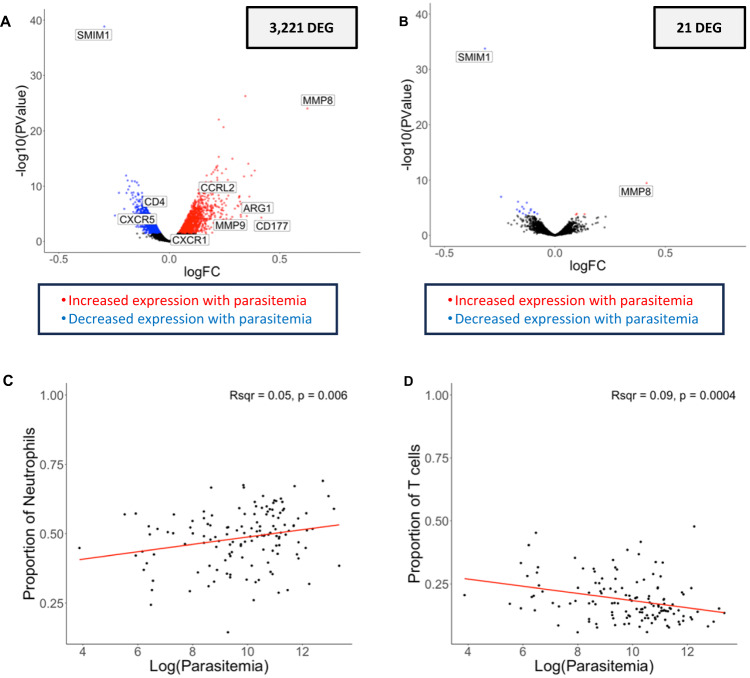
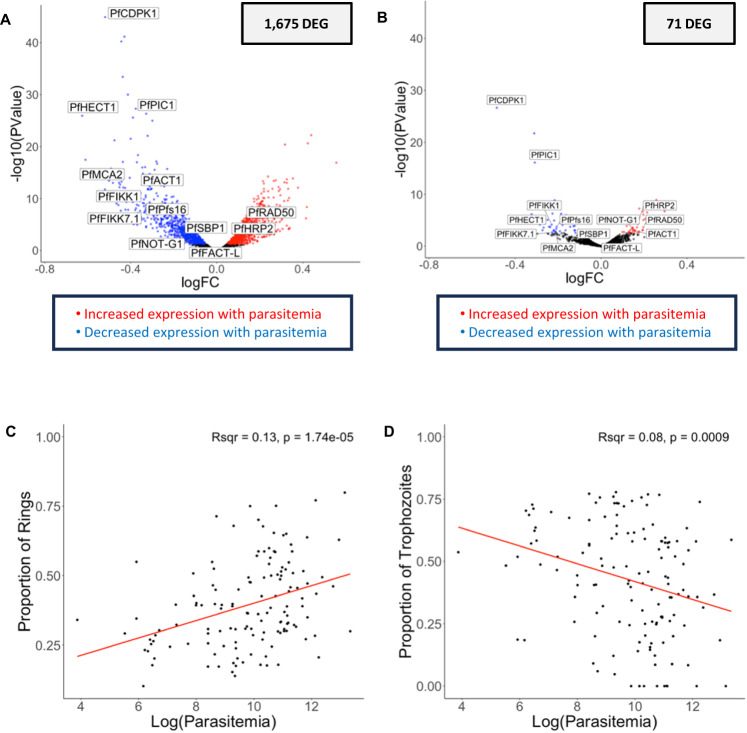
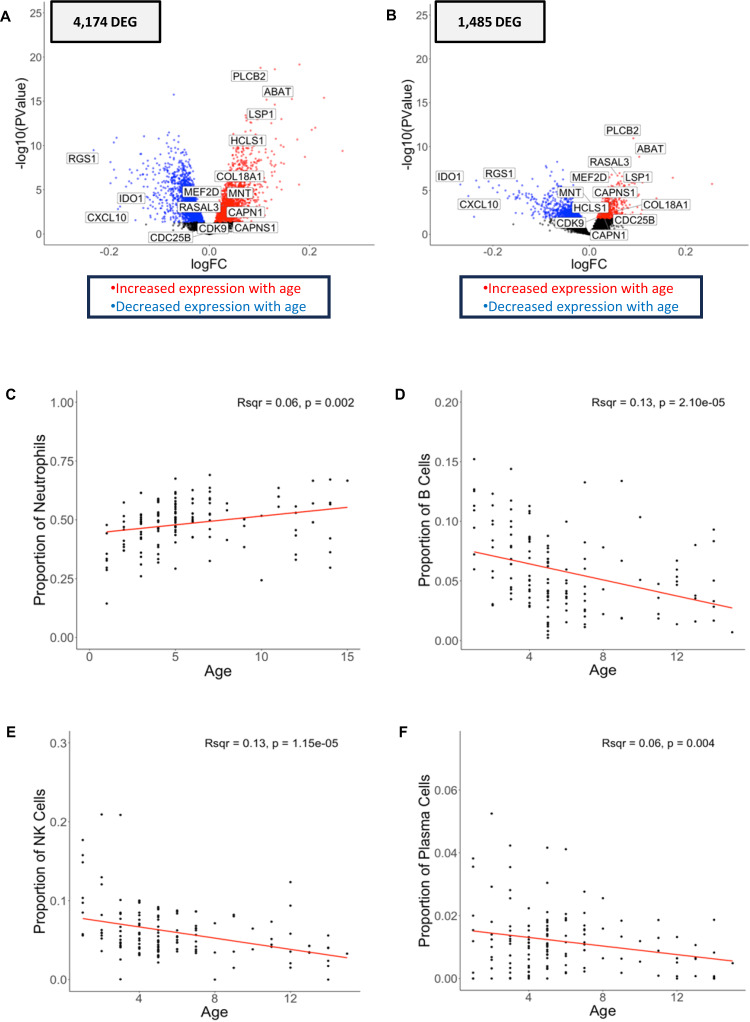
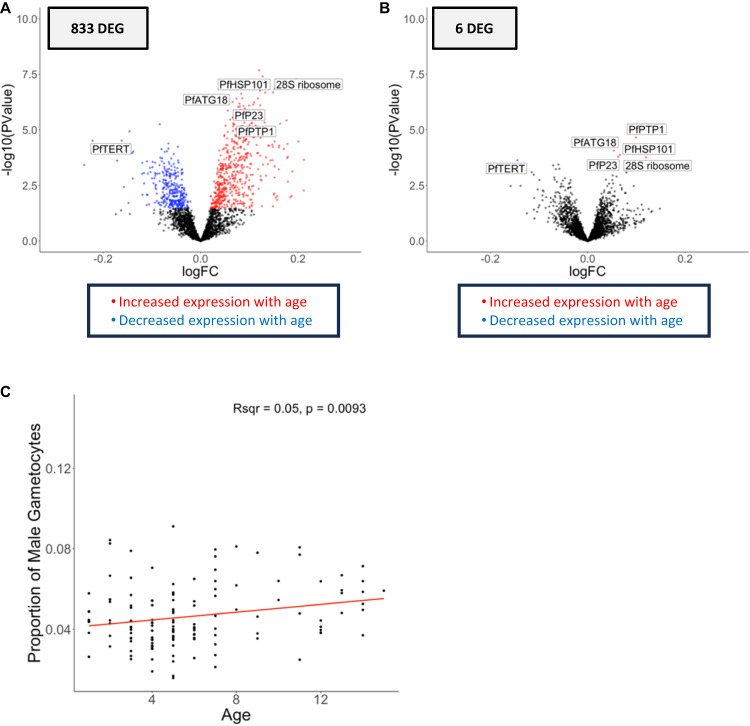
In Bandiagara, Mali, children experience on average two clinical malaria episodes per year. However, even in the same transmission area, the number of uncomplicated symptomatic infections, and their parasitemia, can vary dramatically among children. We simultaneously characterize host and parasite gene expression profiles from 136 Malian children with symptomatic falciparum malaria and examine differences in the relative proportion of immune cells and parasite stages, as well as in gene expression, associated with infection and or patient characteristics. Parasitemia explains much of the variation in host and parasite gene expression, and infections with higher parasitemia display proportionally more neutrophils and fewer T cells, suggesting parasitemia-dependent neutrophil recruitment and/or T cell extravasation to secondary lymphoid organs. The child's age also strongly correlates with variations in gene expression: Plasmodium falciparum genes associated with age suggest that older children carry more male gametocytes, while variations in host gene expression indicate a stronger innate response in younger children and stronger adaptive response in older children. These analyses highlight the variability in host responses and parasite regulation during P. falciparum symptomatic infections and emphasize the importance of considering the children's age when studying and treating malaria infections.
© 2024. The Author(s).
Conflict of interest statement
The authors declare no competing interests.
Figures
Update of
-
Gene expression analyses reveal differences in children's response to malaria according to their age.Res Sq [Preprint]. 2023 Oct 27:rs.3.rs-3487114. doi: 10.21203/rs.3.rs-3487114/v1. Res Sq. 2023. Update in: Nat Commun. 2024 Mar 6;15(1):2021. doi: 10.1038/s41467-024-46416-3. PMID: 37961587 Free PMC article. Updated. Preprint.
-
Gene expression analyses reveal differences in children's response to malaria according to their age.bioRxiv [Preprint]. 2023 Oct 26:2023.10.24.563751. doi: 10.1101/2023.10.24.563751. bioRxiv. 2023. Update in: Nat Commun. 2024 Mar 6;15(1):2021. doi: 10.1038/s41467-024-46416-3. PMID: 37961701 Free PMC article. Updated. Preprint.
Similar articles
-
Gene expression analyses reveal differences in children's response to malaria according to their age.Res Sq [Preprint]. 2023 Oct 27:rs.3.rs-3487114. doi: 10.21203/rs.3.rs-3487114/v1. Res Sq. 2023. Update in: Nat Commun. 2024 Mar 6;15(1):2021. doi: 10.1038/s41467-024-46416-3. PMID: 37961587 Free PMC article. Updated. Preprint.
-
Gene expression analyses reveal differences in children's response to malaria according to their age.bioRxiv [Preprint]. 2023 Oct 26:2023.10.24.563751. doi: 10.1101/2023.10.24.563751. bioRxiv. 2023. Update in: Nat Commun. 2024 Mar 6;15(1):2021. doi: 10.1038/s41467-024-46416-3. PMID: 37961701 Free PMC article. Updated. Preprint.
-
Integrated pathogen load and dual transcriptome analysis of systemic host-pathogen interactions in severe malaria.Sci Transl Med. 2018 Jun 27;10(447):eaar3619. doi: 10.1126/scitranslmed.aar3619. Sci Transl Med. 2018. PMID: 29950443 Free PMC article.
-
Transcriptional profiling of Plasmodium falciparum parasites from patients with severe malaria identifies distinct low vs. high parasitemic clusters.PLoS One. 2012;7(7):e40739. doi: 10.1371/journal.pone.0040739. Epub 2012 Jul 18. PLoS One. 2012. PMID: 22815802 Free PMC article.
-
Clinical and parasitological studies on immunity to Plasmodium falciparum malaria in children.Scand J Infect Dis Suppl. 1996;102:1-53. Scand J Infect Dis Suppl. 1996. PMID: 9060051 Review.
Cited by
-
Immune gene expression changes more during a malaria transmission season than between consecutive seasons.Microbiol Spectr. 2024 Oct 3;12(10):e0096024. doi: 10.1128/spectrum.00960-24. Epub 2024 Aug 20. Microbiol Spectr. 2024. PMID: 39162546 Free PMC article.
References
-
- World malaria report 2022. Geneva: World Health Organization; 2022. Licence: CC BY-NC-SA 3.0 IGO.
MeSH terms
Grants and funding
LinkOut - more resources
Full Text Sources
Medical
