. 2024 Mar 6;15(1):2054.
doi: 10.1038/s41467-024-46310-y.

Development of ISB 1442, a CD38 and CD47 bispecific biparatopic antibody innate cell modulator for the treatment of multiple myeloma

Affiliations

Development of ISB 1442, a CD38 and CD47 bispecific biparatopic antibody innate cell modulator for the treatment of multiple myeloma

C Grandclément et al. Nat Commun. .

Abstract

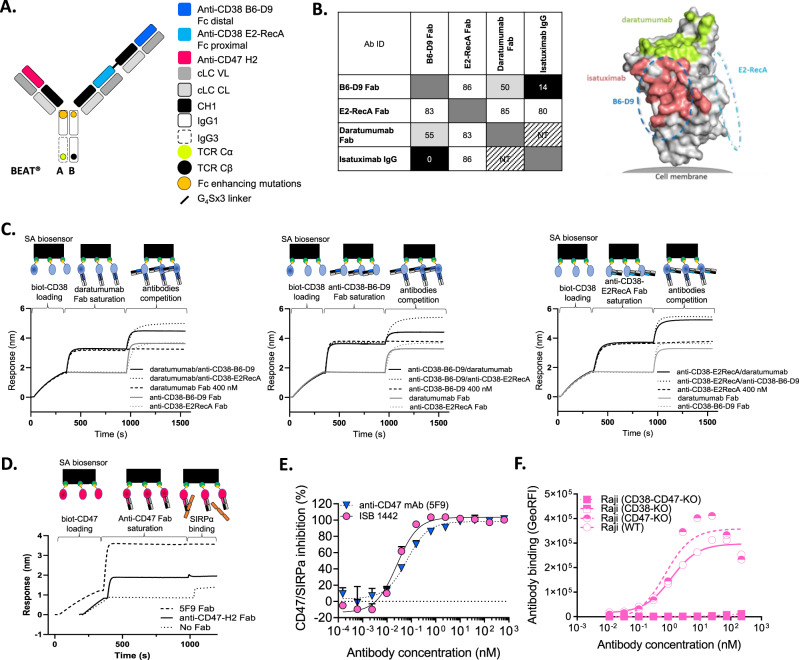
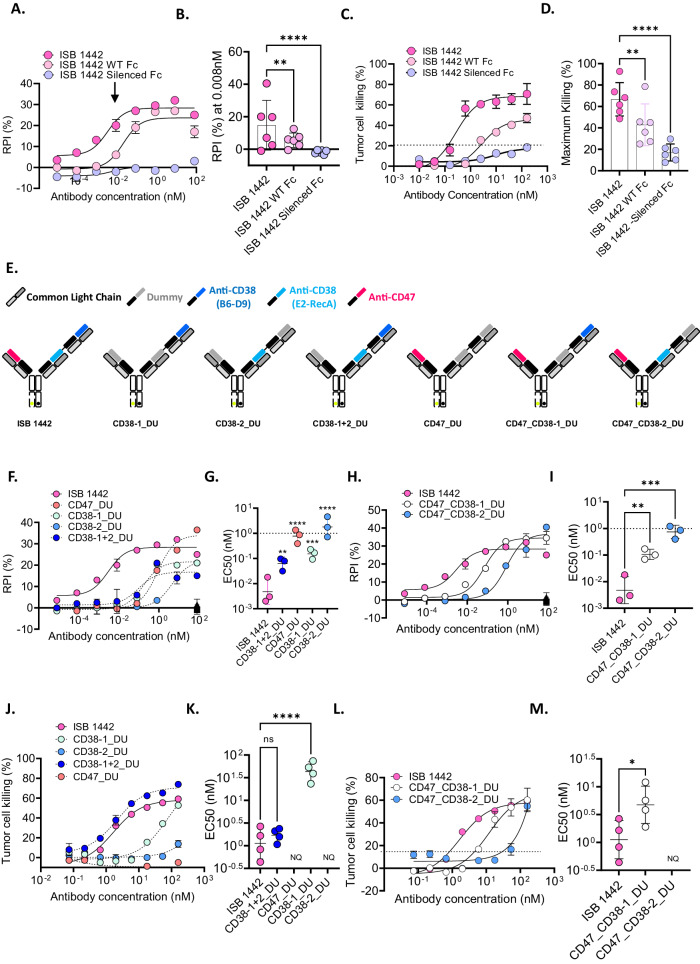
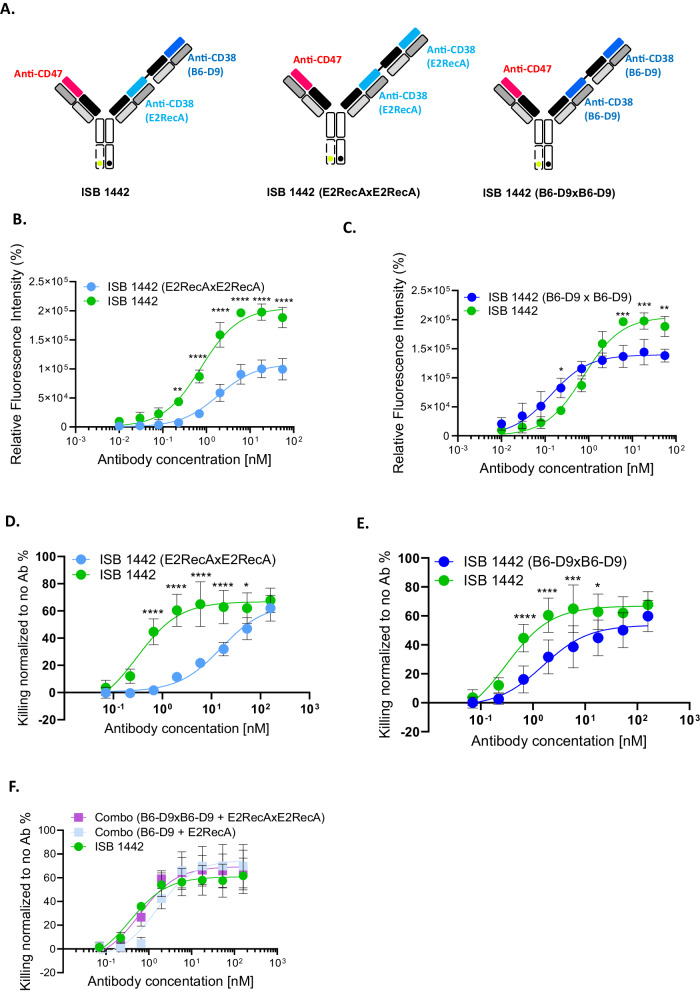
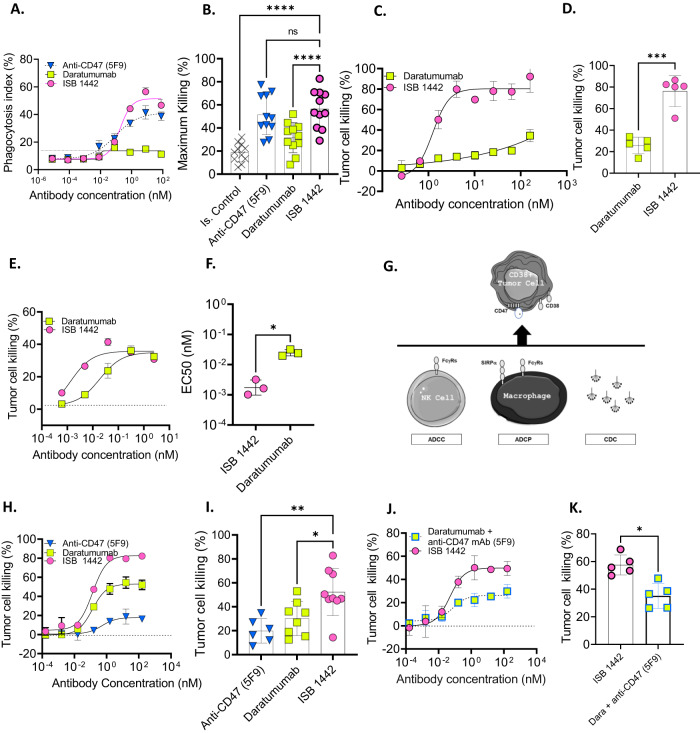
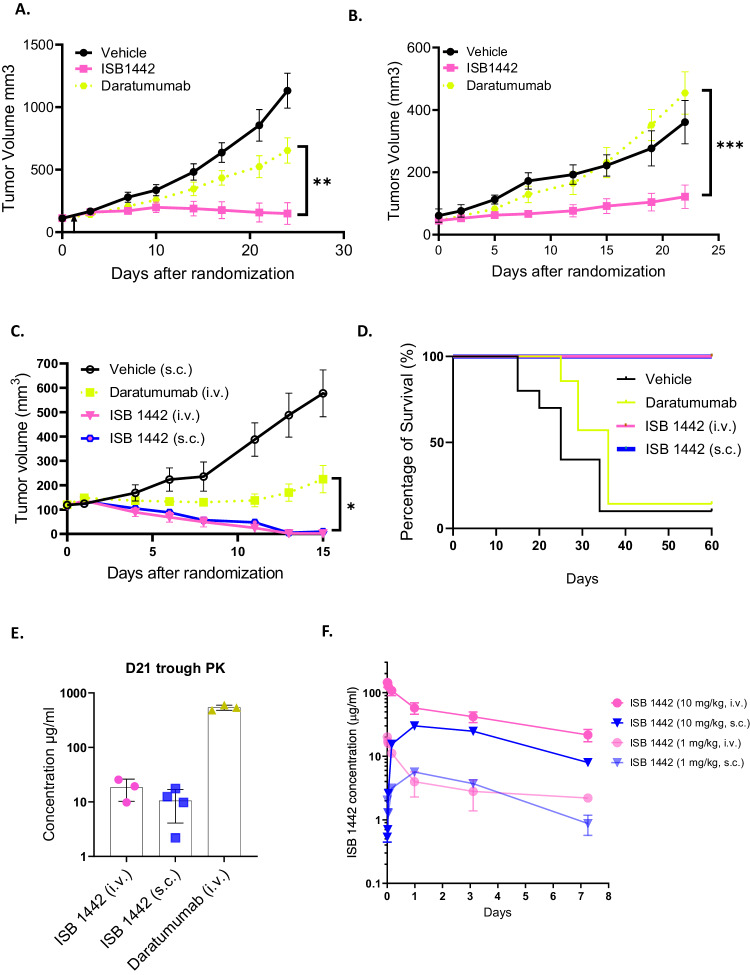
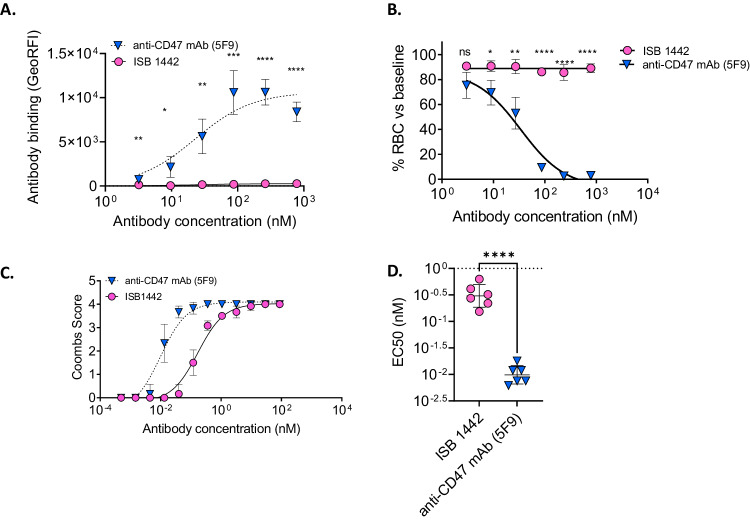
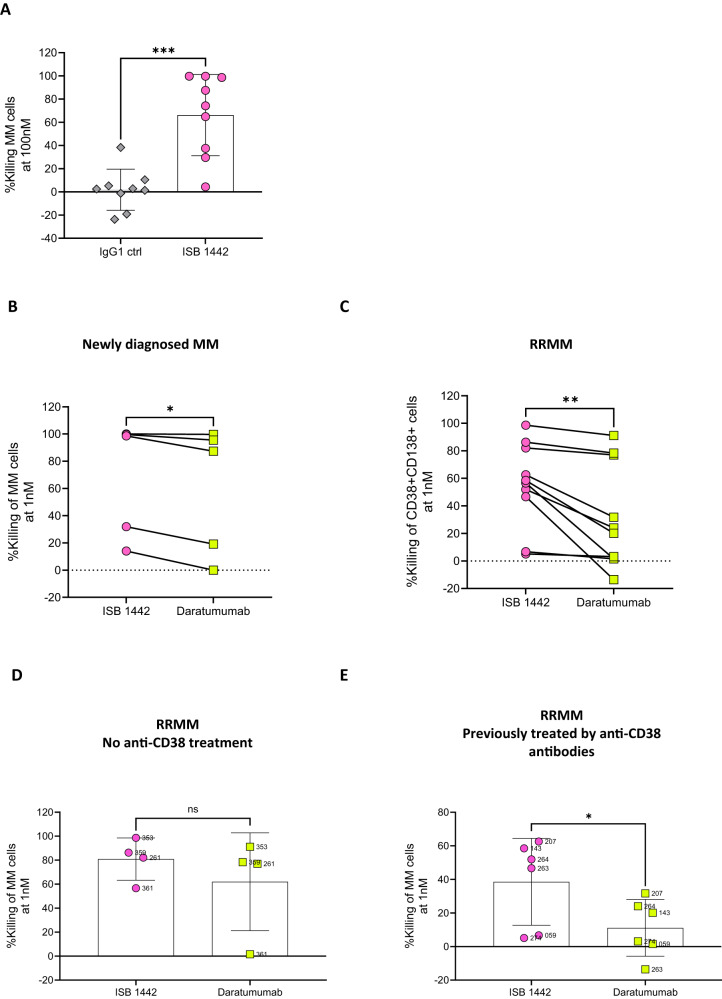
Antibody engineering can tailor the design and activities of therapeutic antibodies for better efficiency or other advantageous clinical properties. Here we report the development of ISB 1442, a fully human bispecific antibody designed to re-establish synthetic immunity in CD38+ hematological malignancies. ISB 1442 consists of two anti-CD38 arms targeting two distinct epitopes that preferentially drive binding to tumor cells and enable avidity-induced blocking of proximal CD47 receptors on the same cell while preventing on-target off-tumor binding on healthy cells. The Fc portion of ISB 1442 is engineered to enhance complement dependent cytotoxicity, antibody dependent cell cytotoxicity and antibody dependent cell phagocytosis. ISB 1442 thus represents a CD47-BsAb combining biparatopic targeting of a tumor associated antigen with engineered enhancement of antibody effector function to overcome potential resistance mechanisms that hamper treatment of myeloma with monospecific anti-CD38 antibodies. ISB 1442 is currently in a Phase I clinical trial in relapsed refractory multiple myeloma.


Conflict of interest statement

D.E., P.M., M.T., L.J., L.V., D.A., D.C., D.A.S., C.L.N., D.M.R., Z.E.A., P.M. and S.S. are current employees of Ichnos Sciences. G.C., E.C., R.A., F.J., B.S., M.E., C.M., M.M.L. and S.A. are former employees of Ichnos Sciences. The remaining authors declare no competing interests.

Figures

Fig. 1
Fig. 1. Generation of ISB 1442, a biparatopic CD38 x CD47 bispecific antibody based on the BEAT® platform.
A Schematic view of ISB 1442. Anti-CD38 variable heavy chains (VH) are shown in two different shades of blue. VH of anti-CD47 is depicted in red. All Fab domains make use of an identical common light chain (cLC). Variable (VL) and constant (CL) domains are depicted in gray. Chain A encompasses an engineered human IgG1 CH2 domain with an engineered human IgG3 CH3 domain. Chain B has engineered human IgG1 CH2 and CH3 domains. The BEAT® interface proprietary mutations based on the T cell receptor constant domains alpha (TCR Cα) and beta (TCR Cβ) are depicted by the yellow and black dots. Fc enhancing mutations are depicted by the orange dots. CH constant heavy chain. B Left panel: epitope binning results showing plot of saturating antibody in rows against competing antibodies in columns. Values indicate relative percentage of binding of competing antibody to CD38 and are shaded in black, light gray or white whether antibodies are competing, partially competing or non-competing, respectively. Self-blocks are outlined by a dark-gray box. NT not tested. Ab ID antibody identification. Right panel: surface representation of CD38 illustrating the hypothetical epitope bins for B6-D9 (blue dash line) and E2RecA (cyan dash line). The epitopes of daratumumab (PDB 7DHA) and isatuximab (PDB 4CMH) are colored as red and green, respectively. C Competition binding assay by Bio-Layer Interferometry (BLI) between anti-CD38-B6-D9 Fab, anti-CD38-E2RecA Fab and daratumumab Fab for binding to CD38. Plots show binding to the sensor tip as a wavelength shift (Response) over time. Curves are labeled by antibodies solution in competition phase. SA streptavidin. D Competition binding assay by BLI show blocking of the CD47-SIRPα interaction by anti-CD47-H2 Fab or magrolimab (hu5F9) Fab. Curves are labeled by saturating Fab. E Inhibition of the SIRPα-CD47 interaction on CD38high (Daudi) cells by increasing concentrations of ISB 1442 in 2 + 1 bispecific format or anti-CD47 mAb (hu5F9, magrolimab). Representative experiment of at least three independent biological repetitions. Dots represent the mean + SD of n = 2 technical replicates. F Cell-based binding of ISB 1442 in 2:1 bispecific format to Raji cells WT, Raji CD47-KO, Raji CD38-KO and Raji CD47 and CD38 double KO cells. N = 1.
Fig. 2
Fig. 2. Optimization of ISB 1442 architecture and Fc functions.
A Representative curves of relative phagocytosis index (RPI) of CD38low MM cells (KMS-12-BM) induced by ISB 1442 (enhanced Fc) or its respective WT or silenced Fc variants. Dots represent the mean ± SD of n = 2 of technical replicates. B Cumulative data of RPI as in (A). Bars represent mean values of phagocytosis ± SD for 6 donors measured at 0.008 nM (close to the EC50; visualized by an arrow in A). C Representative curves of CDC on CD38high (Daudi) tumor cells. Dots represent the mean ± SD of n = 2 of technical replicates. D Cumulative data of CDC as in (C). Bars represent the mean of maximal killing ± SD in 6 independent experiments. E Schematic view of ISB 1442 or its dummy controls. Gray Fabs represent the dummy binders (DU). FM ADCP and CDC induced by ISB 1442 or its dummy controls. FH Representative curves of RPI on CD38low MM cells (KMS-12-BM). Dots represent the mean ± SD of n = 2 of technical replicates. GI Cumulative data of EC50 of phagocytosis as in (FH). Bars represent mean values of RPI ± SD for 3 donors. JL Representative curves of CDC on CD38high (Daudi) tumor cells. KM Cumulative data of EC50 of phagocytosis of CDC as in JL Bars represent mean values of maximal killing ± SD in 4 independent experiments. Statistics for (BDGIKM): One-Way Anova with Tukey’s multi comparison test, with a single pooled variance. Ns not significant, *p < 0.05, ***p < 0.001, ****p < 0.0001, ****p < 0.0001.
Fig. 3
Fig. 3. Biparatopic versus monoparatopic CD38 targeting.
A Schematic view of ISB 1442 or 2 + 1 monoparatopic formats. B, C Representative curves of relative fluorescent intensity of CD38high cells (Daudi) induced by ISB 1442 or its 2 + 1 monoparatopic formats. Dots represent the mean ± SD of n = 3 of biologically independent experiments. D, E Representative curves of CDC on CD38high (Daudi) tumor cells induced by ISB 1442 or its 2 + 1 monoparatopic formats. Bars represent the mean of maximal killing ± SD in 3 independent experiments. Dots represent the mean ± SD of n = 6 of biologically independent experiments. F Representative curves of CDC on CD38high (Daudi) tumor cells induced by ISB 1442 or its 1 + 1 or 2 + 1 monoparatopic formats. Bars represent the mean of maximal killing ± SD in 3 independent experiments. No statistical difference between any condition tested (RM 2-ways Anova). Dots represent the mean ± SD of n = 6 of biologically independent experiments. Statistics of BE: *p < 0.05; **p < 0.01; ***p < 0.001; ****p < 0.0001 (RM 2-ways Anova).
Fig. 4
Fig. 4. Potency of ISB 1442 compared to anti-CD38 and anti-CD47 monospecific antibody benchmarks.
A Representative curves of phagocytosis index on CD38low multiple myeloma cells (KMS-12-BM). Dots represent the mean + SD of n = 3 of technical replicates. B Cumulative phagocytosis data as in (A). Bars represent mean (± Standard Deviation [SD]) of maximal killing for 11 donors. C Representative curves of CDC on CD38high (Daudi) cells. Dots represent the mean + SD of n = 2 of technical replicates. D Cumulative CDC data as in (C). Bars represents mean ± SD of maximal CDC in 5 independent experiments. E Representative curves of ADCC on CD38+ multiple myeloma cells (NCI-H929). Dots represent the mean + SD of n = 2 of technical replicates. F Cumulative EC50 of ADCC data as in (E). Bars represent mean of EC50 + /-SD for 3 donors. G Cartoon representing MMOAK assay. H Representative curves of MMOAK on CD38+ multiple myeloma cells (NCI-H929). Dots represent the mean + SD of n = 2 of technical replicates. I Cumulative MMOAK data as in (H). Bars represent mean of maximal killing ±SD for 9 donors. J Representative MMOAK on CD38+ multiple myeloma cells (NCI-H929) of increasing concentrations of ISB 1442 in comparison to increasing concentrations of daratumumab in combination with anti-CD47 (hu5F9) used at fixed 160 nM. Dots represent the mean + SD of n = 2 of technical replicates. K Cumulative MMOAK data as in (J). Bars represents maximal killing ±SD for 5 donors. Statistics for BDFIK: One-Way Anova with Tukey’s multi comparison test, with a single pooled variance. Ns: not significant, *p < 0.05; **p < 0.01; ***p < 0.001; ****p < 0.0001.
Fig. 5
Fig. 5. ISB 1442 shows improved tumor growth inhibition compared to daratumumab in preclinical mouse models.
A. CB17/SCID mice (N = 5) engrafted with Raji cells (CD38high) randomized on D12 and treated intravenously immediately with ISB 1442 at 10 mg/kg weekly, daratumumab at 16 mg/kg twice weekly and PBS (vehicle). B CB17/SCID mice (N = 5) engrafted with KMS-12-BM cells (CD38 low) randomized on D15 and treated immediately with ISB 1442 at 10 mg/kg weekly, daratumumab at 16 mg/kg biweekly and PBS (vehicle). C CB17/SCID mice engrafted with Raji cells treated twice weekly with daratumumab at 16 mg/kg intravenously (i.v.), and ISB 1442 at 3 mg/kg both intravenously (i.v.) and subcutaneously (s.c.). D Kaplan–Meier survival curve for experiment shown in panel C excluding 3 mice taken randomly for terminal analysis from each group at D15 unless they had reached the experimental endpoint (N = 6–9), survival endpoint was deemed to be reached when animals exceeded maximum permissible tumor volume of 1000 mm3. E Trough PK samples from 21 days post randomization (3 days post last dose) of study shown in (C, D). F PK time course at 1 and 10 mg/kg doses of ISB 1442 subcutaneously (s.c.) and intravenously (i.v.) in BALB/c nude mice (N = 4). Statistical evaluation by 1-way ANOVA followed by Tukeys post hoc test on final day of experiment prior to the humane endpoint for the second mouse in any group (AC). Log Rank (Mantel Cox) test used to evaluate significance of difference in (D). P values for tests presented on (AC) A P = 0.0076, B P = 0.0009, C P = 0.016 (IV vs. Dara) 0.0222 (SC vs. Dara) Ns: not significant, *p < 0.05; **p < 0.01; ***p < 0.001; ****p < 0.0001.
Fig. 6
Fig. 6. On-target off-tumor on RBCs.
A Means of the binding of ISB 1442 and hu5F9 on human fresh RBCs from 6 independent donors at increasing concentrations. Each dot represents a biological replicate (±SD). Statistics: *p < 0.05 **p < 0.01 ***p < 0.001 ****p < 0.0001 (RM 2-ways Anova). B RBCs quantification using hematology analyzer. Dose-response of RBCs depletion (in %) as a function of ISB 1442 or hu5F9 concentrations with 6 independent human fresh peripheral blood donors. Statistics: *p < 0.05 **p < 0.01 ***p < 0.001 ****p < 0.0001 (RM 2-ways Anova). C Indirect antiglobulin Coombs test. Dose–response of the indirect Coombs score as a function of ISB 1442 or hu5F9 concentrations with 6 independent human fresh peripheral blood donors. D Scatter dot plot showing mean ± SD of EC50 of coombs score as in (C). Each dot represents a biological replicate. Statistics: One-Way Anova with Tukey’s multi comparison test. ****p < 0.0001.
Fig. 7
Fig. 7. ISB 1442 induced killing of tumor cells in MM patient samples ex vivo.
A Compiled analysis of CD138 + CD38+ cell killing induced by ISB 1442 as compared to isotype control (IgG1) antibody (n = 9 bone-marrow samples). BC. Compiled analysis of CD38 + CD138+ cell killing induced by ISB 1442 at 1 nM in 5 newly diagnosed patient samples (B) and in 10 RRMM patient sample (C). D, E Compiled analysis of killing induced by ISB 1442 in RRMM samples with no prior anti-CD38 mAb treatments (D) or previously exposed to anti-CD38 therapies (E Patients 274 and 263 treated with isatuximab, patients 207, 264, 143, 059 treated with daratumumab). Statistics for panels AE: two tailed paired T-test, *p < 0.05; **p < 0.01; ***p < 0.001.

References

    1. Baumeister SH, Freeman GJ, Dranoff G, Sharpe AH. Coinhibitory pathways in immunotherapy for cancer. Annu. Rev. Immunol. 2016;34:539–573. doi: 10.1146/annurev-immunol-032414-112049. - DOI - PubMed
    1. Ravi, G. & Costa, L. J. Bispecific T-cell engagers for treatment of multiple myeloma. Am. J. Hematol. 10.1002/ajh.26628 (2022). - PubMed
    1. Scott AM, Wolchok JD, Old LJ. Antibody therapy of cancer. Nat. Rev. Cancer. 2012;12:278–287. doi: 10.1038/nrc3236. - DOI - PubMed
    1. Cozar B, et al. Tumor-infiltrating natural killer cells. Cancer Discov. 2021;11:34–44. doi: 10.1158/2159-8290.CD-20-0655. - DOI - PMC - PubMed
    1. Meyer S, Leusen JH, Boross P. Regulation of complement and modulation of its activity in monoclonal antibody therapy of cancer. MAbs. 2014;6:1133–1144. doi: 10.4161/mabs.29670. - DOI - PMC - PubMed

MeSH terms