. 2024 Mar 6;15(1):2053.
doi: 10.1038/s41467-024-46417-2.

SARS-CoV-2 virulence factor ORF3a blocks lysosome function by modulating TBC1D5-dependent Rab7 GTPase cycle

Affiliations

SARS-CoV-2 virulence factor ORF3a blocks lysosome function by modulating TBC1D5-dependent Rab7 GTPase cycle

Kshitiz Walia et al. Nat Commun. .

Abstract

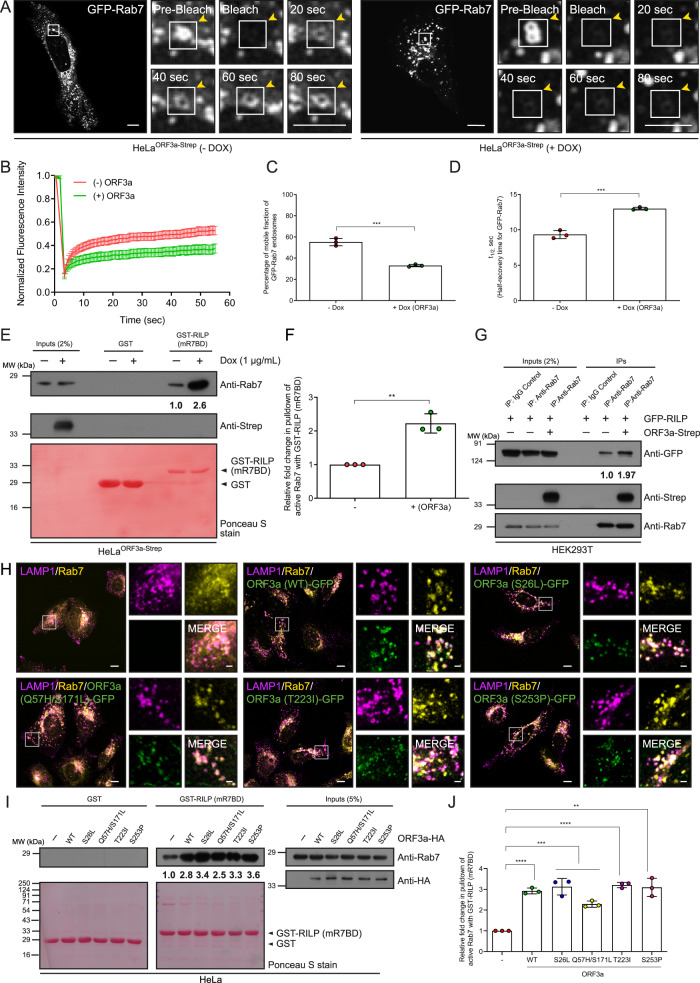
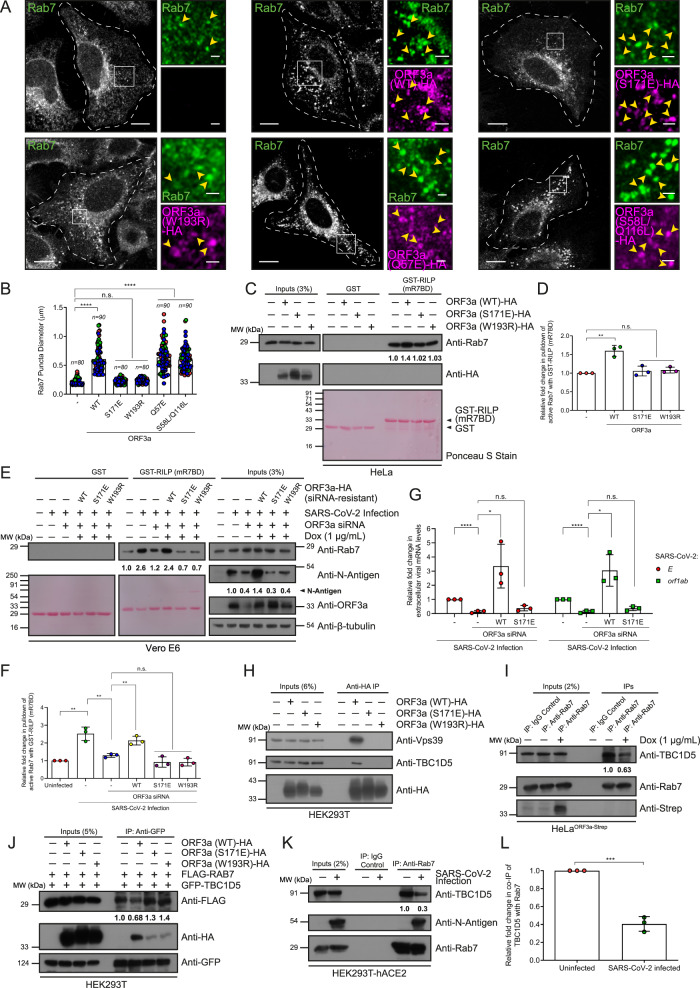
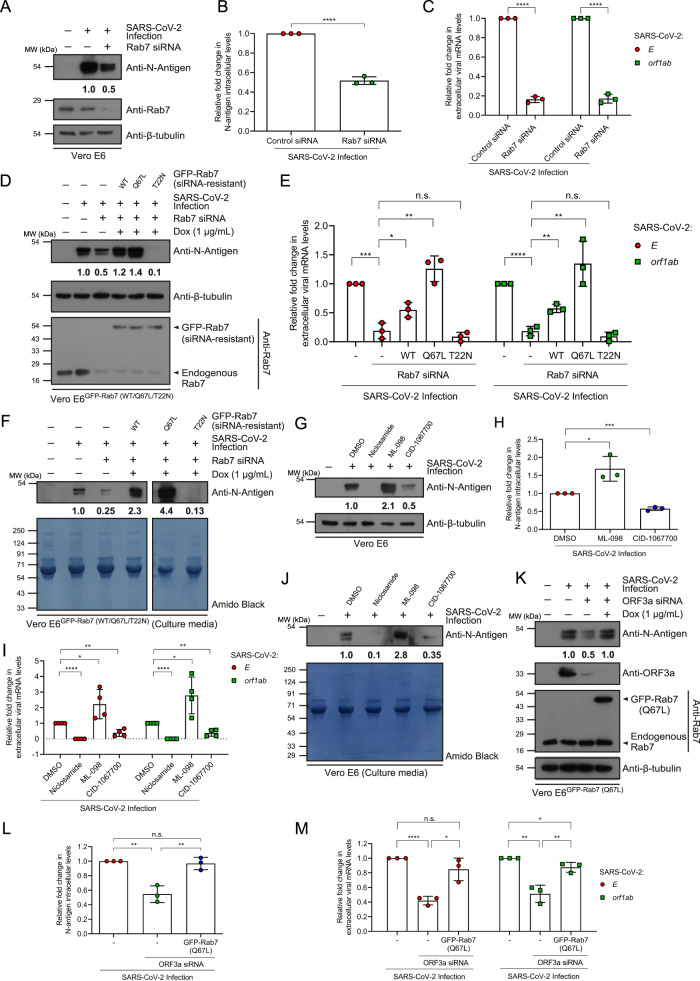
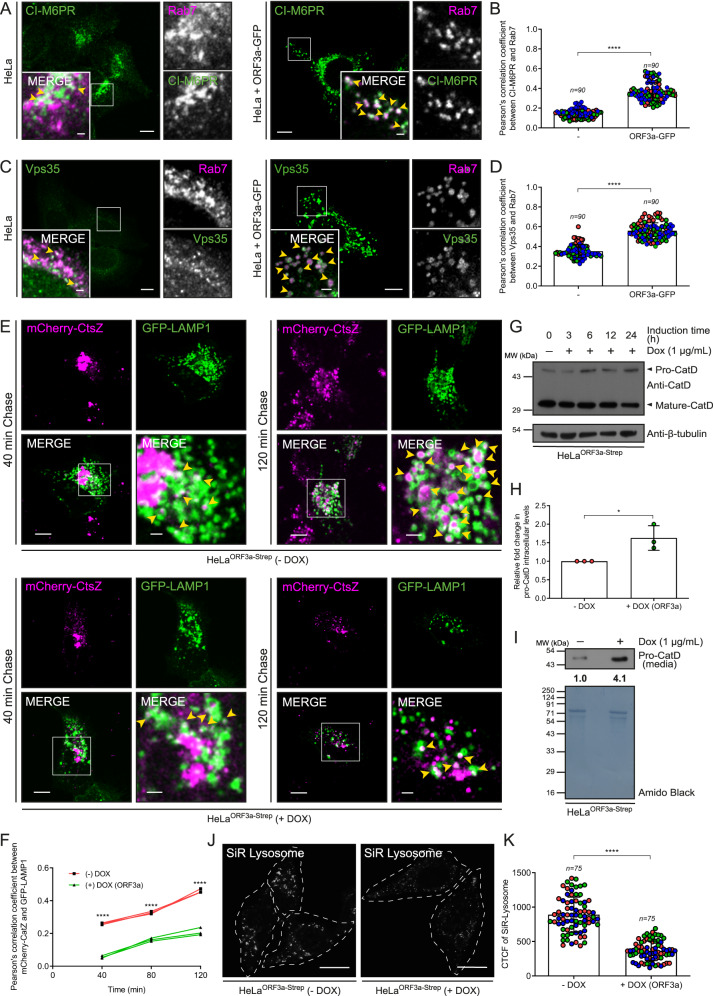
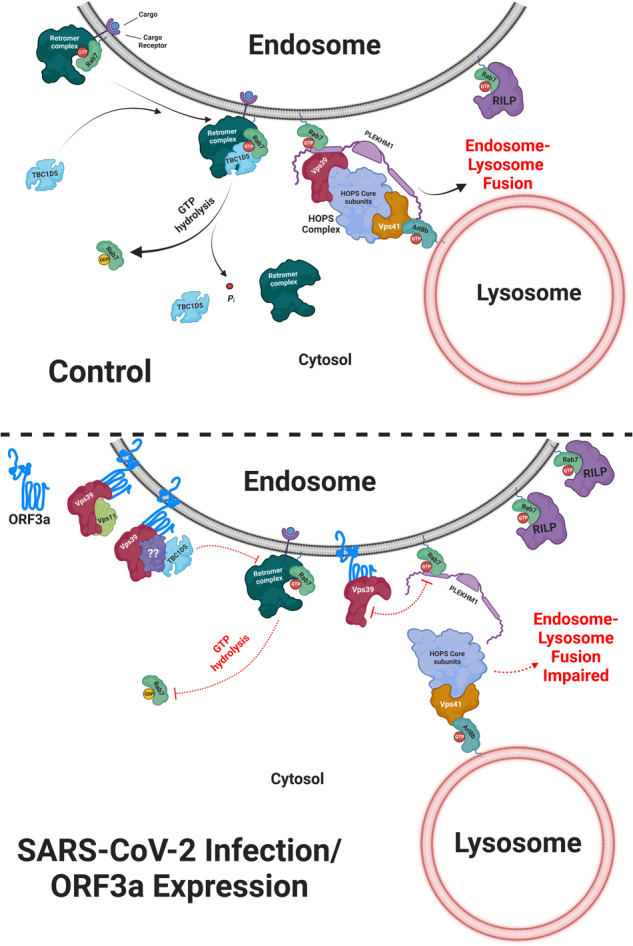
SARS-CoV-2, the causative agent of COVID-19, uses the host endolysosomal system for entry, replication, and egress. Previous studies have shown that the SARS-CoV-2 virulence factor ORF3a interacts with the lysosomal tethering factor HOPS complex and blocks HOPS-mediated late endosome and autophagosome fusion with lysosomes. Here, we report that SARS-CoV-2 infection leads to hyperactivation of the late endosomal and lysosomal small GTP-binding protein Rab7, which is dependent on ORF3a expression. We also observed Rab7 hyperactivation in naturally occurring ORF3a variants encoded by distinct SARS-CoV-2 variants. We found that ORF3a, in complex with Vps39, sequesters the Rab7 GAP TBC1D5 and displaces Rab7 from this complex. Thus, ORF3a disrupts the GTP hydrolysis cycle of Rab7, which is beneficial for viral production, whereas the Rab7 GDP-locked mutant strongly reduces viral replication. Hyperactivation of Rab7 in ORF3a-expressing cells impaired CI-M6PR retrieval from late endosomes to the trans-Golgi network, disrupting the biosynthetic transport of newly synthesized hydrolases to lysosomes. Furthermore, the tethering of the Rab7- and Arl8b-positive compartments was strikingly reduced upon ORF3a expression. As SARS-CoV-2 egress requires Arl8b, these findings suggest that ORF3a-mediated hyperactivation of Rab7 serves a multitude of functions, including blocking endolysosome formation, interrupting the transport of lysosomal hydrolases, and promoting viral egress.


Conflict of interest statement

The authors declare no competing interests.

Figures

Fig. 1
Fig. 1. ORF3a localizes to lysosomes and inhibits endocytic cargo degradation.
AC Confocal images of HeLa cells expressing ORF3a-GFP stained for the indicated organelle markers. Arrowheads in the insets indicate colocalized pixels. Scale bars: 10 µm (main); 2 µm (inset). D Pearson’s colocalization coefficient (PCC) quantification of ORF3a-GFP with the indicated markers, n = 75 cells examined over three independent experiments. E Representative TEM images of untreated and Dox-treated HeLaORF3a-Strep cells. The inset indicates multivesicular and multilamellar compartments. Scale bars: 2 µm (main); 0.5 µm (inset). Quantification of the size (F) and number (G) of multi-vesicular and multi-lamellar compartments in untreated and Dox-treated HeLaORF3a-Strep cells using TEM images, p < 0.0001 (F) and p = 0.0009 (G). Note: n in (G) represents the number of multi-vesicular and multi-lamellar compartments analyzed. H Untreated and Dox-treated HeLaORF3a-Strep cells were serum-starved and pulsed with EGF for the indicated time periods. Cell lysates were immunoblotted (IB) for proteins indicated, n = 3. The numbers represent densitometric analysis of the EGFR band intensity normalized to the β-tubulin. IK Confocal micrographs of untreated, and Dox-treated HeLaORF3a-Strep cells treated with EGF for 15 min (pulse only) and chased for the indicated time periods, followed by immunostaining with an anti-EGFR antibody. Scale bars: 10 µm. The degradation of EGFR (J) was evaluated using confocal micrographs by normalizing the residual mean EGFR fluorescence intensity at pulse only, 15 min, 45 min and 105 min time points to the mean EGFR fluorescence intensity in the pulse-only sample. For -DOX, n = 109, 92, 100 and 116 cells and for +DOX, n = 100, 100, 98 and 100 cells, respectively examined over three independent experiments, p = 0.103 (15 min), 0.0067 (45 min), 0.0033 (105 min). K PCC quantification of EGFR with LAMP1 was calculated, n = 90 cells examined over three independent experiments, p < 0.0001. L Representative histogram of the dequenched BODIPY-FL-BSA signal in untreated and Dox-treated HeLaORF3a-Strep cells as analyzed by flow cytometry; the graph represents the relative percentage of Mean Fluorescence Intensity for dequenched BODIPY-FL-BSA calculated, n = 3, p = 0.0052. Quantified results are presented as mean ± S.D. using unpaired two-tailed Student’s t test.
Fig. 2
Fig. 2. ORF3a binds to the HOPS subunit Vps39 and inhibits the interaction between Vps39 and PLEKHM1.
A Untransfected and ORF3a-Strep-transfected HEK293T cell lysates were incubated with streptavidin-sepharose beads. The precipitates were IB with the indicated antibodies, n = 2. B GFP- and ORF3a-Strep-expressing HeLa cell lysates were incubated with streptavidin-sepharose beads. The precipitates were subjected to IB with the indicated antibodies, n = 2. C Lysates of HEK293T cells expressing the indicated proteins were immunoprecipitated (IP) with anti-FLAG antibodies conjugated beads and subjected to IB with the indicated antibodies, n = 2. The values represent the densitometric analysis of the HA-Vps39 band intensity normalized to the input and direct IP of FLAG-PLEKHM1. D Lysates of HEK293T cells expressing the indicated proteins were subjected to IP with anti-HA antibodies conjugated beads and IB with the indicated antibodies, n = 2. The values represent the densitometric analysis of co-immunoprecipitated FLAG-PLEKHM1 and Vps11. E Densitometric analysis of co-immunoprecipitated FLAG-PLEKHM1. F Lysates of HEK293T cells expressing the indicated proteins were subjected to IP with anti-FLAG antibodies conjugated beads and IB with the indicated antibodies, n = 2. The values represent the densitometric analysis of co-immunoprecipitated Vps11 band intensity. G Representative confocal images of HeLa cells transfected with the ORF3a-GFP-expressing plasmid and immunostained for endogenous Rab7 and PLEKHM1, n = 3. Insets 1 and 2 indicate the untransfected and ORF3a-GFP-transfected cells, respectively. Scale bars: 10 µm (main); 2 µm (inset). H Quantification of the number of PLEKHM1 puncta in wild-type (untransfected) and ORF3a-GFP-expressing HeLa cells, n = 94 or 95 cells examined over three independent experiments, as indicated, p < 0.0001. I Lysates of HEK293T cells expressing the indicated proteins were subjected to IP with anti-Rab7 antibodies conjugated beads and IB with the indicated antibodies, n = 3. The values in (I) and graph (J) represent the densitometric analysis of co-immunoprecipitated endogenous PLEKHM1, n = 3, p = 0.0004. K, L Quantification of Rab7 puncta in wild-type (untransfected) and ORF3a-GFP-expressing HeLa cells, n = 90 cells examined over three independent experiments, p < 0.0001. Quantified results are presented as mean ± S.D. using unpaired two-tailed Student’s t test.
Fig. 3
Fig. 3. Expression of ORF3a or its natural variants promotes Rab7 activation.
A Representative time-lapse images of GFP-Rab7 endosomes before (pre-bleach) and after (bleach) photobleaching in untreated and Dox-treated HeLaORF3a-Strep cells; see Supplementary Movie 1. B FRAP recovery curves of GFP-Rab7 endosomes in untreated and Dox-treated HeLaORF3a-Strep cells. The vertical-axis denotes the normalized fluorescence intensity of GFP-Rab7, corrected for fluorescence decay and background fluorescence. Data points are plotted as the mean ± S.E.M, n = 20 (-DOX) and 19 ( + DOX) cells examined over three independent experiments. The percentage of the mobile fraction (C) and half-time (t1/2) of recovery (D) for GFP-Rab7 signal were calculated, n = 3, p = 0.0005 (C) and 0.0004 (D). E GST and GST-RILP proteins immobilized on beads were incubated with lysates of untreated and Dox-treated HeLaORF3a-Strep cells. The precipitates were IB with anti-Rab7 antibodies, n = 3. The values written in (E) and graph (F) represent densitometric analysis for the levels of active Rab7 pulldown, n = 3, p = 0.0018. G Lysates of HEK293T cells expressing the indicated proteins were IP with anti-Rab7 antibodies conjugated beads and IB with the indicated antibodies. The values represent the densitometric analysis of co-immunoprecipitated GFP-RILP, n = 2. H Representative confocal micrographs of HeLa cells wild-type or expressing ORF3a (WT)-GFP or different natural variants of ORF3a and immunostained for LAMP1 and Rab7. The insets show the increase in the size of LAMP1-positive endosomes and the increase in the membrane localization of Rab7 observed upon the expression of ORF3a (WT) or its natural variants, n = 3. I GST and GST-RILP proteins immobilized on beads were incubated with lysates of HeLa cells expressing indicated proteins. The precipitates were IB with anti-Rab7 antibodies. The values in (I) and graph (J) represent densitometric analysis of the levels of active Rab7 pulldown, n = 3, p < 0.0001 (WT and T223I), 0.0008 (S26L), 0.0001 (Q57H/S171L), 0.0012 (S253P). Quantified results are presented as mean ± S.D. using unpaired two-tailed Student’s t test. Scale bars: 10 µm (main); 2 µm (inset).
Fig. 4
Fig. 4. SARS-CoV-2 infection leads to Rab7 hyperactivation in an ORF3a-dependent manner.
A GST and GST-RILP proteins immobilized on beads were incubated with lysates from uninfected and SARS-CoV-2-infected Vero E6 cells. The precipitates were IB with indicated antibodies, n = 3. The values in (A) and graph (B) represent densitometric analysis of the levels of active Rab7 pulldown, n = 3, p = 0.0116. C Lysates of Vero E6 cells infected with SARS-CoV-2 and transfected with either control or ORF3a-siRNA were IB for the indicated proteins, n = 3. The values represent densitometric analysis of LC3b-II and p62 levels normalized to β-tubulin. D Relative fold-change in intracellular N-antigen levels in lysates of SARS-CoV-2-infected Vero E6 cells transfected with control or ORF3a-siRNA, n = 3, p < 0.0001. E Relative expression of SARS-CoV-2 E and orf1ab genes measured in the culture supernatants, n = 3, p = 0.0003 (E gene), 0.002 (orf1ab gene). F Protein levels of N-antigen in the culture supernatants. The values represent a densitometric analysis of the levels of extracellular N-antigen, n = 1. G Representative confocal images of Vero E6 cells uninfected or infected with SARS-CoV-2 and transfected with either control or ORF3a-siRNA and immunostained for endogenous Rab7 and N-antigen. The insets show the differences in the sizes of the Rab7 puncta, n = 3. Scale bars: 10 µm (main); 2 µm (inset). H Quantification of Rab7 puncta size in uninfected and SARS-CoV-2-infected Vero E6 cells transfected with control or ORF3a-siRNA, n = 114, 113 and 152 cells examined over three independent experiments, as indicated, p < 0.0001. I GST and GST-RILP proteins immobilized on beads were incubated with lysates from uninfected and SARS-CoV-2-infected Vero E6 cells transfected with control or ORF3a-siRNA. The precipitates were IB with the indicated antibodies, n = 3. The values in (I) and graph (J) represent densitometric analysis of the levels of active Rab7 pulldown, n = 3, p = 0.0002 (uninfected versus control siRNA-infected), 0.0012 (control versus ORF3a siRNA-infected). Quantified results are presented as mean ± S.D. using unpaired two-tailed Student’s t test.
Fig. 5
Fig. 5. ORF3a inhibits the interaction between Rab7 and TBC1D5 in a Vps39-dependent manner.
A Representative confocal micrographs of HeLa cells transfected with ORF3a (WT) or mutants and immunostained for the indicated proteins. Scale bars: 10 µm (main); 2 µm (inset). B Quantification of Rab7 puncta size in HeLa cells transfected with indicated ORF3a, n = 80 or 90 cells examined over three independent experiments, as indicated, p < 0.0001(WT, Q57E, S58L/Q116L), p = 0.6309(S171E), p = 0.0519(W193R). C GST and GST-RILP proteins immobilized on beads were incubated with HeLa cell lysates expressing the indicated proteins. The precipitates were IB with indicated antibodies. The values in (C) and graph (D) represent densitometric analysis of the levels of active Rab7 pulldown, n = 3, p = 0.002(WT), 0.4912(S171E), 0.1407(W193R). E GST and GST-RILP proteins immobilized on beads were incubated with lysates of uninfected and SARS-CoV-2-infected cells transfected with control or ORF3a-siRNA and expressing indicated proteins. The precipitates were IB with indicated antibodies. The values in (E) and graph (F) represent densitometric analysis of the levels of active Rab7 pulldown, n = 3, p = 0.0023(uninfected versus control siRNA-infected), 0.0058(control versus ORF3a siRNA-infected), 0.0056(ORF3a (WT) versus ORF3a siRNA), 0.1095(ORF3a (S171E) versus ORF3a siRNA), 0.0555(ORF3a (W193R) versus ORF3a siRNA). G Relative expression of the E and orf1ab genes measured by qRT-PCR in the media, n = 3. For control versus ORF3a siRNA, p < 0.0001(E and orf1ab genes); for ORF3a (WT) versus ORF3a siRNA, p = 0.0228(E), 0.0108(orf1ab); for ORF3a (S171E) versus ORF3a siRNA, p = 0.1115(E), 0.0912(orf1ab). H Lysates of HEK293T cells expressing the indicated proteins were IP with anti-HA antibody-conjugated beads and IB with the indicated antibodies, n = 3. I Lysates of untreated and Dox-treated HeLaORF3a-Strep cells were IP using anti-Rab7 antibody-conjugated beads and IB with the indicated antibodies. The values represent densitometric analysis of co-immunoprecipitated TBC1D5, n = 3. J Lysates of HEK293T cells expressing the indicated proteins were IP with anti-GFP antibody-conjugated beads and IB with the indicated antibodies. The values represent the densitometric analysis of co-immunoprecipitated FLAG-Rab7, n = 3. K Lysates of uninfected and SARS-CoV-2-infected HEK293T-hACE2 cells were IP using anti-Rab7 antibody-conjugated beads and IB with the indicated antibodies, n = 3. The values in (K) and graph (L) represent the densitometric analysis of co-immunoprecipitated TBC1D5, n = 3, p = 0.0002.
Fig. 6
Fig. 6. The GTP-bound form of Rab7 promotes SARS-CoV-2 infection.
A Lysates of SARS-CoV-2 infected and control or Rab7 siRNA transfected cells were IB for the indicated proteins, n = 3. The values in (A) and graph (B) represent the densitometric analysis of N-antigen levels normalized to β-tubulin, n = 3, p < 0.0001. C Relative expression of the E and orf1ab genes measured in the culture supernatants, n = 3, p < 0.0001(E and orf1ab genes). D Protein levels of N-antigen in the lysates of SARS-CoV-2-infected cells transfected with control or Rab7 siRNA and expressing indicated proteins. The values represent densitometric analysis of the levels of N-antigen normalized to β-tubulin, n = 3. E Relative expression of E and orf1ab genes measured in the media, n = 3. For control versus Rab7 siRNA, p = 0.0005(E), p < 0.0001(orf1ab); for Rab7 (WT) versus Rab7 siRNA, p = 0.0278(E), 0.0034(orf1ab); for Rab7 (Q67L) versus Rab7 siRNA, p = 0.0021(E), 0.0072(orf1ab); for Rab7 (T22N) versus Rab7 siRNA, p = 0.0321(E), 0.2202(orf1ab). F Protein levels of N-antigen in the media. The values represent the densitometric analysis of the levels of extracellular N-antigen, n = 1. G Lysates of cells infected with SARS-CoV-2 and treated with indicated chemical compounds were IB for the indicated proteins, n = 3. The values in (G) and graph (H) represent densitometric analysis of N-antigen levels normalized to β-tubulin, n = 3, p = 0.0264(ML-098), 0.0001(CID-1067700). I Relative expression of the E and orf1ab genes measured in the media, n = 3. For niclosamide, p < 0.0001(E and orf1ab genes); for ML-098, p = 0.0405(E), 0.0233(orf1ab); for CID-1067700, p = 0.0015(E), 0.001(orf1ab). J Protein levels of N-antigen in the media. The values represent a densitometric analysis of the levels of extracellular N-antigen, n = 1. K Protein levels of the N-antigen in the lysates of SARS-CoV-2-infected cells transfected with control or ORF3a siRNA and expressing GFP-Rab7 (Q67L), n = 3. The values in (K) and graph (L) represent densitometric analysis of the levels of N-antigen normalized to β-tubulin, n = 3, p < 0.0001(control versus ORF3a siRNA), 0.0111(GFP-Rab7 (Q67L) versus ORF3a siRNA), 0.164(control versus GFP-Rab7 (Q67L)-ORF3a siRNA). M Relative expression of the E and orf1ab genes measured in the media, n = 3. For control versus ORF3a siRNA, p < 0.0001(E), p = 0.0021(orf1ab); for GFP-Rab7 (Q67L) versus ORF3a siRNA, p = 0.0111(E), p = 0.01(orf1ab); for control versus GFP-Rab7 (Q67L)-ORF3a siRNA, p = 0.164(E), p = 0.335(orf1ab).
Fig. 7
Fig. 7. ORF3a blocks CI-M6PR recycling from late endosomes to the TGN and impairs lysosomal sorting of newly synthesized hydrolases.
A Representative confocal images showing HeLa (wild-type) and ORF3a-GFP-expressing cells immunostained for indicated proteins. B The colocalization of CI-M6PR with Rab7 was measured using PCC, n = 90 cells examined over three independent experiments, p < 0.0001. C Representative confocal images showing HeLa (wild-type) and ORF3a-GFP-expressing cells immunostained for indicated proteins. D Colocalization of Vps35 and Rab7 was measured using PCC, n = 90 cells examined over three independent experiments, p < 0.0001. E The RUSH assay was performed in untreated and Dox-treated (12 h) HeLaORF3a-Strep cells expressing Str-KDEL-IRES-SBP-mCherry-CtsZ and LAMP1-GFP. Live-cell imaging was performed at various time points after the addition of biotin to follow the trafficking of the cargo, mCherry-CtsZ, to LAMP1-GFP-positive compartments. Representative confocal micrographs of cells taken 40- and 120-min post-biotin addition are shown. F The PCC was quantified for the cargo, mCherry-CtsZ, with LAMP1-GFP at different time points post-biotin addition, n = 3, p < 0.0001. G Lysates from untreated and Dox-treated HeLaORF3a-Strep cells for the indicated periods were IB with anti-Cathepsin-D (CatD) antibodies, n = 3. H Densitometric analysis of the pro-CatD normalized to those of β-tubulin, n = 3. I Immunoblotting of pro-CatD in the cell culture supernatant media of untreated and Dox-treated HeLaORF3a-Strep cells, n = 3. J Representative confocal images of untreated and Dox-treated HeLaORF3a-Strep cells labeled with the SiR Lysosome probe for the detection of CatD activity, n = 3. K Quantification of the average fluorescence intensity of the SiR Lysosome probe signal in untreated and Dox-treated HeLaORF3a-Strep cells, n = 75 cells examined over three independent experiments, p < 0.0001. Quantified results are presented as mean ± S.D. using unpaired two-tailed Student’s t test. Scale bars: 10 µm (main); 2 µm (inset).
Fig. 8
Fig. 8. ORF3a blocks the fusion of Rab7-positive and Arl8b-positive late endosomes and lysosomes.
A Representative confocal images of HeLa (wild-type) and ORF3a-GFP-expressing cells immunostained for indicated proteins. The insets 1 and 2 mark untransfected and ORF3a-GFP-transfected cells, respectively. B The colocalization of Rab7 and Arl8b was evaluated using PCC, n = 75 cells examined over three independent experiments, p < 0.0001. C Representative confocal images of uninfected and SARS-CoV-2-infected Vero E6 cells immunostained for Arl8b and Rab7. D The colocalization of Rab7 with Arl8b was measured using PCC, n = 60 cells examined over three independent experiments, p < 0.0001. E Representative micrographs from live-cell imaging experiments performed on untreated and Dox-treated HeLaORF3a-Strep cells expressing GFP-Rab7 and Arl8b-tomato. The arrows highlight the fusion between GFP-Rab7 and Arl8b-tomato vesicles; see Supplementary Movie 2. F Quantification of the number of fusion events per ROI (region of interest), n = 27 (-DOX) and n = 22 ( + DOX), p < 0.0001. G Ferrofluid (FF) uptake was performed in untreated and Dox-treated HeLaORF3a-Strep cells for 20 min at 37 °C (pulse), followed by various periods of time (chase). At the indicated time points, the cells were homogenized, and the FF-containing cellular compartments were purified and immunoblotted for the presence of the indicated proteins, n = 1. The asterisk (*) denotes a non-specific signal detected using the anti-Rab5 antibody. Representative live-cell imaging micrographs of untreated (H) and Dox-treated (I) HeLaORF3a-Strep cells expressing GFP-Rab7 and Arl8b-tomato were captured at the start of time-lapse imaging (T = 0 s). Single-particle tracking analysis of GFP-Rab7 and Arl8b-tomato was performed until T = 200 s with color coding to show the maximum velocity (Vmax; blue, immobile; red, maximum mobility), n = 10 (-DOX) and n = 8 (+DOX) cells. JM Graphs (J) and (L) represent the mobile fractions of Arl8b-tomato and GFP-Rab7 vesicles, respectively. Graphs (K) and (M) represent the maximum speeds of the Arl8b-tomato and GFP-Rab7 vesicles, respectively, n = 10 (-DOX) and n = 8 (+DOX) cells, p = 0.1343 (J), 0.0952 (K), 0.0001 (L), < 0.0001 (M). Quantified results are presented as mean ± S.D. using unpaired two-tailed Student’s t test. Scale bars: 10 µm (main); 2 µm (inset).
Fig. 9
Fig. 9. Schematic illustrating the role of the interaction between SARS-CoV-2 ORF3a and Vps39 in blocking Rab7 GTP-GDP cycling.
The late endosomal G protein Rab7 interacts with its effectors RILP and PLEKHM1 to mediate late endosomal positioning and fusion with lysosomes, respectively. PLEKHM1 is a dual-binding partner of Rab7 and Arl8b that binds to the Vps39 subunit of the tethering factor HOPS complex, while the Vps41 subunit directly binds to Arl8b on lysosomes. Recruitment of the Rab7 GAP, TBC1D5, by the trimeric retromer complex to late endosomes leads to GTP hydrolysis of Rab7, which leads to the dissociation of the Rab7 effectors RILP and PLEKHM1 from late endosomal membranes. Upon SARS-CoV-2 infection, the viral protein ORF3a localizes to late endosomes and lysosomes and directly interacts with Vps39. ORF3a abrogates the interaction of Vps39 with PLEKHM1 and promotes its interaction with TBC1D5. ORF3a sequesters TBC1D5 and impairs its binding to Rab7, leading to increased levels of GTP-bound Rab7. By inhibiting Vps39 and PLEKHM1 binding, ORF3a likely blocks the fusion of Rab7-positive and Arl8b-positive compartments and abrogates endocytic and autophagic cargo degradation. The model shown in the figure was created using BioRender.com.

Similar articles

Cited by

References

    1. Shulla A, Randall G. (+) RNA virus replication compartments: a safe home for (most) viral replication. Curr. Opin. Microbiol. 2016;32:82–88. doi: 10.1016/j.mib.2016.05.003. - DOI - PMC - PubMed
    1. Prasad V, Bartenschlager R. A snapshot of protein trafficking in SARS-CoV-2 infection. Biol. Cell. 2023;115:e2200073. doi: 10.1111/boc.202200073. - DOI - PMC - PubMed
    1. Miller S, Krijnse-Locker J. Modification of intracellular membrane structures for virus replication. Nat. Rev. Microbiol. 2008;6:363–374. doi: 10.1038/nrmicro1890. - DOI - PMC - PubMed
    1. Ghosh S, et al. beta-coronaviruses use lysosomes for egress instead of the biosynthetic secretory pathway. Cell. 2020;183:1520–1535.e1514. doi: 10.1016/j.cell.2020.10.039. - DOI - PMC - PubMed
    1. Khailany RA, Safdar M, Ozaslan M. Genomic characterization of a novel SARS-CoV-2. Gene Rep. 2020;19:100682. doi: 10.1016/j.genrep.2020.100682. - DOI - PMC - PubMed

Supplementary concepts