. 2024 Mar 6;15(1):2030.
doi: 10.1038/s41467-024-46396-4.

Dynamic enhancer landscapes in human craniofacial development

Affiliations

Dynamic enhancer landscapes in human craniofacial development

Sudha Sunil Rajderkar et al. Nat Commun. .

Abstract

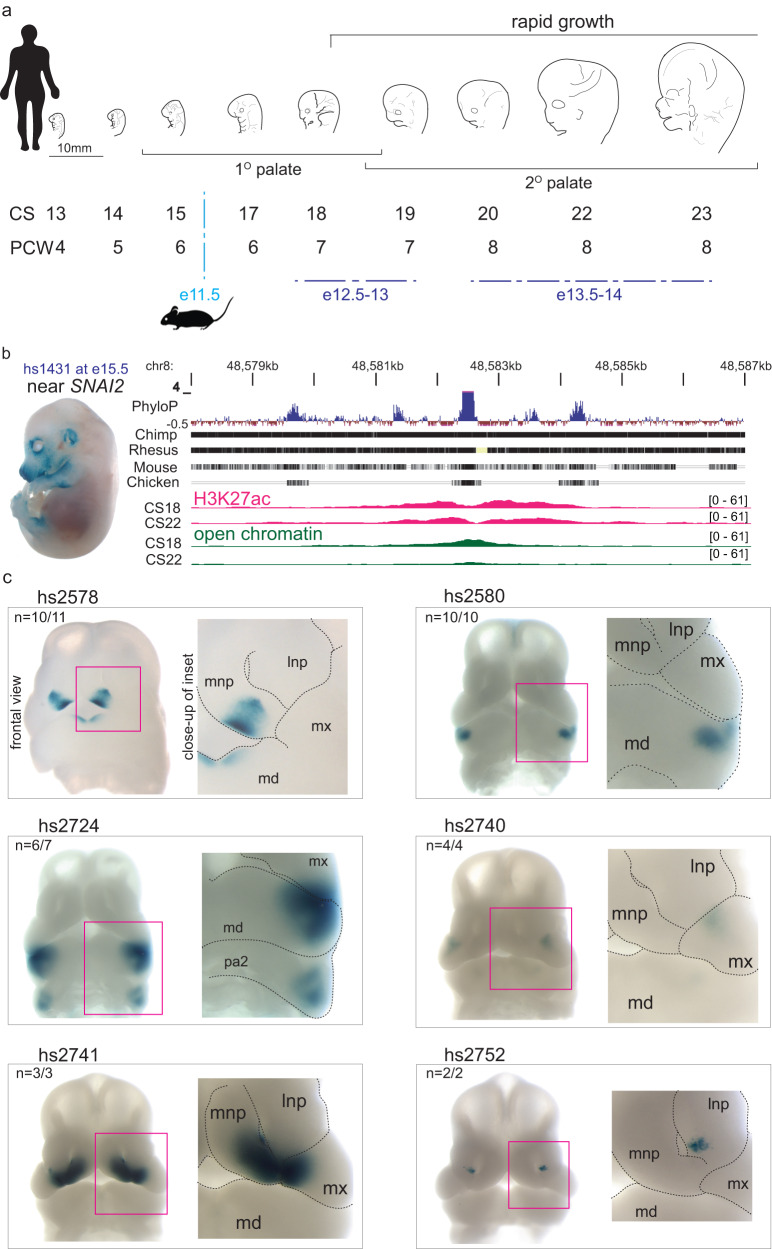
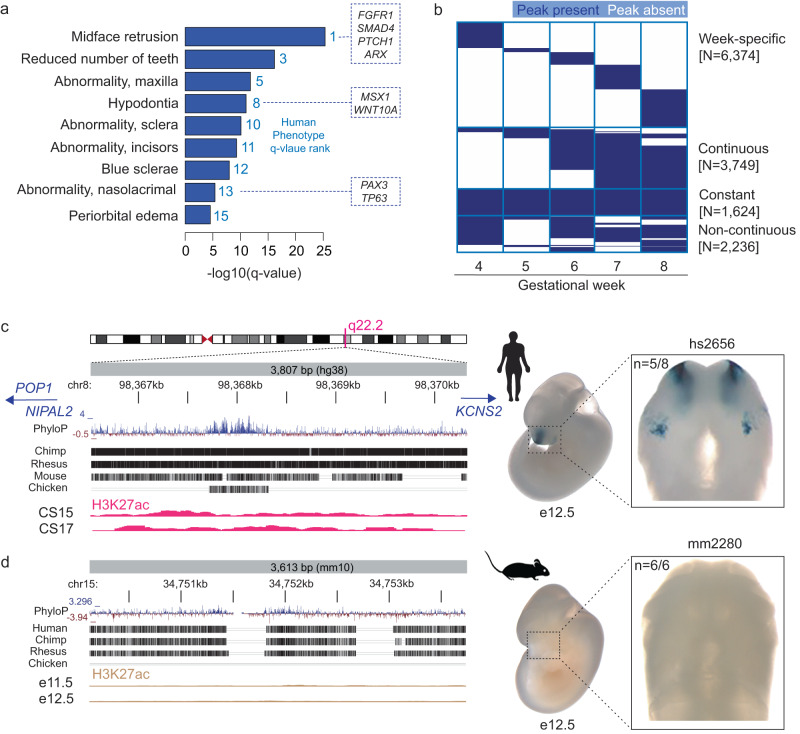
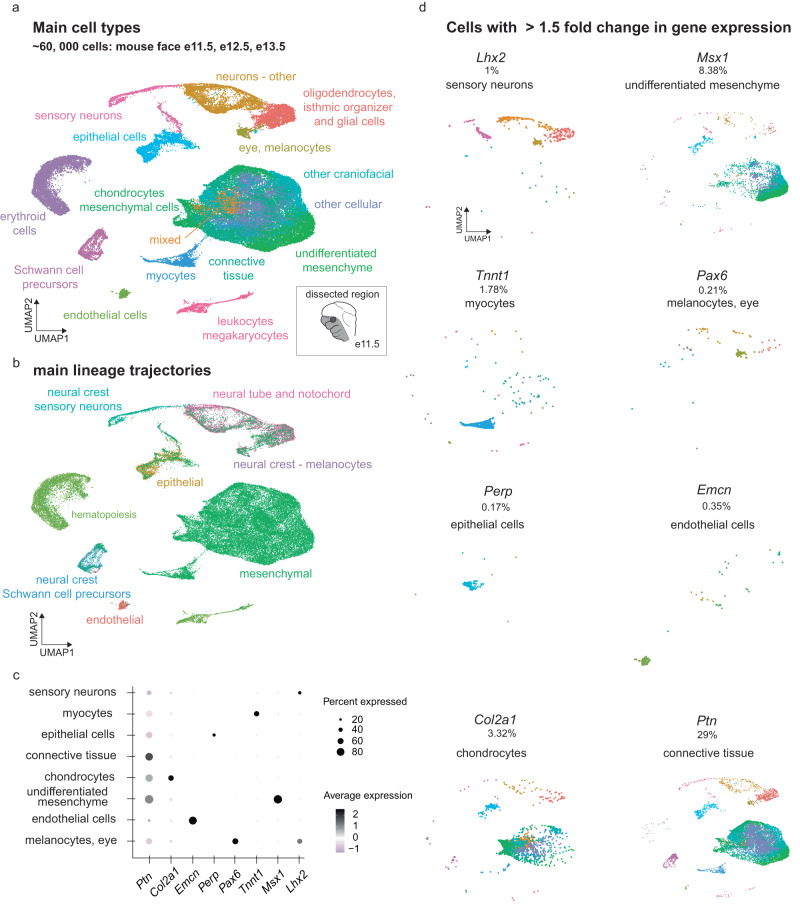
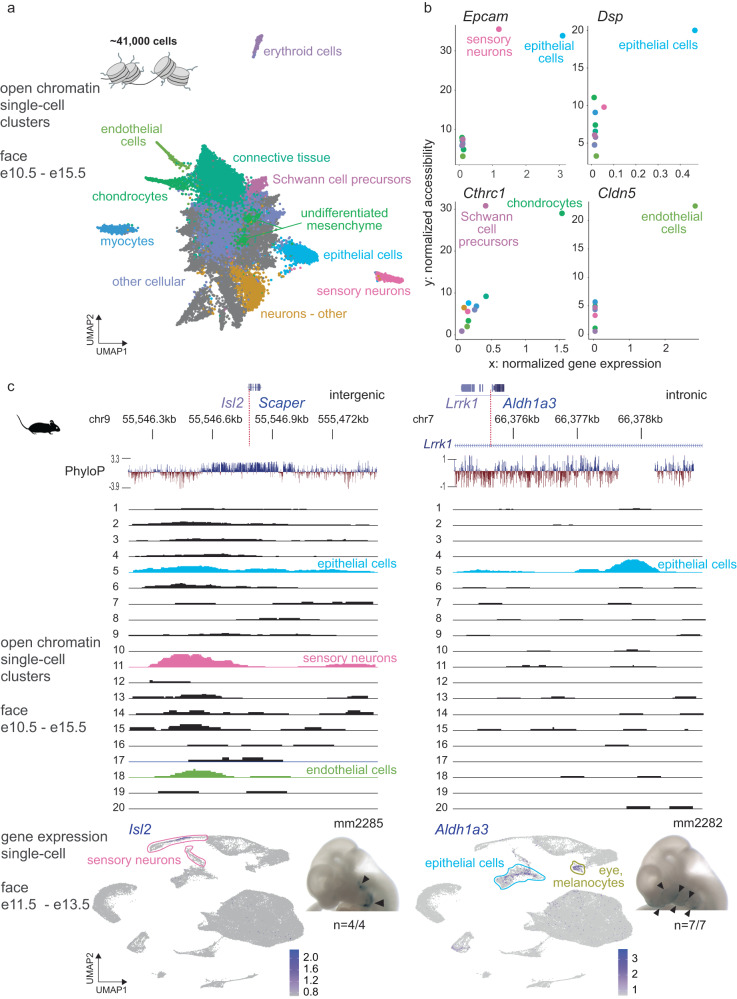
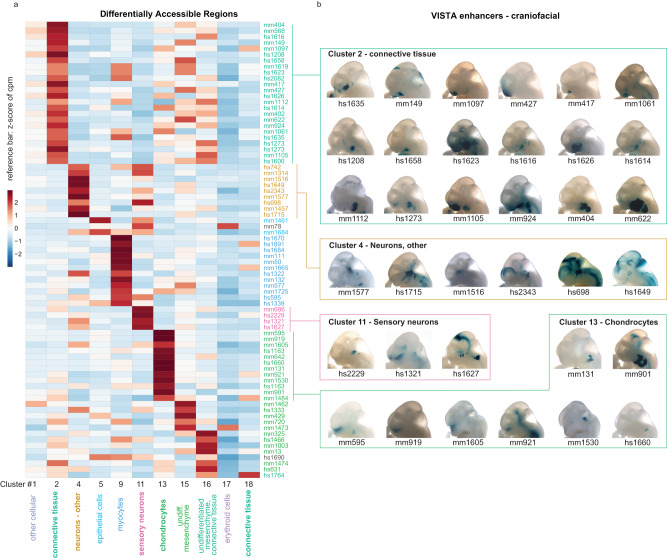
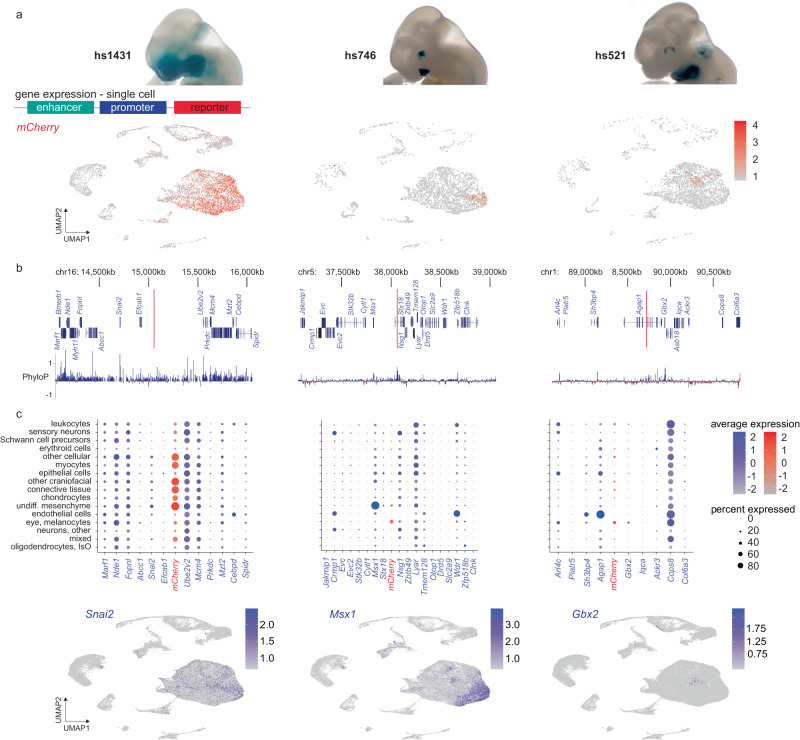
The genetic basis of human facial variation and craniofacial birth defects remains poorly understood. Distant-acting transcriptional enhancers control the fine-tuned spatiotemporal expression of genes during critical stages of craniofacial development. However, a lack of accurate maps of the genomic locations and cell type-resolved activities of craniofacial enhancers prevents their systematic exploration in human genetics studies. Here, we combine histone modification, chromatin accessibility, and gene expression profiling of human craniofacial development with single-cell analyses of the developing mouse face to define the regulatory landscape of facial development at tissue- and single cell-resolution. We provide temporal activity profiles for 14,000 human developmental craniofacial enhancers. We find that 56% of human craniofacial enhancers share chromatin accessibility in the mouse and we provide cell population- and embryonic stage-resolved predictions of their in vivo activity. Taken together, our data provide an expansive resource for genetic and developmental studies of human craniofacial development.


Conflict of interest statement

Bing Ren is a co-founder of Arima Genomics, Inc, and Epigenome Technologies, Inc. The remaining authors declare no competing interests.

Figures

Fig. 1
Fig. 1. Developmental enhancers in human craniofacial morphogenesis.
a Developmental time points coinciding with critical windows of craniofacial morphogenesis are shown by Carnegie stage (CS) and post-conceptional week (PCW) in humans, and comparable embryonic (e) stages for mouse are shown in embryonic days. b Representative embryo image at e15.5 for an in vivo-validated enhancer (hs1431) shows positive lacZ-reporter activity in craniofacial structures (and limbs). Adjacent graphic shows the genomic context and evolutionary conservation of the region, with H3K27ac-bound and open chromatin regions located within the hs1431 element. c Six examples of human craniofacial enhancers discovered in this study with in vivo activity validated in e11.5 transgenic mouse embryos. Enhancers hs2578, hs2580, hs2724, hs2740, hs2741 and hs2752 show lacZ-reporter activity in distinct subregions of the developing mouse face. Lateral nasal process (lnp), medial nasal process (mnp), maxillary process (mx), mandibular process (md), and pharyngeal arch 2 (pa2). n, reproducibility of each pattern across embryos resulting from independent transgenic integration events.
Fig. 2
Fig. 2. Developmental dynamics and conservation of human craniofacial enhancers.
a Results of rGREAT ontology analysis for 13,983 reproducible human craniofacial enhancers, ranked by Human Phenotype q-value. The ontology terms indicate that our predictions of human craniofacial enhancers are enriched near presumptive target genes known to play important roles in craniofacial development (examples in boxes). b Predicted activity windows of 13,983 candidate human enhancers (rows) arranged by gestational weeks 4–8 of human development (columns). Blue, active enhancer signature; white, no active enhancer signature. Source data are provided as part of Supplementary Data 2 and in the Source Data file. c, d Left: genomic position and evolutionary conservation of human candidate enhancer hs2656 (c) and its mouse ortholog mm2280 (d). The human sequence, but not the orthologous mouse sequence, shows evidence of H3K27ac binding at corresponding stages of craniofacial development (beige tracks). Right: Representative embryo images at e12.5 show that human enhancer hs2656, but not its mouse ortholog mm2280, drives reproducible lacZ-reporter expression in the developing nasal and maxillary processes at e12.5. n, reproducibility of each pattern across embryos resulting from independent transgenic integration events.
Fig. 3
Fig. 3. Gene expression in the mammalian craniofacial complex at single-cell resolution.
a Uniform Manifold Approximation and Projection (UMAP) clustering, color-coded by inferred cell types across clusters from aggregated scRNA-seq for the developing mouse face at embryonic days 11.5–13.5, for 57,598 cells across all stages. Cartoon shows the outline of dissected region from the mouse embryonic face at e11.5, corresponding regions were excised at other stages. b Same UMAP clustering, color-coded by main cell lineages. c Expression of select marker genes in cell types shown a. See Supplementary Fig. 11 for additional details. d UMAP plots comprising cells with >1.5-fold gene expression for marker genes representing specific cell types as shown in a and c. Source data are provided as a publicly accessible Seurat/R object file, see Data Availability Statement for details.
Fig. 4
Fig. 4. Differential chromatin accessibility at craniofacial in vivo enhancers correlates with expression of nearby genes.
a Unbiased clustering (UMAP) of open chromatin regions from snATAC-seq of the developing mouse face for stages e10.5–15.5 for ~41,000 cells. The cell types are assigned based on label transfer (Seurat) from cell type annotations of the ScanFaceX data. b Correlation between normalized gene expression (x axis) from ScanFaceX and normalized accessibility (y axis) from snATAC-seq for select genes (Epcam, Dsp, Cthrc1, Cldn5) and their transcription start sites with the highest correlation evident in relevant cell types. c Genomic context and evolutionary conservation (in placentals) for corresponding regulatory regions in the vicinity of the Isl2/Scaper locus, and an intronic distal enhancer within Lrrk1. Tracks for individual snATAC-seq clusters from developing mouse face tissue (e10.5 to e15.5), with cluster-specific open chromatin signatures for relevant annotated cell types are shown for the same genomic regions. Colors in b and the individual snATAC-seq tracks in c correspond to the color code used in a. UMAP of ScanFaceX data shows expression of Isl2 and Aldh1a3 (gene adjacent to Lrrk1) in expected cell types. Images for a representative mouse embryo at e11.5 for both loci show validated in vivo lac-Z-reporter activity of the respective regions; black arrowheads point towards stained regions. n, reproducibility of each pattern across embryos resulting from independent transgenic integration events. Source data for 4b are provided as a Source Data file.
Fig. 5
Fig. 5. Correlating cell population-resolved enhancer signatures with enhancer in vivo activity patterns.
a Heatmap indicates the chromatin accessibility of 77 craniofacial in vivo VISTA enhancers in 11 major clusters representing predicted cell types. cpm: counts per million. b Representative images of transgenic embryos from VISTA Enhancer Browser, showing in vivo activity pattern of 35 selected enhancers at e11.5. Embryo images are grouped by example cluster types from a in this retrospective assignment. Source data for 5a are provided as a Source Data file.
Fig. 6
Fig. 6. Enhancer activity at single-cell resolution.
a in vivo activity pattern of select craniofacial enhancers (hs1431, hs746, hs521) at e11.5, visualized by lacZ-reporter assays (top). In separate experiments, the same enhancers were coupled to a mCherry-fluorescent reporter gene and examined by scRNA-seq of craniofacial tissues of resulting embryos. UMAPs show enhancer-driven mCherry expression (see Fig. 3a for reference). b Location of enhancers hs1431, hs746 and hs521 in their respective genomic context (red vertical lines), along with protein-coding genes within the genomic regions and local conservation profile (PhyloP). c Seurat-based average expression of genes in the vicinity of the respective enhancers, and proportion (percent) of cells expressing those genes in annotated cell types. Enhancer-driven mCherry signal is plotted in the center in between the names of the two genes whose promoters are closest to its location within the genome. For example, for hs1431, mCherry is highly expressed (indicated by red color intensity) in clusters labeled “other cellular”, “myocytes”, “skeletal, other”, “connective tissue”, and “undifferentiated mesenchyme”, while it is also expressed in a larger proportion of cells (indicated by greater diameter of the circles) in those same clusters. In the same plot, Snai2 is highly expressed (indicated by blue color intensity) in a subset of cells (indicated by lesser diameter of circles) in identical clusters as compared to mCherry. Bottom panels show the expression of Snai2, Msx1, and Gbx2 as likely candidate target genes for each of the enhancers hs1431, hs746 and hs521 across UMAPs. undiff. undifferentiated, IsO: Isthmic Organizer Cells. Source data are provided as a publicly accessible Seurat/R object file, see Data Availability Statement for details.

References

    1. Richmond S, Howe LJ, Lewis S, Stergiakouli E, Zhurov A. Facial genetics: a brief overview. Front. Genet. 2018;9:462. doi: 10.3389/fgene.2018.00462. - DOI - PMC - PubMed
    1. Maden M. Vitamin A and the developing embryo. Postgrad. Med. J. 2001;77:489–491. doi: 10.1136/pmj.77.910.489. - DOI - PMC - PubMed
    1. Le Douarin NM, Brito JM, Creuzet S. Role of the neural crest in face and brain development. Brain Res. Rev. 2007;55:237–247. doi: 10.1016/j.brainresrev.2007.06.023. - DOI - PubMed
    1. Som PM, Naidich TP. Illustrated review of the embryology and development of the facial region, part 1: early face and lateral nasal cavities. AJNR Am. J. Neuroradiol. 2013;34:2233–2240. doi: 10.3174/ajnr.A3415. - DOI - PMC - PubMed
    1. Sudmant PH, et al. An integrated map of structural variation in 2,504 human genomes. Nature. 2015;526:75–81. doi: 10.1038/nature15394. - DOI - PMC - PubMed