

Sex-specific associations of serum cortisol with brain biomarkers of Alzheimer's risk
- PMID: 38448497
- PMCID: PMC10918173
- DOI: 10.1038/s41598-024-56071-9
Sex-specific associations of serum cortisol with brain biomarkers of Alzheimer's risk
Abstract
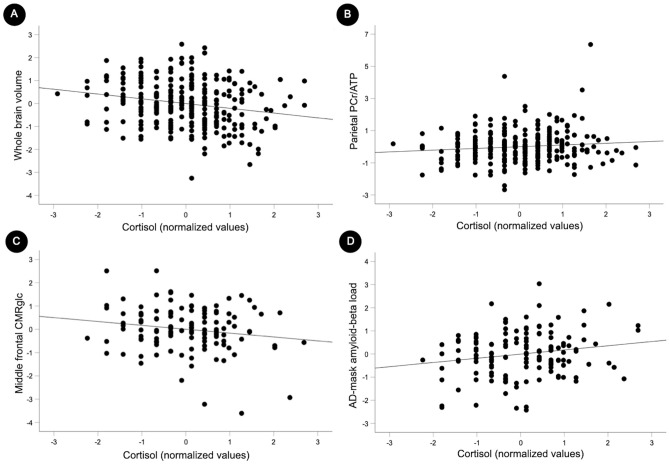
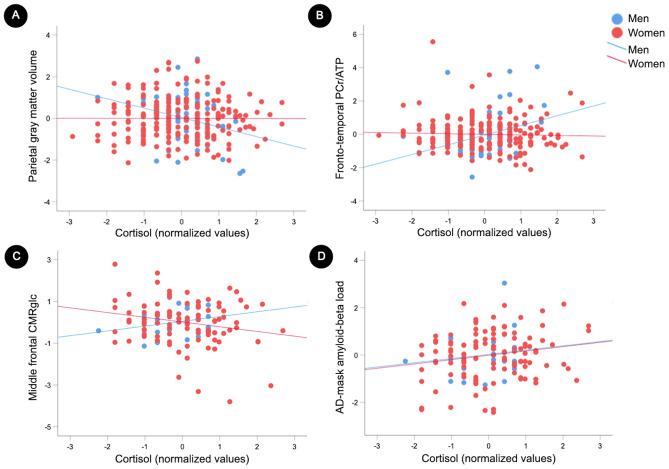
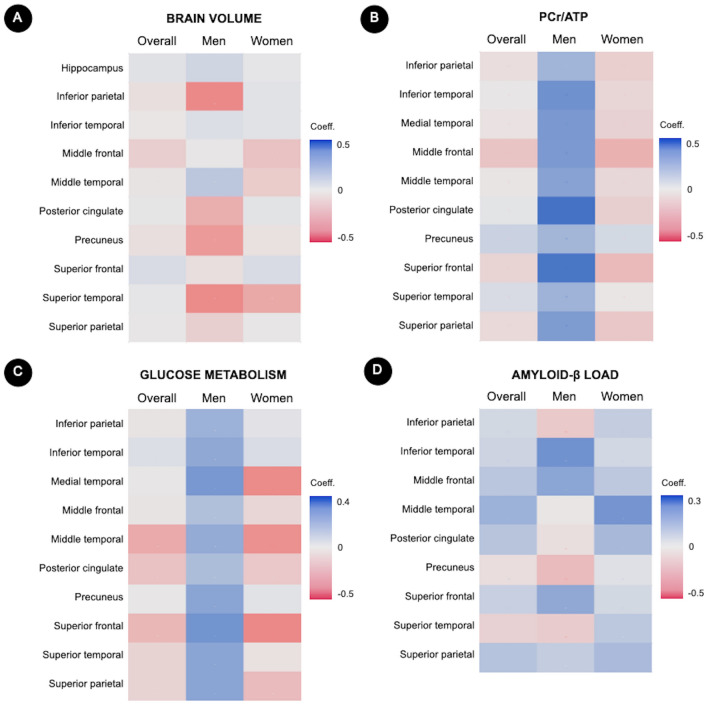
Emerging evidence implicates chronic psychological stress as a risk factor for Alzheimer's disease (AD). Herein, we examined the relationships between serum cortisol and multimodality brain AD biomarkers in 277 cognitively normal midlife individuals at risk for AD. Overall, higher cortisol was associated with lower total brain volume, lower glucose metabolism (CMRglc) in frontal cortex, and higher β-amyloid (Aβ) load in AD-vulnerable regions; and marginally associated with phosphocreatine to ATP ratios (PCr/ATP) in precuneus and parietal regions. Sex-specific modification effects were noted: in women, cortisol exhibited stronger associations with Aβ load and frontal CMRglc, the latter being more pronounced postmenopause. In men, cortisol exhibited stronger associations with gray matter volume and PCr/ATP measures. Higher cortisol was associated with poorer delayed memory in men but not in women. Results were adjusted for age, Apolipoprotein E (APOE) epsilon 4 status, midlife health factors, and hormone therapy use. These results suggest sex-specific neurophysiological responses to stress, and support a role for stress reduction in AD prevention.
© 2024. The Author(s).
Conflict of interest statement
The authors declare no competing interests.
Figures
Similar articles
-
Effects of sex and APOE ε4 genotype on brain mitochondrial high-energy phosphates in midlife individuals at risk for Alzheimer's disease: A 31Phosphorus MR spectroscopy study.PLoS One. 2023 Feb 14;18(2):e0281302. doi: 10.1371/journal.pone.0281302. eCollection 2023. PLoS One. 2023. PMID: 36787293 Free PMC article.
-
Neurophysiological correlates of subjective cognitive decline in perimenopausal and postmenopausal midlife women at risk for Alzheimer's disease.Menopause. 2025 May 1;32(5):433-442. doi: 10.1097/GME.0000000000002512. Menopause. 2025. PMID: 40067757
-
Sex and menopause impact 31P-Magnetic Resonance Spectroscopy brain mitochondrial function in association with 11C-PiB PET amyloid-beta load.Sci Rep. 2022 Dec 21;12(1):22087. doi: 10.1038/s41598-022-26573-5. Sci Rep. 2022. PMID: 36543814 Free PMC article.
-
Sex differences in functional and molecular neuroimaging biomarkers of Alzheimer's disease in cognitively normal older adults with subjective memory complaints.Alzheimers Dement. 2018 Sep;14(9):1204-1215. doi: 10.1016/j.jalz.2018.05.014. Epub 2018 Jul 7. Alzheimers Dement. 2018. PMID: 30201102 Review.
-
Neuroimaging biomarkers for Alzheimer's disease in asymptomatic APOE4 carriers.Rev Neurol (Paris). 2013 Oct;169(10):729-36. doi: 10.1016/j.neurol.2013.07.025. Epub 2013 Sep 6. Rev Neurol (Paris). 2013. PMID: 24016463 Review.
Cited by
-
A method for simultaneous analysis of urinary melatonin, cortisol, and their metabolites using liquid chromatography tandem mass spectrometry and relevance of biomonitoring of these hormones in circadian rhythm.Talanta. 2025 Jul 24;297(Pt A):128627. doi: 10.1016/j.talanta.2025.128627. Online ahead of print. Talanta. 2025. PMID: 40720929
-
White matter micro- and macrostructural properties in midlife individuals at risk for Alzheimer's disease: Associations with sex and menopausal status.bioRxiv [Preprint]. 2025 Jun 13:2025.06.09.658686. doi: 10.1101/2025.06.09.658686. bioRxiv. 2025. PMID: 40661344 Free PMC article. Preprint.
-
Sex-specific decline in prefrontal cortex mitochondrial bioenergetics in aging baboons correlates with walking speed.bioRxiv [Preprint]. 2024 Sep 24:2024.09.19.613684. doi: 10.1101/2024.09.19.613684. bioRxiv. 2024. Update in: Neurobiol Aging. 2025 Jul;151:1-12. doi: 10.1016/j.neurobiolaging.2025.03.010. PMID: 39386547 Free PMC article. Updated. Preprint.
-
Elevated serum cortisol associated with early-detected increase of brain amyloid deposition in Alzheimer's disease imaging biomarkers among menopausal women: The Framingham Heart Study.Alzheimers Dement. 2025 Apr;21(4):e70179. doi: 10.1002/alz.70179. Alzheimers Dement. 2025. PMID: 40271551 Free PMC article.
References
MeSH terms
Substances
Grants and funding
LinkOut - more resources
Full Text Sources
Medical
Miscellaneous
