

Label-free nonlinear optical signatures of extracellular vesicles in liquid and tissue biopsies of human breast cancer
- PMID: 38448508
- PMCID: PMC10917806
- DOI: 10.1038/s41598-024-55781-4
Label-free nonlinear optical signatures of extracellular vesicles in liquid and tissue biopsies of human breast cancer
Abstract
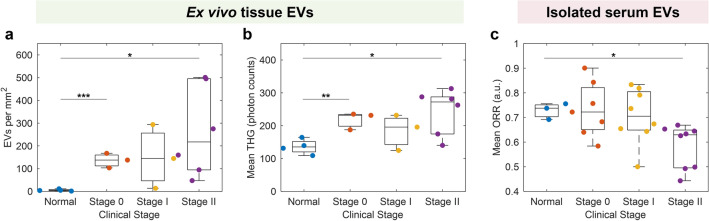
Extracellular vesicles (EVs) have been implicated in metastasis and proposed as cancer biomarkers. However, heterogeneity and small size makes assessments of EVs challenging. Often, EVs are isolated from biofluids, losing spatial and temporal context and thus lacking the ability to access EVs in situ in their native microenvironment. This work examines the capabilities of label-free nonlinear optical microscopy to extract biochemical optical metrics of EVs in ex vivo tissue and EVs isolated from biofluids in cases of human breast cancer, comparing these metrics within and between EV sources. Before surgery, fresh urine and blood serum samples were obtained from human participants scheduled for breast tumor surgery (24 malignant, 6 benign) or healthy participants scheduled for breast reduction surgery (4 control). EVs were directly imaged both in intact ex vivo tissue that was removed during surgery and in samples isolated from biofluids by differential ultracentrifugation. Isolated EVs and freshly excised ex vivo breast tissue samples were imaged with custom nonlinear optical microscopes to extract single-EV optical metabolic signatures of NAD(P)H and FAD autofluorescence. Optical metrics were significantly altered in cases of malignant breast cancer in biofluid-derived EVs and intact tissue EVs compared to control samples. Specifically, urinary isolated EVs showed elevated NAD(P)H fluorescence lifetime in cases of malignant cancer, serum-derived isolated EVs showed decreased optical redox ratio in stage II cancer, but not earlier stages, and ex vivo breast tissue showed an elevated number of EVs in cases of malignant cancer. Results further indicated significant differences in the measured optical metabolic signature based on EV source (urine, serum and tissue) within individuals.
© 2024. The Author(s).
Conflict of interest statement
The authors declare no competing interests.
Figures


Similar articles
-
Label-free visualization and characterization of extracellular vesicles in breast cancer.Proc Natl Acad Sci U S A. 2019 Nov 26;116(48):24012-24018. doi: 10.1073/pnas.1909243116. Epub 2019 Nov 15. Proc Natl Acad Sci U S A. 2019. PMID: 31732668 Free PMC article.
-
Intraoperative visualization of the tumor microenvironment and quantification of extracellular vesicles by label-free nonlinear imaging.Sci Adv. 2018 Dec 19;4(12):eaau5603. doi: 10.1126/sciadv.aau5603. eCollection 2018 Dec. Sci Adv. 2018. PMID: 30585292 Free PMC article.
-
Investigating the tumor-immune microenvironment through extracellular vesicles from frozen patient biopsies and 3D cultures.Front Immunol. 2023 May 25;14:1176175. doi: 10.3389/fimmu.2023.1176175. eCollection 2023. Front Immunol. 2023. PMID: 37304281 Free PMC article.
-
Extracellular Vesicles as Biomarkers and Therapeutic Targets in Breast Cancer.Anticancer Res. 2015 Dec;35(12):6379-90. Anticancer Res. 2015. PMID: 26637847 Review.
-
Extracellular Vesicles: A Brief Overview and Its Role in Precision Medicine.Methods Mol Biol. 2017;1660:1-14. doi: 10.1007/978-1-4939-7253-1_1. Methods Mol Biol. 2017. PMID: 28828643 Review.
Cited by
-
Defining Biological Variability, Analytical Precision and Quantitative Biophysiochemical Characterization of Human Urinary Extracellular Vesicles.J Extracell Vesicles. 2025 May;14(5):e70087. doi: 10.1002/jev2.70087. J Extracell Vesicles. 2025. PMID: 40384173 Free PMC article.
-
Inspiring a convergent engineering approach to measure and model the tissue microenvironment.Heliyon. 2024 Jun 8;10(12):e32546. doi: 10.1016/j.heliyon.2024.e32546. eCollection 2024 Jun 30. Heliyon. 2024. PMID: 38975228 Free PMC article. Review.
-
A case for the study of native extracellular vesicles.Front Oncol. 2024 Jul 12;14:1430971. doi: 10.3389/fonc.2024.1430971. eCollection 2024. Front Oncol. 2024. PMID: 39091922 Free PMC article.
-
Synergistic label-free fluorescence imaging and miRNA studies reveal dynamic human neuron-glial metabolic interactions following injury.Sci Adv. 2024 Dec 13;10(50):eadp1980. doi: 10.1126/sciadv.adp1980. Epub 2024 Dec 11. Sci Adv. 2024. PMID: 39661671 Free PMC article.
References
MeSH terms
Substances
Grants and funding
LinkOut - more resources
Full Text Sources
Medical
