. 2024 Jun;5(6):895-915.
doi: 10.1038/s43018-024-00742-z. Epub 2024 Mar 6.

Cytidine deaminases APOBEC3C and APOBEC3D promote DNA replication stress resistance in pancreatic cancer cells

Affiliations

Cytidine deaminases APOBEC3C and APOBEC3D promote DNA replication stress resistance in pancreatic cancer cells

Tajinder Ubhi et al. Nat Cancer. 2024 Jun.

Abstract

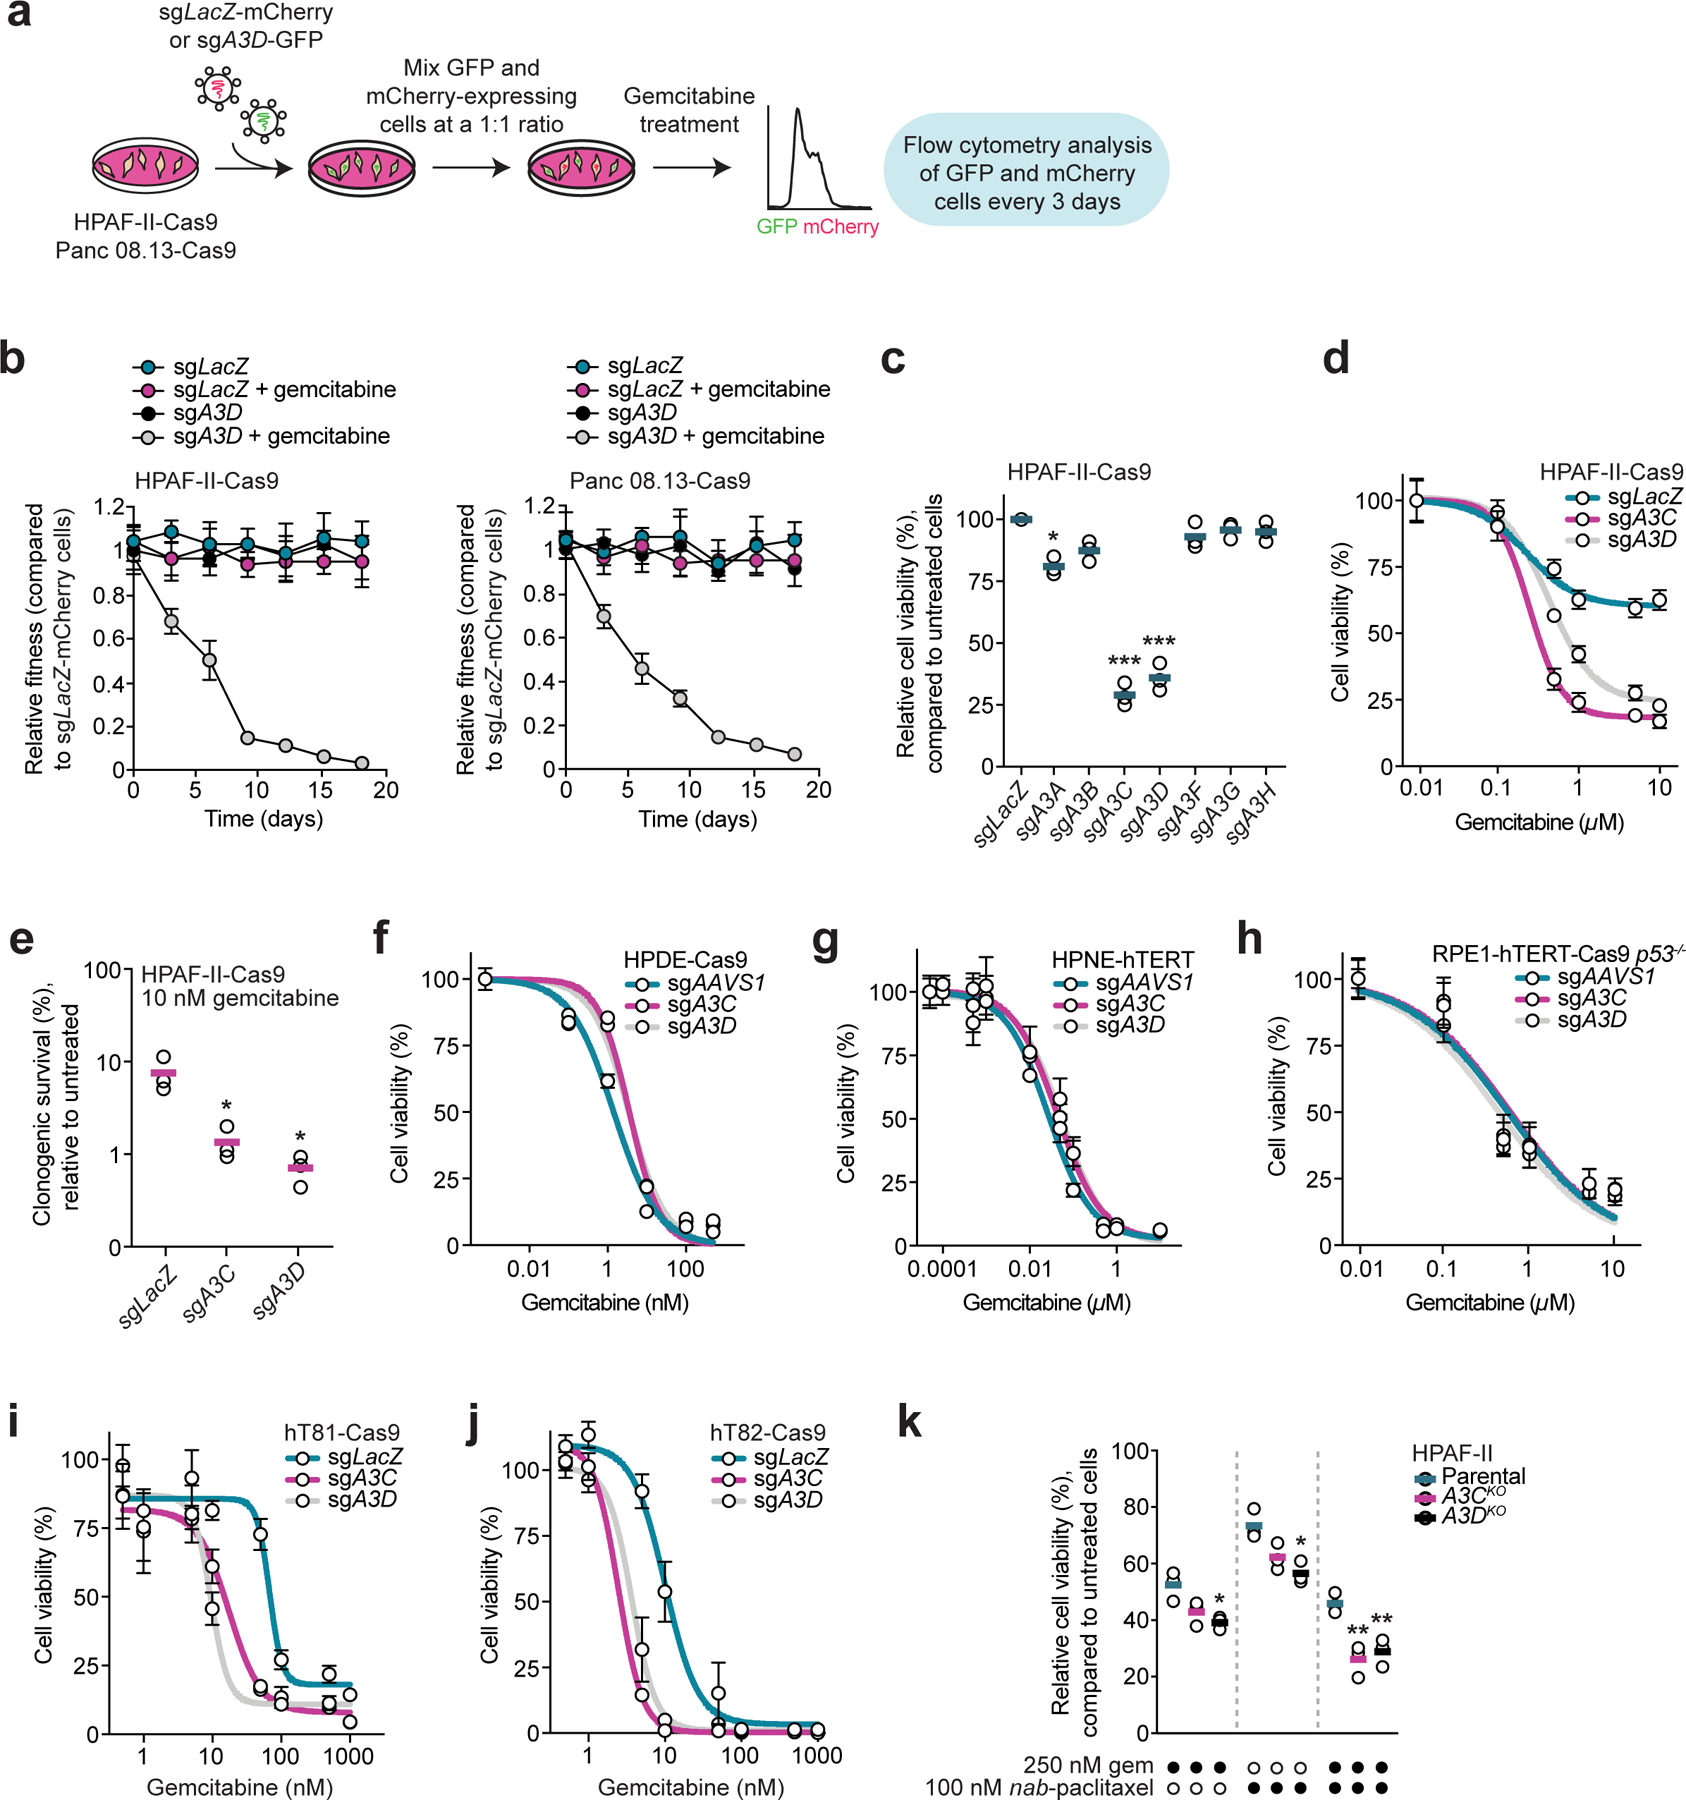
Gemcitabine is a potent inhibitor of DNA replication and is a mainstay therapeutic for diverse cancers, particularly pancreatic ductal adenocarcinoma (PDAC). However, most tumors remain refractory to gemcitabine therapies. Here, to define the cancer cell response to gemcitabine, we performed genome-scale CRISPR-Cas9 chemical-genetic screens in PDAC cells and found selective loss of cell fitness upon disruption of the cytidine deaminases APOBEC3C and APOBEC3D. Following gemcitabine treatment, APOBEC3C and APOBEC3D promote DNA replication stress resistance and cell survival by deaminating cytidines in the nuclear genome to ensure DNA replication fork restart and repair in PDAC cells. We provide evidence that the chemical-genetic interaction between APOBEC3C or APOBEC3D and gemcitabine is absent in nontransformed cells but is recapitulated across different PDAC cell lines, in PDAC organoids and in PDAC xenografts. Thus, we uncover roles for APOBEC3C and APOBEC3D in DNA replication stress resistance and offer plausible targets for improving gemcitabine-based therapies for PDAC.


Conflict of interest statement

DAT receives stock options from Leap Therapeutics, Surface Oncology, Sonata Therapeutics, and Mestag Therapeutics outside of the published work. DAT is scientific co-founder of Mestag Therapeutics. DAT has received research grant support from the Fibrogen, Mestag, and ONO Therapeutics. DAT receives grant funding from the Lustgarten Foundation, the NIH, and the Thompson Foundation. None of this work is related to the publication. TU and GWB were consultants for Repare Therapeutics. GWB received research support from Repare Therapeutics. No competing interests were reported by the remaining authors.

Figures

Extended Data Fig. 1.
Extended Data Fig. 1.. Generation of Cas9 stable cell lines and quality control analysis of CRISPR-Cas9 screen data.
a-b, Immunoblot analysis of Panc 08.13 and Panc 10.05 (panel a), and HPDE (panel b) pancreatic cell lines generated to stably express FLAG-Cas9. GAPDH or α-tubulin was used as a loading control. Data is representative of three biological replicates. c, Precision-recall curves for gene essentiality in HPAF-II and Panc 08.13 CRISPR-Cas9 screens with gemcitabine. Gene essentiality for each screen was determined by calculating the Bayes Factor, and then compared to reference nonessential and essential gene training sets from Kim and Hart (2021) to determine how well each screen performed. d-e, Total mapped sequencing reads for each of the CRISPR-Cas9 screens performed. Dashed line indicates the expected total read count if 200-fold coverage of the sgRNA library was achieved (14,139,400 total reads). f-i, Read counts of sgRNAs targeting non-essential (panels f and g) or essential (panels h and i) genes in each CRISPR-Cas9 screen. Non-essential and essential genes were classified using the gene lists by Kim and Hart (2021). Center lines represent the median and box limits indicate the 25th and 75th percentiles of each sample. Whiskers extend 1.5x the interquartile range and individual data points indicate outliers.
Extended Data Fig. 2.
Extended Data Fig. 2.. Assessing APOBEC3C- and APOBEC3D-mediated gemcitabine resistance in pancreatic cell lines and organoids.
a, Heatmap of the viability of A3C- and A3D-deficient pancreatic cancer (HPAF-II, Panc 08.13, Panc 10.05, AsPC-1, and BxPC-3) and non-transformed cell lines (HPDE, HPNE-hTERT, and RPE1-hTERT p53−/−) following gemcitabine treatment. Cell viability was assessed following seven days of gemcitabine treatment using CellTiter-Glo. Gemcitabine sensitivity for each A3C- or A3D-deficient cell line was determined by normalizing cell viability to that of the same cell line expressing a control sgRNA (sgLacZ or sgAAVS1) and is indicated on the heatmap. Data from three independent biological replicates are plotted. b-e, Quantification of A3C and A3D mRNA levels in HPAF-II (panel b), HPDE-Cas9 (panel c), HPNE-hTERT (panel d), and RPE1-hTERT-Cas9 p53−/− (panel e) A3C- and/or A3D-deficient cells by RT-qPCR analysis. A3C and A3D mRNA levels in each CRISPR-Cas9 knockout cell population was determined by comparing to the expression levels of each respective gene in the wildtype cell line. Three independent biological replicates are plotted, with bars indicating the medians. f, Immunoblot analysis of hT81 and hT82 pancreatic cancer organoids generated to stably express FLAG-Cas9. α-tubulin was used as a loading control. Data is representative of three independent replicates. g, Representative micrographs of hT81-Cas9 and hT82-Cas9 organoids following transduction with lentivirus co-expressing sgRNAs targeting A3D or A3C and eGFP to assess transduction efficiency prior to performing cell viability experiments. Scale bars, 100 µm. Data is representative of three biological replicates. h-i, Relative A3C and A3D mRNA levels in A3C- or A3D-deficient hT81-Cas9 (panel h) and hT82-Cas9 (panel i) pancreatic cancer organoids in comparison to each wildtype organoid population expressing sgLacZ. Bars represent the medians of three independent replicates.
Extended Data Fig 3.
Extended Data Fig 3.. Nab-paclitaxel increases gemcitabine sensitivity in PDAC cells lacking APOBEC3C or APOBEC3D.
a, Quantification of multinucleated HPAF-II cells following 50 or 100 nM nab-paclitaxel treatment for 72 hours. A minimum of 1691 cells were quantified for untreated (n = 1691) and 50 nM (n = 1709) and 100 nM (n = 1734) nab-paclitaxel conditions, with greater than 411 cells quantified for each sample per biological replicate. Statistical support was determined using two-tailed unpaired t-tests. Horizontal bars indicate the means of three biological replicates. b, Representative micrographs of HPAF-II cells treated with 0, 50, or 100 nM nab-paclitaxel in the experiments from panel a, with multinucleated cells labeled with arrowheads. Scale bar, 10 µm. a,b, Relate to Fig. 2k.
Extended Data Fig. 4.
Extended Data Fig. 4.. APOBEC3C and APOBEC3D expression levels are correlated and induced by the innate immune response and DNA damaging and replication stress-inducing agents.
a, mRNA expression levels of A3C and A3D in pancreatic tumors from the TCGA-PAAD project (n = 183). Median expression level of each gene is indicated. PGK1, housekeeping gene. b, Scatterplot matrix comparing mRNA expression levels of each pairwise APOBEC3 combination in pancreatic tumors from the ICGC PACA-CA cohort and COMPASS clinical trial (n = 430). Bottom half of the matrix depicts individual pairwise APOBEC3 expression scatterplots, with regression lines plotted. Top half of the matrix indicates the one-tailed Pearson’s coefficient (r) for each pairwise combination. c, Induction of A3A, A3B, A3C, and A3D mRNA levels following 72 hour treatment of HPAF-II cells with a range of interferon β concentrations (0, 0.1, 1, or 10 ng/mL), analyzed by RT-qPCR. Data was normalized to ACTB expression, and the fold-change of each mRNA was determined by comparing to untreated cells. Three independent biological replicates are plotted. d-g, Immunoblot analysis of HPAF-II cells transduced with sgAAVS1 (control), sgIRF3 (panel d), sgSTAT1 (panel e), sgSTAT2 (panel f), or sgRELA (panel g). GAPDH was used as a loading control. Relates to Fig. 3h. h,i, mRNA expression levels of A3C and A3D following treatment of Panc 08.13 (panel h) or Panc 10.05 (panel i) with the indicated DNA damaging and replication stress-inducing agents for 72 hours. Expression levels were measured by RT-qPCR and normalized to ACTB mRNA. Drug concentrations used were 500 nM gemcitabine, 5 µM cytarabine, 5 µM decitabine, 5 µM 5’azacytidine, 500 µM hydroxyurea, 1 µM cisplatin, 25 nM camptothecin, 2.5 µM AZD6738, 100 nM etoposide, 500 nM talazoparib, and 50 µM 5-fluorouracil. Cytidine analogues are indicated on each plot. Dashed line represents no expression level changes (fold-change of one), and bars represent the means of the replicates. Data is from two biological replicates.
Extended Data Fig. 5.
Extended Data Fig. 5.. A3C and A3D do not modulate gemcitabine resistance by activation of the innate immune response in pancreatic cancer cells.
a, Immunoblot analysis of phosphoSTAT1 Tyr701 in Panc 08.13 cells treated with 1 µM gemcitabine for 0, 24, 48, or 72 hours. α-tubulin was used as a loading control. b, mRNA expression levels of interferon-stimulated genes (CCL5, ISG15, and ISG45) in HPAF-II-Cas9 cells transduced with a sgRNA targeting LacZ (control), A3C, or A3D following 500 nM gemcitabine treatment for 72 hours. Fold-change in mRNA expression of each interferon-stimulated gene in gemcitabine relative to untreated conditions is plotted. Three independent biological replicates are plotted, and bars represent the means of the replicates. Statistical support was determined using two-tailed unpaired t-tests. n.s., not significant (p > 0.05).
Extended Data Fig. 6.
Extended Data Fig. 6.. Cytidine deaminase assays with APOBEC3A and APOBEC3C.
a, SDS-PAGE of purified recombinant A3A, A3C, and deaminase-dead A3CC97S/C100S from expression in insect cells, visualized with Coomassie Blue. Data is representative of three biological replicates. Relates to Fig. 5b,c. b, Schematic of the PCR-based in vitro cytidine deaminase assay used to determine whether A3A or A3C can deaminate gemcitabine in ssDNA. Either of two ssDNA substrates (one containing a single deoxycytidine and other containing gemcitabine in place of the deoxycytidine) were incubated with A3A or A3C for 2 hours at 37°C. DNA substrates from the in vitro reactions were then used as templates for PCR amplification, where deamination of deoxycytidine or gemcitabine introduces an MseI restriction enzyme site upon amplification that is cleaved to identify A3A or A3C deamination. Restriction enzyme digest products are then resolved on a nondenaturing gel to reveal cytidine deamination. Relates to Fig. 5b,c. c, Representative images of the restriction digest products generated from the in vitro cytidine deaminase assays using 0, 100, or 250 nM deaminase-dead (C97S/C100S) A3C. Data is representative of three independent replicates. Relates to Fig. 5b.
Extended Data Fig. 7.
Extended Data Fig. 7.. APOBEC3C and APOBEC3D deaminate deoxycytidines in genomic DNA, but not intracellular deoxycytidine or gemcitabine nucleosides.
a, Different stages of intracellular metabolism at which gemcitabine can be deaminated, leading to its inactivation. Gemcitabine can be deaminated at the free base level (dFdC) to generate dFdU, which is the major mode of gemcitabine inactivation within cells, but can also be deaminated in its monophosphorylated form (dFdCMP) and after it is incorporated into genomic DNA. b, Standard curve for deaminated gemcitabine (dFdU) bases by LC/MS analysis to confirm the lack of dFdU in genomic DNA samples is not due to the sensitivity of the mass spectrometer. Relates to Fig. 5d. c, Quantification of gemcitabine bases in genomic DNA isolated from parental and A3C- and A3D-deficient HPAF-II cells following 500 nM or 1 µM gemcitabine treatment for 24 hours by LC/MS. Data is normalized to levels of 13C15N2-dFdC (heavy dFdC) spiked into each sample and is representative of three independent experiments. Bars represent the means of the replicates, and significance was determined using two-tailed unpaired t-tests. d-j, Quantification of intracellular deoxycytidine (dC, dU, dCMP, dUMP, dCTP, and dUTP) and gemcitabine (dFdCMP) bases or nucleosides from parental and A3C- and A3D-deficient HPAF-II cells treated with 500 nM gemcitabine for 4 or 24 hours by LC/MS. The reduction in dU, dUMP, and dCTP levels following gemcitabine treatment has been previously described and are due to the inhibition of ribonucleotide reductase and thymidylate synthetase, respectively. Three biological replicates are plotted, and bars represent the means of the replicates. Statistical significance was assessed using two-tailed unpaired t-tests. k, Immunoblot analysis of HPAF-II cells engineered to disrupt the uracil DNA glycosylase gene UNG to allow for improved detection of nascent genomic uracils. α-tubulin was used as a loading control. l, Quantification of colony formation of HPAF-II-Cas9 cells transduced with a sgRNA targeting LacZ (control), A3C, or A3D. Cells were treated with 1 µM hydroxyurea for 14 days before colonies were stained and counted. Bars indicate the means of the two biological replicates.
Extended Data Fig. 8.
Extended Data Fig. 8.. APOBEC3C or APOBEC3D inactivation increases DNA replication stress in pancreatic cancer cells, but not in non-transformed cells.
a, Immunoblot analysis of RPA2 in HPAF-II-Cas9 cells transduced with sgLacZ (control), sgA3C, or sgA3D. Cells were treated with 1 µM gemcitabine for 24 hours and recovered for 0, 24, 48, or 72 hours prior to assessing replication stress response activation. α-tubulin was used as a loading control. Data is representative of three independent replicates. b, Quantification of chromatin-bound S phase RPA2 fluorescence intensity in parental and A3C- and A3D-deficient HPAF-II cells treated with 1 µM gemcitabine treatment for 24 hours. Three independent experiments are plotted. Relates to Fig. 6a. c-d, RPE1-hTERT-Cas9 p53−/− cells transduced with sgAAVS1 (control), sgA3C, or sgA3D were treated with 1 µM gemcitabine for 24 hours and chromatin-bound RPA2 fluorescence intensity was measured for each of three independent replicates. A minimum of 21 000 cells were analyzed per sample. Center lines represent the median and box limits indicate the 25th and 75th percentiles of each sample. Whiskers extend 1.5x the interquartile range and individual data points indicate outliers. Quantification of each of the three biological replicates are shown in panel d. e, Median RPA2 intensity in RPE1-hTERT-Cas9 p53−/− cells transduced with sgAAVS1, sgA3C, or sgA3D following 24 hour treatment with 1 µM gemcitabine. Three biological replicates are plotted. Circles with black borders represent the median of each replicate and black bars represent the median and first and last quartiles of all replicates. Untreated: n = 988 (sgAAVS1), n = 1204 (sgA3C), n = 924 (sgA3D). Gemcitabine-treated: n = 791 (sgAAVS1), n = 808 (sgA3C), n = 749 (sgA3D). A minimum of 216 cells were measured per replicate. f, Analysis of 53BP1 nuclear bodies in EdU-negative parental and A3C- and A3D-deficient HPAF-II cells following 24 hour treatment with 1 µM gemcitabine. Circles with black outlines represent the median of each replicate and black bars represent the median and first and last quartiles of all three replicates. Untreated: n = 1558 (parental), n = 1831 (A3C-deficient), n = 1605 (A3D-deficient). Gemcitabine-treated: n = 2113 (parental), n = 1784 (A3C-deficient), n = 1983 (A3D-deficient). A minimum of 316 cells were measured per replicate. g, Analysis of fluorescence intensity of chromatin-bound 53BP1 in parental and A3C- and A3D-deficient HPAF-II G1 cells treated with 1 µM gemcitabine for 24 hours. Three biological replicates are plotted. Relates to Fig. 6b. h, Representative flow cytometry plots for EdU incorporation in parental and A3C- and A3D-deficient HPAF-II cells following treatment with 1 µM gemcitabine for 24 hours. Relates to Fig. 6d. i, Percentage of parental and A3C- and A3D-deficient HPAF-II cells in each cell cycle phase following treatment with 1 µM gemcitabine for 24 hours. Three independent replicates are plotted. Bars for each cell cycle stage represent the means of the replicates, with the error bars showing the standard deviation. j, DNA combing analysis of RPE1-hTERT-Cas9 p53−/− cells transduced with sgAAVS1, sgA3C, or sgA3D. Cells were pulsed with CldU for 30 minutes, followed by a pulse with IdU for 30 minutes in the presence or absence of 500 nM gemcitabine. Untreated: n = 251 (sgAAVS1), n = 240 (sgA3C), n = 280 (sgA3D). Gemcitabine-treated: n = 232 (sgAAVS1), n = 209 (sgA3C), n = 259 (sgA3D). Statistical support was assessed using a two-tailed unpaired Mann-Whitney U test. k, Replication fork re-start assay in control (sgAAVS1) and A3C- and A3D-deficient RPE1-hTERT-Cas9 p53−/− cells. Cells were pulsed with CldU for 30 minutes, followed by treatment with 1 µM gemcitabine for 30 minutes and a 30 minute IdU pulse in drug-free media to assess the ability of replication forks to re-start DNA synthesis following gemcitabine. Quantification of elongated and stalled replication forks upon gemcitabine recovery is displayed. A total of n = 538 (sgAAVS1), n = 508 (sgA3C), and n = 480 (sgA3D) replication tracks were quantified per sample, with a minimum of 200 replication tracks analyzed for each of two biological replicates.
Extended Data Fig. 9.
Extended Data Fig. 9.. Analysis of base excision repair-, RAD51-, and translesion synthesis-mediated replication fork re-start following gemcitabine treatment.
a, Immunoblot analysis of HMCES in HPAF-II-Cas9 cells transduced with sgAAVS1 (control) or sgHMCES. α-tubulin was used as a loading control. b, Viability of HPAF-II-Cas9 cells transduced with sgAAVS1 or sgHMCES and treated with a range of gemcitabine concentrations for 72 hours. CellTiter-Glo was used to measure cell viability. Three independent biological replicates are plotted. Circles represent the means of the replicates and error bars indicate the standard deviations. c, Replication fork re-start assay in wildtype and HMCES-deficient HPAF-II cells. Cells were pulsed with CldU for 30 minutes, followed by treatment with 1 µM gemcitabine for 30 minutes and a 30 minute IdU pulse to assess the ability of replication forks to re-start DNA synthesis following gemcitabine treatment. A total of n = 585 (wildtype), n = 510 (HMCES-1-deficient), and n = 593 (HMCES-2-deficient) replication tracks were quantified, with a minimum of 229 replication tracks analyzed per sample for each replicate. Quantification of elongated and stalled replication forks upon gemcitabine recovery is plotted. Bars indicate the means of the replicates. d, Cell viability analyses of HPAF-II-Cas9 cells transduced with sgLacZ (control), sgSMUG1, sgAPEX1, or sgAPEX2 and treated with the indicated gemcitabine concentrations for 72 hours, measured by CellTiter-Glo. Data from three independent replicates are plotted, with circles and error bars representing the means and standard deviations of the replicates. e, Representative micrographs of EdU-positive RAD51 foci in parental and A3C- and A3D-deficient HPAF-II cells following 1 µM gemcitabine treatment quantified in Fig. 6i. Scale bars, 10 µm. f, Median number of S phase RAD51 foci in each biological replicate of the experiments performed in Fig. 6i. g, Analysis of S phase (EdU-positive) RAD51 foci in parental and A3C- and A3D-deficient HPAF-II cells following 5 µM mitomycin C treatment for 24 hours. The number of RAD51 foci per cell are plotted, where circles with black outlines indicate the median of each replicate and black bars represent the median and first and last quartiles of all three replicates. Untreated: n = 1787 (parental), n = 1073 (A3C-deficient), n = 1058 (A3D-deficient). Mitomycin C: n = 1044 (parental), n = 718 (A3C-deficient), n = 636 (A3D-deficient). A minimum of 201 cells were analyzed per biological replicate. Statistical support was assessed using a two-tailed unpaired Mann-Whitney U test. n.s., not significant (p > 0.05). h, Quantification of S phase (EdU-positive) 53BP1 foci in parental and A3C- and A3D-deficient HPAF-II cells following 1 µM gemcitabine for 24 hours. Circles with black outlines represent the median of each replicate and black bars represent the median and first and last quartiles of all three replicates. Untreated: n = 843 (parental), n = 847 (A3C-deficient), n = 761 (A3D-deficient). Gemcitabine: n = 935 (parental), n = 960 (A3C-deficient), n = 847 (A3D-deficient). Two-tailed unpaired Mann-Whitney U tests were used to determine statistical significance and asterisks (***) indicate a p-value < 0.001 in each of the three independent experiments. n.s., not significant (p > 0.05). i, Immunoblot analysis of POLH in HPAF-II-Cas9 cells transduced with sgAAVS1 or sgPOLH. α-tubulin was used as a loading control. Data is representative of three independent replicates. Related to Fig. 6j,k.
Fig. 1.
Fig. 1.. Genome-wide CRISPR-Cas9 screens reveal modulators of gemcitabine sensitivity.
a, Schematic illustrating the workflow of the genome-wide CRISPR-Cas9 screens with gemcitabine in pancreatic cancer cells. b, NormZ score plots illustrating the enrichment and depletion for genes targeted in the chemical-genetic HPAF-II and Panc 08.13 screens with gemcitabine. Genes chosen for mechanistic analyses are labeled (APOBEC3C and APOBEC3D), and genes that are known modulators of gemcitabine sensitivity are bolded. c, Venn diagram of gene hits (normZ score of ≤ −2 for sensitizers and ≥ 4 for sensitizers and resistance genes with false discovery rates (FDR) lower than 15%) in the two cell lines screened. d, Gene ontology (GO) Biological Process term enrichment for the 36 resistance genes that overlapped between the HPAF-II and Panc 08.13 screens. Circle size indicates the number of genes out of the 36 enriched in each GO term, circle color indicates the negative log FDR value, and x-axis position indicates fold-enrichment of each GO term compared to the whole genome reference set. Statistical support was determined using a Fisher’s exact test with Bonferroni correction. e, Heatmap illustrating the response to gemcitabine of five pancreatic cancer cell lines and the non-transformed pancreatic epithelial cell line HPDE harboring the indicated CRISPR-Cas9 knockouts. Individual sgRNAs targeting the genes of interest were introduced into each Cas9 stable cell line and each polyclonal cell population was treated with 1 µM gemcitabine. Cell viability was measured after 72 hours using alamarBlue and normalized to the viability of the same respective cell line expressing sgLacZ (control). Genes whose loss conferred resistance or sensitivity in at least four out of six cell lines are labeled as ‘pan-resistance genes’ or ‘pan-sensitizers’. Heatmap scale extends from a relative cell viability value of 0.4 (sensitive; magenta) to 1.2 (resistant; teal), with white representing no change in gemcitabine sensitivity (relative cell viability of 0.8). n = 3 independent transductions and cell viability experiments.
Fig. 2.
Fig. 2.. APOBEC3C and APOBEC3D promote DNA replication stress resistance in pancreatic cancer.
a, Schematic of two-color competitive growth assays in the presence and absence of gemcitabine. b, Two-color competitive growth assays where HPAF-II-Cas9 (left panel) or Panc 08.13-Cas9 (right panel) cells co-expressing mCherry and sgLacZ (control) were mixed with cells expressing either GFP and sgLacZ or GFP and sgA3D, and cultured in the presence or absence of 100 nM (HPAF-II) or 200 nM (Panc 08.13) gemcitabine for 18 days. The number of mCherry- and GFP-expressing cells was determined every three days, and the relative fraction of each GFP-positive population at each time point is plotted. n = 3 independent transductions and competitive growth assays. Circles and error bars indicate the mean and standard deviation. c, Viability of HPAF-II-Cas9 cells transduced with a sgRNA targeting LacZ or one of the seven APOBEC3 genes following 10 µM gemcitabine treatment. Cell viability was measured after 72 hours using alamarBlue and normalized to each untreated cell population. n = 3 independent transductions and cell viability experiments. Horizontal bars indicate the means. * p < 0.05 (sgA3A: 0.0118) and *** p < 0.001 (sgA3C: 0.0014 and sgA3D: 0.0025); two-tailed unpaired t-test. d, Viability of HPAF-II-Cas9 cells transduced with sgLacZ, sgA3C, or sgA3D and treated with a range of gemcitabine concentrations for 72 hours. alamarBlue was used to measure cell viability. e, Quantification of colony formation of HPAF-II-Cas9 cells transduced with sgLacZ, sgA3C, or sgA3D. Cells were treated with 10 nM gemcitabine for three days and propagated in drug-free media for 11 days before colonies were stained and counted. Horizontal bars indicate the means (n = 3 independent transductions and clonogenic survival assays). * p < 0.05 (sgA3C: 0.0332 and sgA3D: 0.0235); two-tailed unpaired t-test. f,g, Viability of HPDE-Cas9 (panel f) and HPNE-hTERT (panel g) cells transduced with sgAAVS1 (control), sgA3C, or sgA3D following gemcitabine treatment. Cell viability was measured after 72 hours using CellTiter-Glo. h, Viability of RPE1-hTERT-Cas9 p53−/− cells transduced with sgAAVS1, sgA3C, or sgA3D and treated with a range of gemcitabine concentrations for 72 hours. Cell viability was measured using CellTiter-Glo. i,j, Viability of hT81-Cas9 (panel i) and hT82-Cas9 (panel j) pancreatic cancer organoids transduced with sgLacZ, sgA3C, or sgA3D and treated with the indicated gemcitabine concentrations. Cell viability was measured after five days using CellTiter-Glo. k, Viability of parental and A3C- and A3D-deficient HPAF-II cells treated with 250 nM gemcitabine in the presence of 0 or 100 nM nab-paclitaxel for seven days, measured using CellTiter-Glo. n = 3 independent cell viability experiments, with horizontal bars representing the means. * p < 0.05 (sgA3D + 250 nM gem: 0.0149 and sgA3D + 100 nM nab-paclitaxel: 0.0109) and ** p < 0.01 (sgA3C + combination: 0.0069 and sgA3D + combination: 0.0088); two-tailed unpaired t-test. For panels d,f-j, n = 3 independent transductions and cell viability experiments, except for panel d where n = 4. Circles and error bars in the plots represent the mean and standard deviation of the independent experiments.
Fig. 3.
Fig. 3.. APOBEC3C and APOBEC3D expression regulation.
a, mRNA levels of A3C and A3D in pancreatic cancer cell lines and organoids from DepMap CCLE data (n = 55), and in pancreatic tumors from the ICGC PACA-CA and COMPASS trial cohorts (n = 430). Levels of A3C and A3D in HPAF-II and Panc 08.13 cells are highlighted. PGK1, housekeeping gene. b, Fold-change in A3C and A3D mRNA levels following 72 hours of 25 nM (HPNE-hTERT), 5 nM (HPDE), or 500 nM (HPAF-II, Panc 08.13, RPE1-hTERT-Cas9 p53−/−) gemcitabine treatment, measured by RT-qPCR analysis, and normalized to GAPDH or ACTB. Horizontal bars indicate the means (n = 3 independent RT-qPCR experiments). * p < 0.05 (HPDE A3C: 0.0237), ** p < 0.01 (Panc 08.13 A3C: 0.0022), and *** p < 0.001 (HPAF-II A3C: 0.0006, HPAF-II A3D: 0.0001, and Panc 08.13 A3D: 0.0001); two-tailed unpaired t-test. c, Scatterplots comparing mRNA levels of A3C and A3D in pancreatic tumors from ICGC PACA-CA and the COMPASS trial (n = 430) or from the TCGA-PAAD cohort (n = 183). Regression lines are plotted, and one-tailed Pearson’s coefficients and the corresponding p-values are indicated. d, Induction of A3C and A3D mRNA expression following 500 nM gemcitabine treatment for 72 hours in control (sgLacZ) and A3C- and A3D-deficient HPAF-II cells. Data were normalized to GAPDH levels, and fold-change in expression compared to untreated cells is plotted. n = 2 independent transductions and RT-qPCR experiments. Horizontal bars represent the means. e, HPAF-II-Cas9 cells transduced with sgLacZ, sgA3C, or sgA3D were treated with 500 nM gemcitabine for 72 hours, and levels of A3A and A3B mRNA were measured by RT-qPCR. Data were normalized to ACTB. n = 2 independent transductions and RT-qPCR experiments, where horizontal bars represent the means. f, Induction of A3C and A3D mRNA following treatment of HPAF-II cells with the indicated DNA damaging and replication stress-inducing agents for 72 hours. Expression was measured by RT-qPCR and normalized to ACTB mRNA. Data from n = 2 RT-qPCR experiments is plotted, with cytidine analogues indicated. Dashed lines indicate a fold-change of one. Horizontal bars indicate the means of the independent experiments. g, mRNA levels of A3A, A3B, A3C, and A3D following 24 hour treatment of HPAF-II cells with interferon β, analyzed by RT-qPCR. Data were normalized to ACTB expression, and the fold-change of each mRNA was determined by comparing to untreated cells. n = 3 independent RT-qPCR experiments. h, Fold-change in A3C and A3D mRNA levels following 72 hours of 500 nM gemcitabine treatment in HPAF-II cells transduced with sgAAVS1 (control), sgIRF3, sgSTAT1, sgSTAT2, or sgRELA. Expression levels were measured by RT-qPCR and normalized to ACTB. Horizontal bars represent the means (n = 3 independent transductions and RT-qPCR experiments). * p < 0.05, ** p < 0.01; two-tailed unpaired t-test.
Fig. 4.
Fig. 4.. APOBEC3C and APOBEC3D promote DNA replication stress resistance independent of their roles in innate immunity.
a, Quantification of mean fluorescence intensity of cytosolic ssDNA in HPAF-II-Cas9 cells transduced with a sgRNA targeting LacZ (control), A3C, or A3D, following treatment with 1 µM gemcitabine for 72 hours. Cells were quantified for untreated (n = 207 (wildtype), n = 208 (A3C-deficient), n = 202 (A3D-deficient)) and gemcitabine ((n = 274 (wildtype), n = 210 (A3C-deficient), n = 212 (A3D-deficient)) conditions. n = 3 independent transductions and immunostainings. Statistical support was assessed using a two-tailed unpaired Mann-Whitney U test. n.s., not significant (p > 0.05). b, Representative micrographs showing cytosolic ssDNA following 1 µM gemcitabine treatment for 72 hours from the immunostainings from panel a. Scale bars, 10 µm. c, Immunoblot analysis of phosphoSTAT1 Tyr701, a marker of innate immune response activation, in HPAF-II-Cas9 cells transduced with sgLacZ, sgA3C, or sgA3D. Cells were treated with 1 µM gemcitabine for 24 hours and recovered for 0, 24, 48, or 72 hours prior to assessing activation of the innate immune response. α-Tubulin was used as a loading control. Data is representative of n = 3 independent immunoblots. d, Degree of type I interferon response activation in HPAF-II-Cas9 cells transduced with sgLacZ, sgA3C, sgA3D, or sgTREX1 treated with 0 or 500 nM gemcitabine and recovered for 0 or 72 hours in drug-free media. Supernatant was collected from cells following the indicated treatment and recovery periods, co-incubated with the type I interferon reporter cell line HEK-Blue IFN α/β for 24 hours and used to assess the relative amounts of type I interferon produced. Inactivation of TREX1 served as a positive control for type I interferon response activation. Horizontal bars indicate the means (n = 3 independent transductions and type I interferon reporter assays). Statistical support was evaluated using a two-tailed unpaired t-test. n.s., not significant (p > 0.05).
Fig. 5.
Fig. 5.. APOBEC3C and APOBEC3D confer DNA replication stress resistance by genomic cytidine deamination.
a, Quantification of colony formation of A3C- and A3D-deficient HPAF-II cells engineered to stably express doxycycline-inducible A3A, A3C, or A3D, the indicated deaminase-dead mutants of A3C or A3D, or carrying the empty vector. Cells were treated with 5 nM gemcitabine for three days and propagated in drug-free media for 11 days before colonies were stained, counted, and normalized to untreated cells. n = 3 independent clonogenic survival assays. Horizontal bars indicate the means. * p < 0.05 (HPAF-II A3CKO + A3D: 0.0175), ** p < 0.01 (HPAF-II A3DKO + A3C: 0.0013), and *** p < 0.001 (HPAF-II A3CKO + A3C: 0.0001 and HPAF-II A3DKO + A3D: 0.0001); two-tailed unpaired t-test. b,c, In vitro cytidine deaminase assays with the indicated concentrations of wildtype or deaminase dead (C97S/C100S) A3C (panel b), or A3A (panel c) with ssDNA substrate containing deoxycytidine (dC) or gemcitabine (dFdC). n = 3 independent in vitro assays, with representative gel images shown on the right. d, Quantification of deaminated gemcitabine nucleosides (dFdU) in genomic DNA isolated from HPAF-II cells by liquid chromatography coupled to mass spectrometry (LC/MS) following 500 nM or 1 µM gemcitabine treatment for 24 or 72 hours. n = 3 independent experiments. Horizontal bars represent the means. e-g, Quantification of intracellular gemcitabine nucleosides (dFdC, dFdU, and dFdCTP) from parental or A3C- or A3D-deficient HPAF-II cells treated with 500 nM gemcitabine for 4 or 24 hours by LC/MS. Horizontal bars indicate the means (n = 3 independent experiments). Statistical support was evaluated using a two-tailed unpaired t-test. n.s., not significant (p > 0.05). h, Quantification of uracils in genomic DNA isolated from UNG-deficient HPAF-II cells by dot blot analysis following 1 µM gemcitabine treatment for 72 hours. n = 3 independent experiments. Horizontal bars indicate the means and error bars indicate the standard deviations. A two-tailed unpaired t-test was used to determine statistical support.
Fig. 6.
Fig. 6.. Cytidine deamination by APOBEC3C and APOBEC3D promotes DNA replication fork re-start and repair in gemcitabine conditions.
a, Quantification of chromatin-bound RPA2 fluorescence intensity in S phase cells. Parental and A3C- and A3D-deficient HPAF-II cells were treated with 0 or 1 µM gemcitabine for 24 hours prior to flow cytometric analysis of EdU content and chromatin-bound RPA2. Untreated: n = 4291 (parental), n = 3314 (A3C-deficient), n = 3579 (A3D-deficient). Gemcitabine: n = 9161 (parental), n = 9014 (A3C-deficient), n = 8317 (A3D-deficient). Data is representative of n = 3 independent experiments. Statistical support was assessed using a two-tailed unpaired Mann-Whitney U test. b, Analysis of fluorescence intensity of chromatin-bound 53BP1 in G1 HPAF-II cells (EdU-negative 1C DNA content cells) following 24 hour treatment with 1 µM gemcitabine. Untreated: n = 11607 (parental), n = 11956 (A3C-deficient), n = 13691 (A3D-deficient). Gemcitabine: n = 3953 (parental), n = 6628 (A3C-deficient), n = 2907 (A3D-deficient). Data is representative of n = 3 independent experiments. Two-tailed unpaired Mann-Whitney U tests were used to determine statistical support. Center lines represent the median and box limits indicate the 25th and 75th percentiles of each sample. Whiskers extend 1.5x the interquartile range and individual data points indicate outliers in a,b. c, Quantification of micronuclei in HPAF-II-Cas9 cells transduced with sgAAVS1 (control), sgA3C, or sgA3D and treated with 0 or 1 µM gemcitabine for 72 hours. Untreated: n = 978 (wildtype), n = 987 (A3C-deficient), n = 1003 (A3D-deficient). Gemcitabine: n = 942 (wildtype), n = 922 (A3C-deficient), n = 923 (A3D-deficient). A minimum of 303 cells were quantified per sample in each experiment (n = 3 independent transductions and micronuclei counts). Horizontal bars indicate the means. Representative micrographs are shown on the right, with micronuclei labeled with arrowheads. Scale bar, 10 µm. * p < 0.05 (A3CKO: 0.0159 and A3DKO: 0.0397) and *** p < 0.001 (A3CKO + gem: 0.0001 and A3DKO + gem: 0.0006); two-tailed unpaired t-test. d, Quantification of EdU fluorescence intensity in parental and A3C- and A3D-deficient HPAF-II cells following treatment with 0 or 1 µM gemcitabine for 24 hours. Untreated: n = 8606 (parental), n = 7059 (A3C-deficient), and n = 7400 (A3D-deficient). Gemcitabine: n = 15280 (parental), n = 16794 (A3C-deficient), and n = 20858 (A3D-deficient). Data is representative of n = 3 independent experiments. Statistical support was assessed using a two-tailed unpaired Mann-Whitney U test. Center lines represent the median and box limits indicate the 25th and 75th percentiles. Whiskers extend 1.5x the interquartile range and individual data points indicate outliers. e, DNA combing analysis of parental and A3C- and A3D-deficient HPAF-II cells. Cells were pulsed with CldU for 30 minutes, followed by a pulse with IdU for 30 minutes in the presence or absence of 1 µM gemcitabine. Untreated: n = 599 (parental), n = 614 (A3C-deficient), n = 443 (A3D-deficient). Gemcitabine: n = 438 (parental), n = 361 (A3C-deficient), n = 352 (A3D-deficient). A minimum of 169 replication tracks were analyzed per experiment (n = 2 independent DNA combing experiments). Horizontal bars indicate the means. Statistical support was assessed with a two-tailed unpaired Mann-Whitney U test. *** p < 0.001. f, Percentage of stalled replication forks in the DNA combing experiments from panel e, with representative images of stalled replication forks shown. CldU tracks with no adjacent IdU label or with a single pixel of IdU were categorized as stalled replication forks. Greater than 300 replication tracks were analyzed per sample for each of the two independent DNA combing experiments. Horizontal bars indicate the means. g, Replication fork re-start assay in parental and A3C- and A3D-deficient HPAF-II cells. Cells were pulsed with CldU for 30 minutes, followed by treatment with 1 µM gemcitabine for 30 minutes and a 30 minute IdU pulse in drug-free media to assess the ability of replication forks to re-start DNA synthesis. The percentage of elongated and stalled replication forks after gemcitabine recovery is plotted. n = 1798 (parental), n = 1516 (A3C-deficient), n = 1724 (A3D-deficient) replication tracks, with a minimum of 229 replication tracks analyzed per sample for each experiment (n = 2 independent replication fork re-start assays). * p < 0.05 (A3CKO: 0.0244 and A3DKO: 0.0296); two-tailed unpaired t-test. h, Colony formation of HPAF-II-Cas9 cells transduced with sgLacZ or sgUNG. Cells were treated with 10 nM gemcitabine for three days and propagated in drug-free media for 11 days before colonies were stained and counted. n = 3 independent transductions and clonogenic survival assays, with representative micrographs shown. Horizontal bars indicate the means. * p = 0.0224; two-tailed unpaired t-test. i, Analysis of RAD51 foci in parental and A3C- and A3D-deficient HPAF-II cells following 1 µM gemcitabine treatment for 24 hours. The number of RAD51 foci per S phase cell are plotted, where circles with black outlines indicate the median of each experiment and black bars represent the median and first and last quartiles of all three independent immunostainings. Untreated: n = 1443 (parental), n = 2544 (A3C-deficient), n = 1480 (A3D-deficient), n = 1414 (A3C- and A3D-deficient). Gemcitabine: n = 974 (parental), n = 2218 (A3C-deficient), n = 1625 (A3D-deficient), n = 913 (A3C- and A3D-deficient). Greater than 205 cells were analyzed per sample for each independent experiment. Statistical support was assessed with a two-tailed unpaired Mann-Whitney U test. *** p < 0.001. n.s., not significant (p > 0.05). j, Viability of HPAF-II-Cas9 cells transduced with sgAAVS1 or sgPOLH and treated with the indicated gemcitabine concentrations for seven days. CellTiter-Glo was used to measure cell viability. n = 3 independent transductions and cell viability experiments. Circles indicate the means and error bars represent the standard deviations. k, Replication fork re-start assay in wildtype and POLH-deficient HPAF-II cells. Cells were pulsed with CldU for 30 minutes, followed by treatment with 1 µM gemcitabine for 30 minutes and a 30 minute IdU pulse in the presence or absence of 5 µM JH-RE-06. n = 1014 (wildtype), n = 1616 (POLH-1-deficient), n = 1866 (POLH-2-deficient), and n = 1700 (JH-RE-06-treated) replication tracks were quantified, with a minimum of 229 replication tracks analyzed per sample for each experiment (n = 3 independent transductions and replication fork re-start assays). Percentage of elongated and stalled replication forks following gemcitabine recovery is plotted. * p < 0.05 (sgPOLH-1: 0.0271) and ** p < 0.01 (sgPOLH-2: 0.005 and JH-RE-06: 0.0073); two-tailed unpaired t-test.
Fig. 7.
Fig. 7.. APOBEC3C and APOBEC3D contribute to cell survival following therapeutic replication stress in pancreatic cancer cells.
a,b, Growth of tumor xenografts of parental and A3C- (panel a) or A3D-deficient (panel b) HPAF-II cells in NOD SCID mice treated with either gemcitabine or vehicle. Mice were treated with 50 mg/kg (panel a) or 75 mg/kg (panel b) gemcitabine intraperitoneally once a week for the duration of the experiments. Data are presented as mean tumor volume, with error bars representing the standard error of the mean. n = 8 mice per experimental group, except for A3C-deficient tumors treated with gemcitabine (n = 9). Statistical support was determined by a linear mixed-effects model with Geisser-Greenhouse correction. c, Model of how A3C and A3D contribute to promoting DNA replication stress resistance to gemcitabine in pancreatic cancer cells. A3C and A3D mRNA expression is transcriptionally induced by gemcitabine and the preferred substrate for APOBEC3 enzymes, ssDNA, is exposed at DNA replication forks due to the replication stress caused by gemcitabine. A3C and A3D likely deaminate deoxycytidines to deoxyuridine in the exposed ssDNA. Uracil bases are then removed by uracil DNA glycosylase (UNG), leaving abasic sites. Exposed abasic sites could subsequently recruit translesion synthesis (TLS) polymerases and RAD51 to sites of cytidine deamination to promote replication fork re-start, ultimately increasing cell survival following gemcitabine-induced replication stress.

References

    1. Gorgoulis VG et al. Activation of the DNA damage checkpoint and genomic instability in human precancerous lesions. Nature 434, 907–913 (2005). - PubMed
    1. Bartkova J et al. DNA damage response as a candidate anti-cancer barrier in early human tumorigenesis. Nature 434, 864–870 (2005). - PubMed
    1. Knijnenburg TA et al. Genomic and molecular landscape of DNA damage repair deficiency across The Cancer Genome Atlas. Cell Reports 23, 239–254 (2018). - PMC - PubMed
    1. Ubhi T & Brown GW Exploiting DNA replication stress for cancer treatment. Cancer Research 79, 1730–1739 (2019). - PubMed
    1. Hertel LW et al. Evaluation of the antitumor activity of gemcitabine (2’,2’-difluoro-2’-deoxycytidine). Cancer Research 50, 4417–22 (1990). - PubMed

Methods-only references

    1. Tiriac H et al. Organoid profiling identifies common responders to chemotherapy in pancreatic cancer. Cancer Discovery 8, 1112–1129 (2018). - PMC - PubMed
    1. Noordermeer SM et al. The shieldin complex mediates 53BP1-dependent DNA repair. Nature 560, 117–121 (2018). - PMC - PubMed
    1. Olivieri M et al. A genetic map of the response to DNA damage in human cells. Cell 182, 481–496 (2020). - PMC - PubMed
    1. Kim E & Hart T Improved analysis of CRISPR fitness screens and reduced off-target effects with the BAGEL2 gene essentiality classifier. Genome Medicine 13, 1–11 (2021). - PMC - PubMed
    1. Mi H, Muruganujan A, Casagrande JT & Thomas PD Large-scale gene function analysis with the PANTHER classification system. Nature Protocols 8, 1551–1566 (2013). - PMC - PubMed

MeSH terms

LinkOut - more resources