. 2024 Jul;31(7):1039-1049.
doi: 10.1038/s41594-024-01245-2. Epub 2024 Mar 6.

Guiding the HBO1 complex function through the JADE subunit

Affiliations

Guiding the HBO1 complex function through the JADE subunit

Nitika Gaurav et al. Nat Struct Mol Biol. 2024 Jul.

Abstract

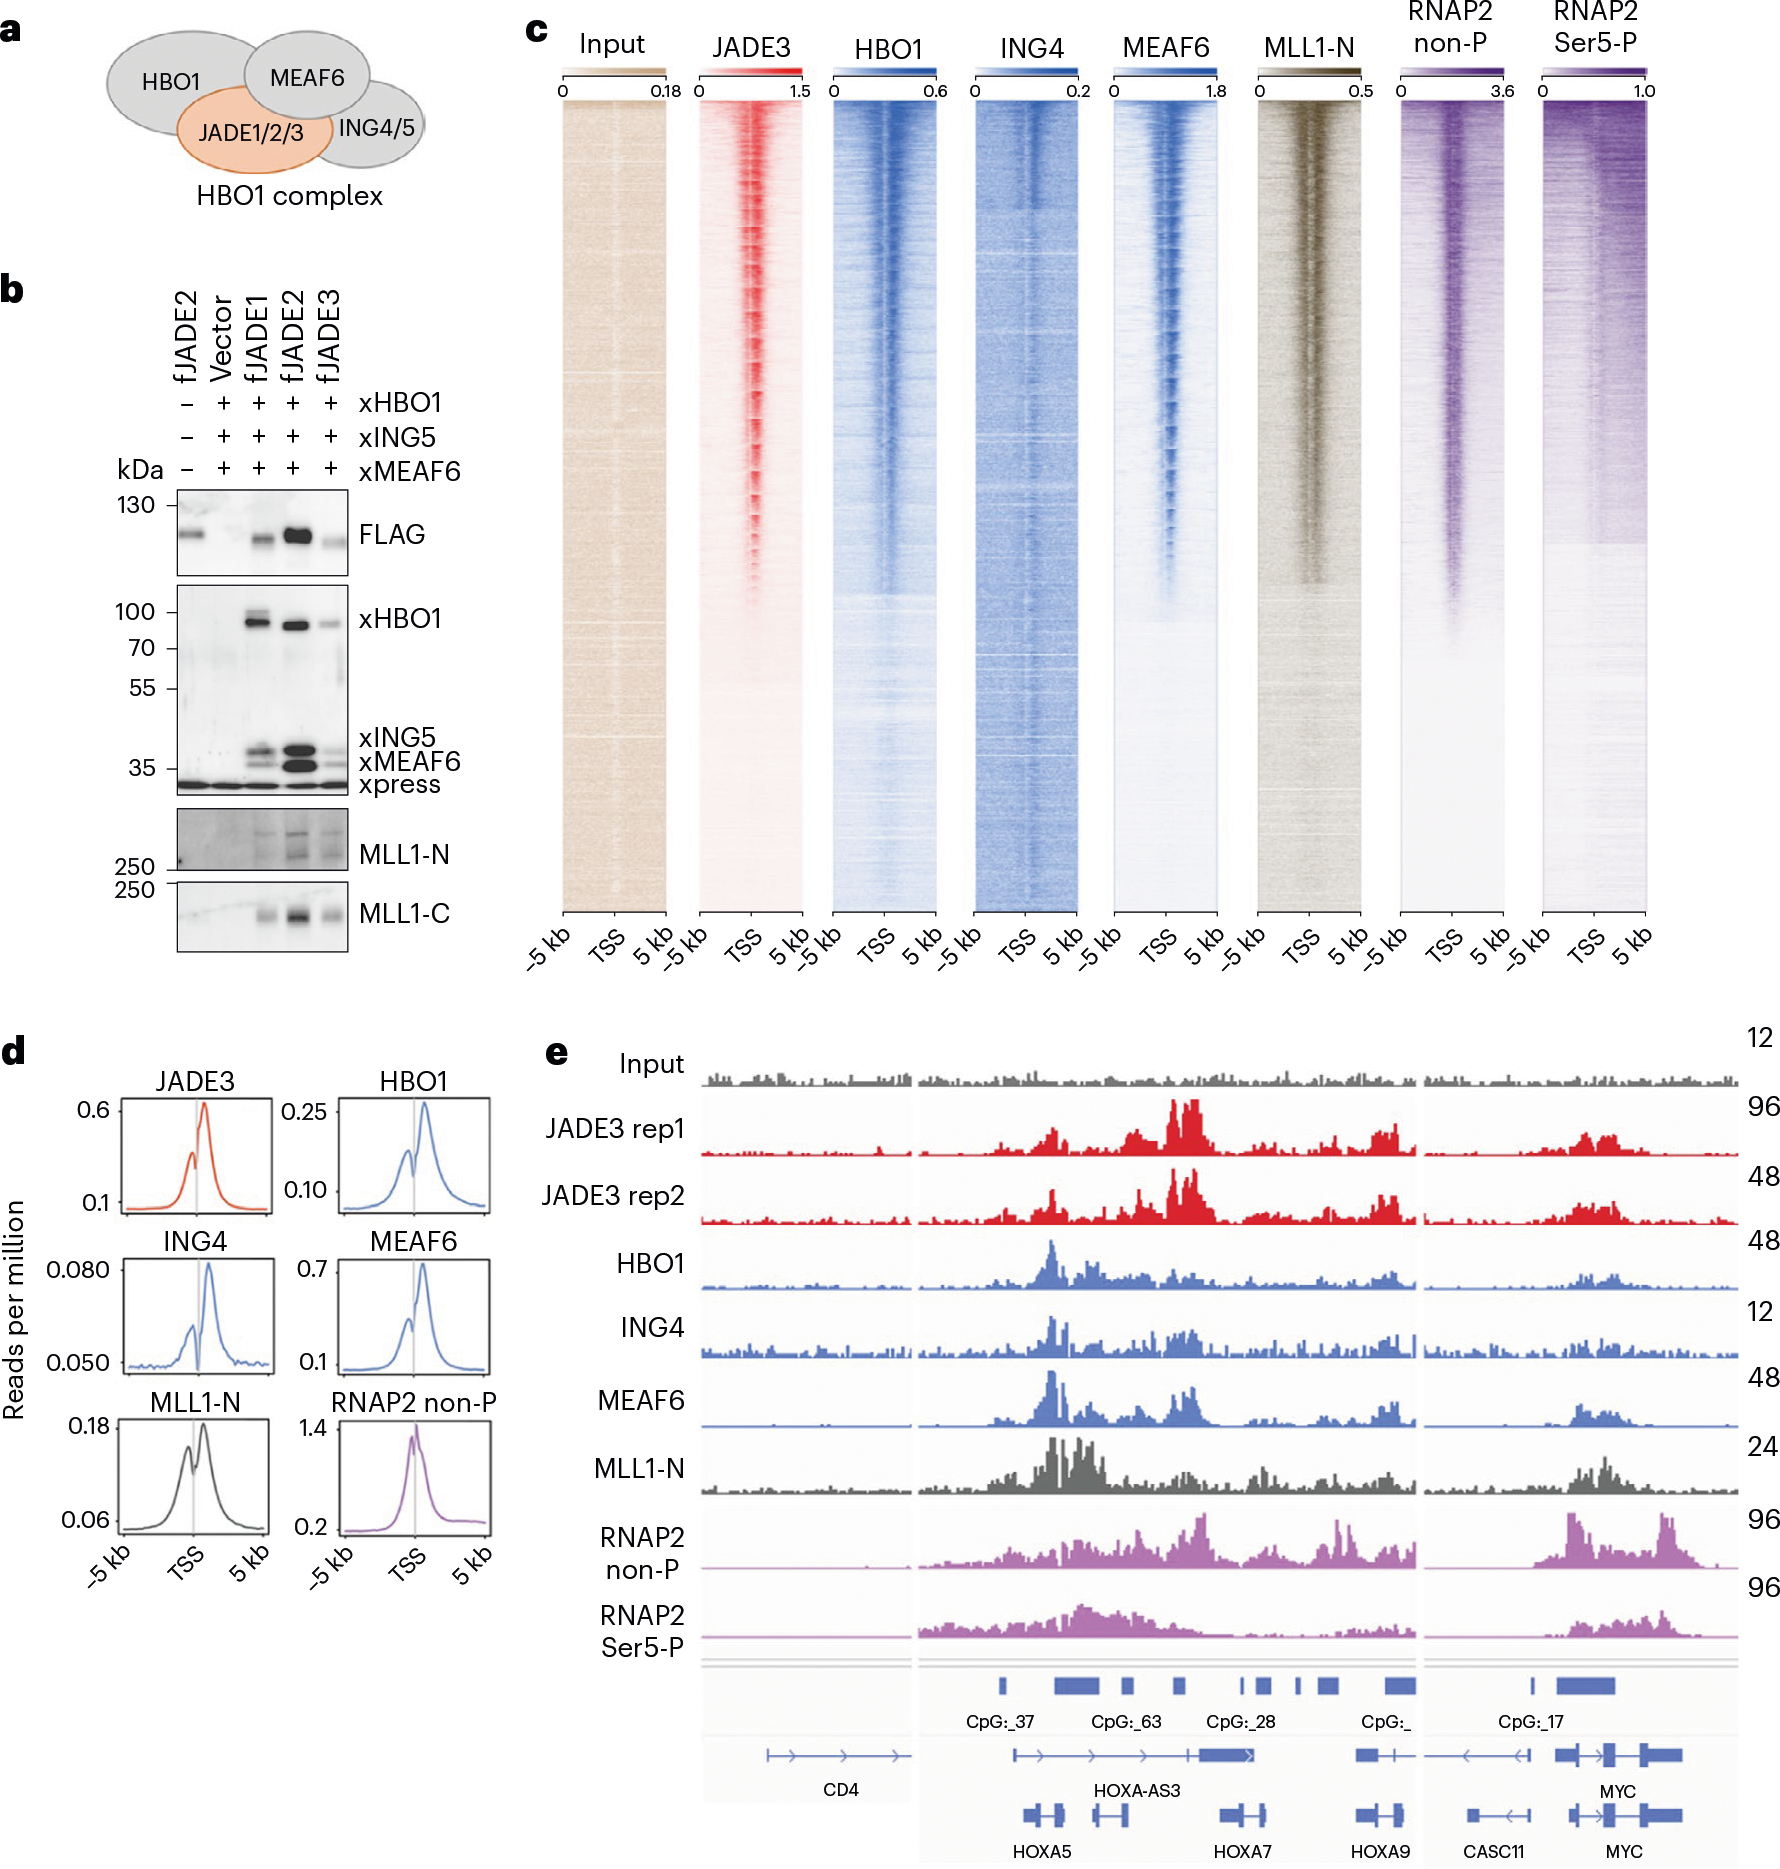
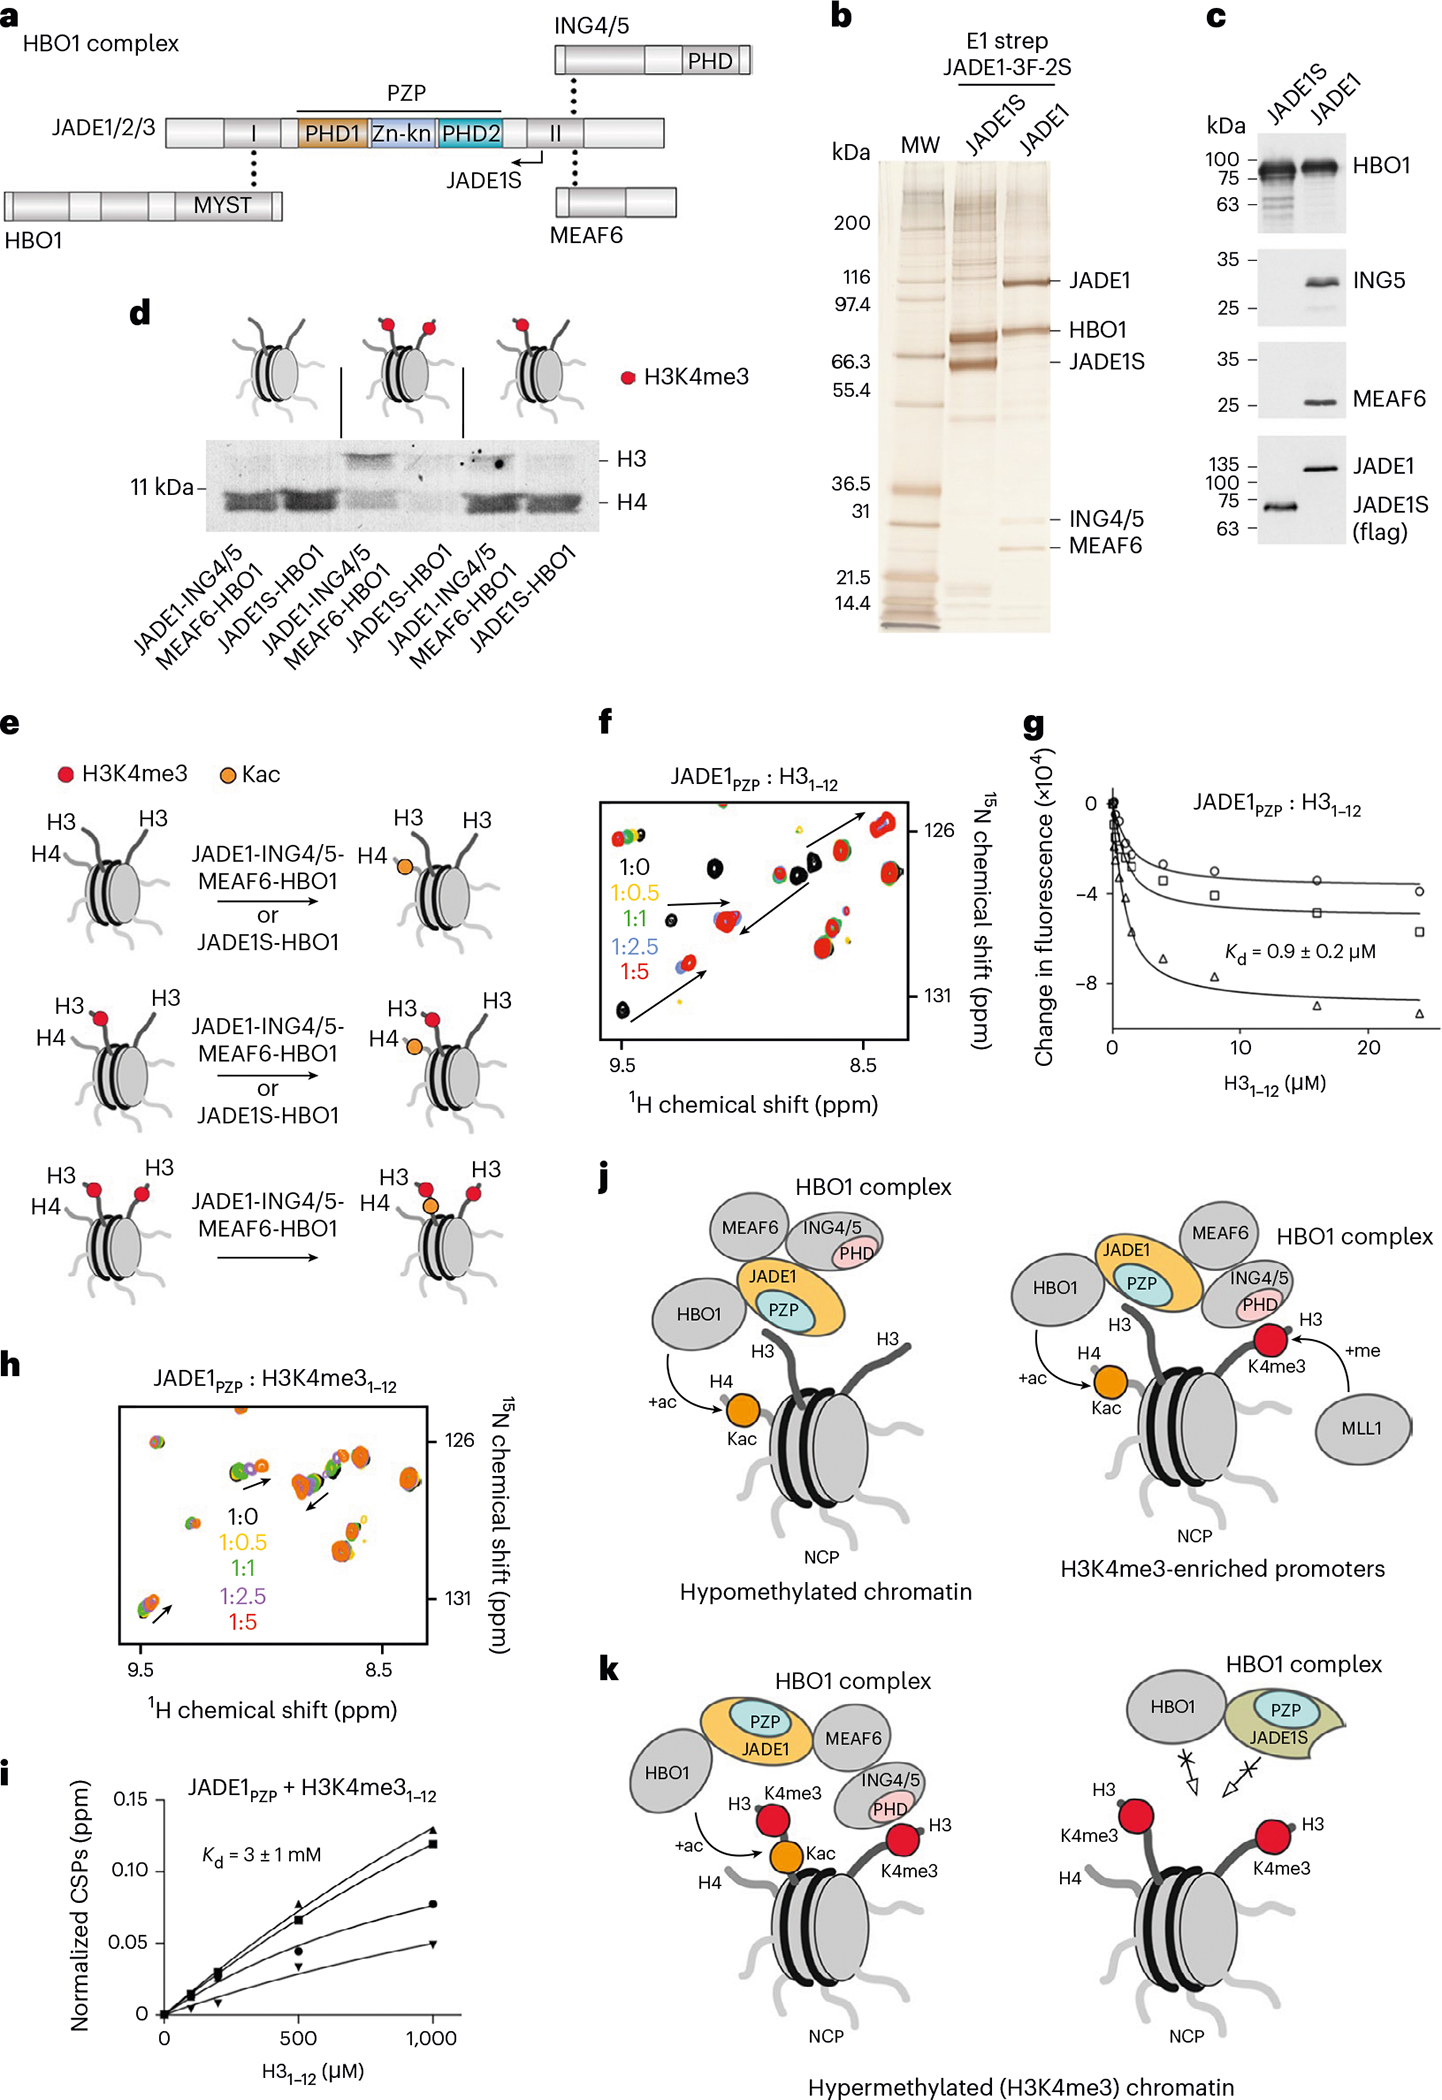
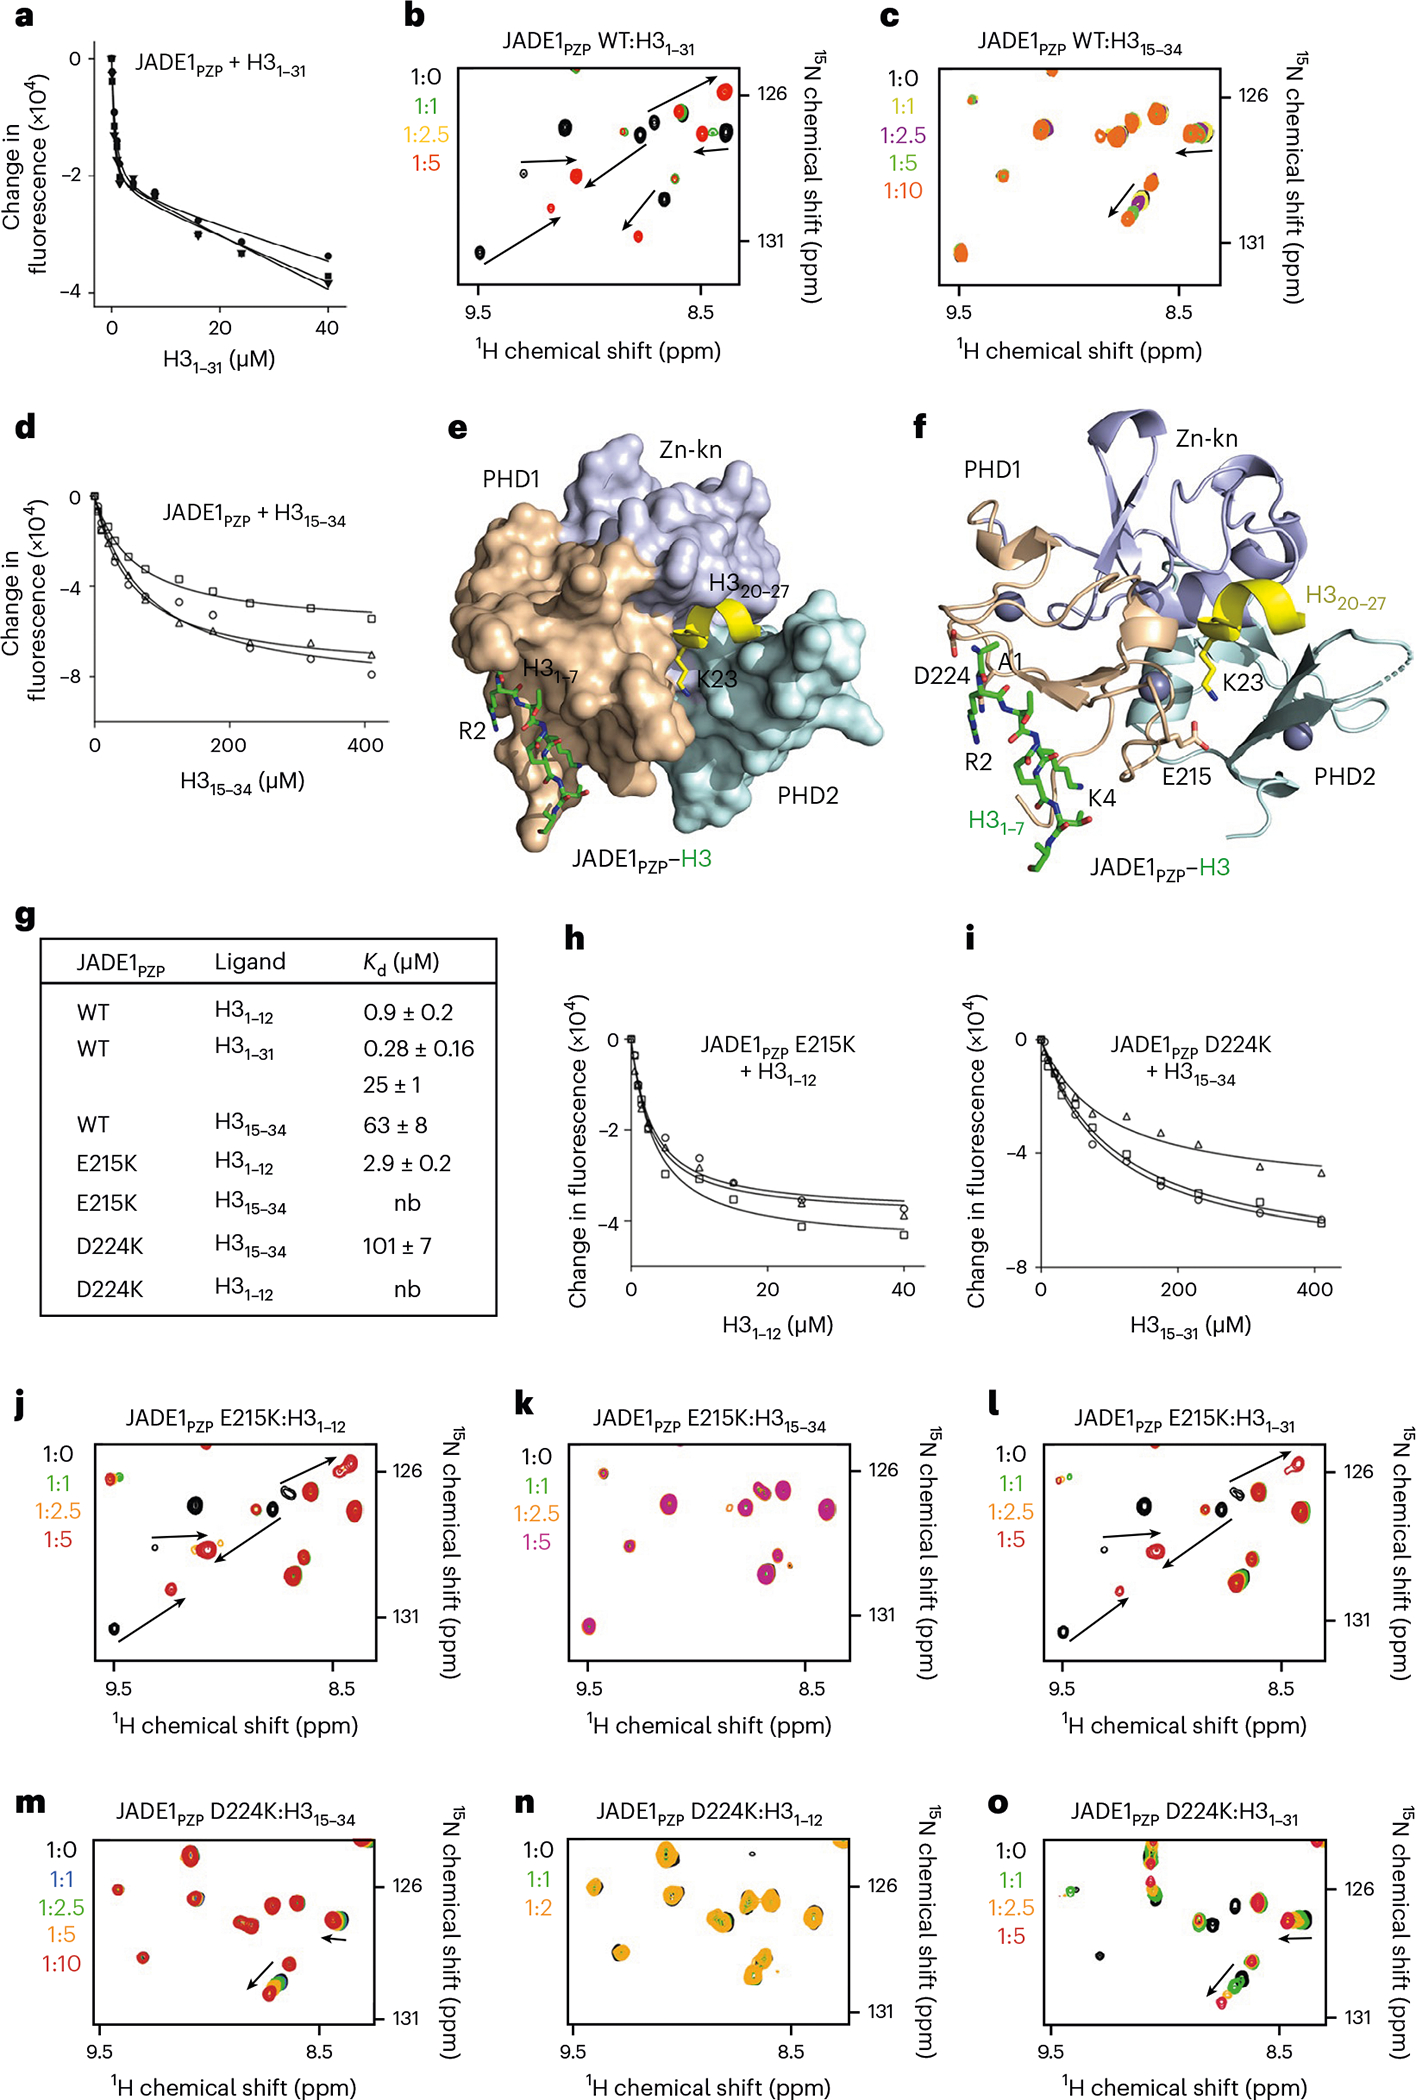
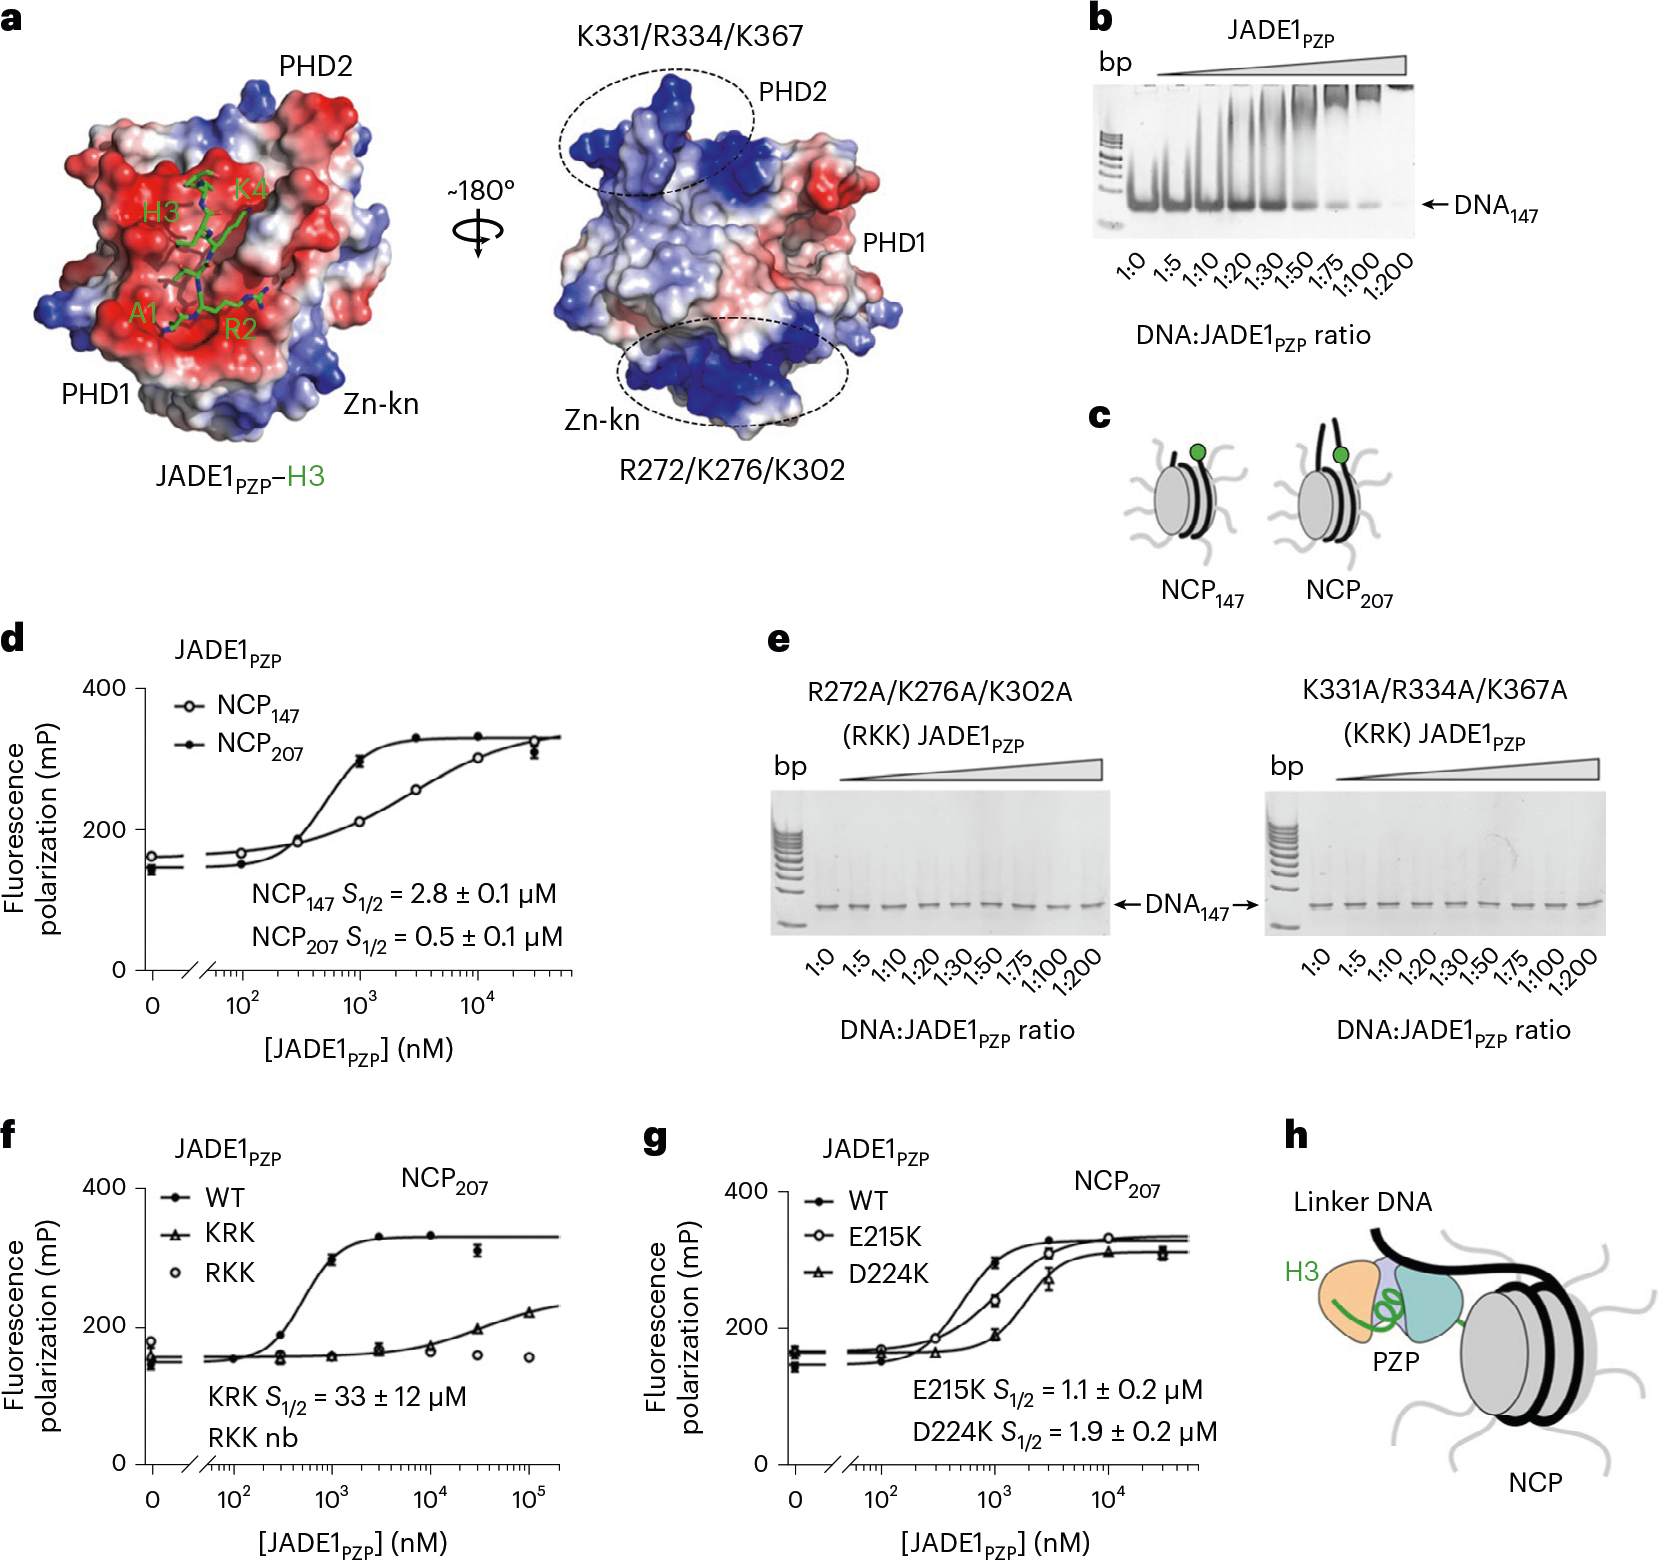
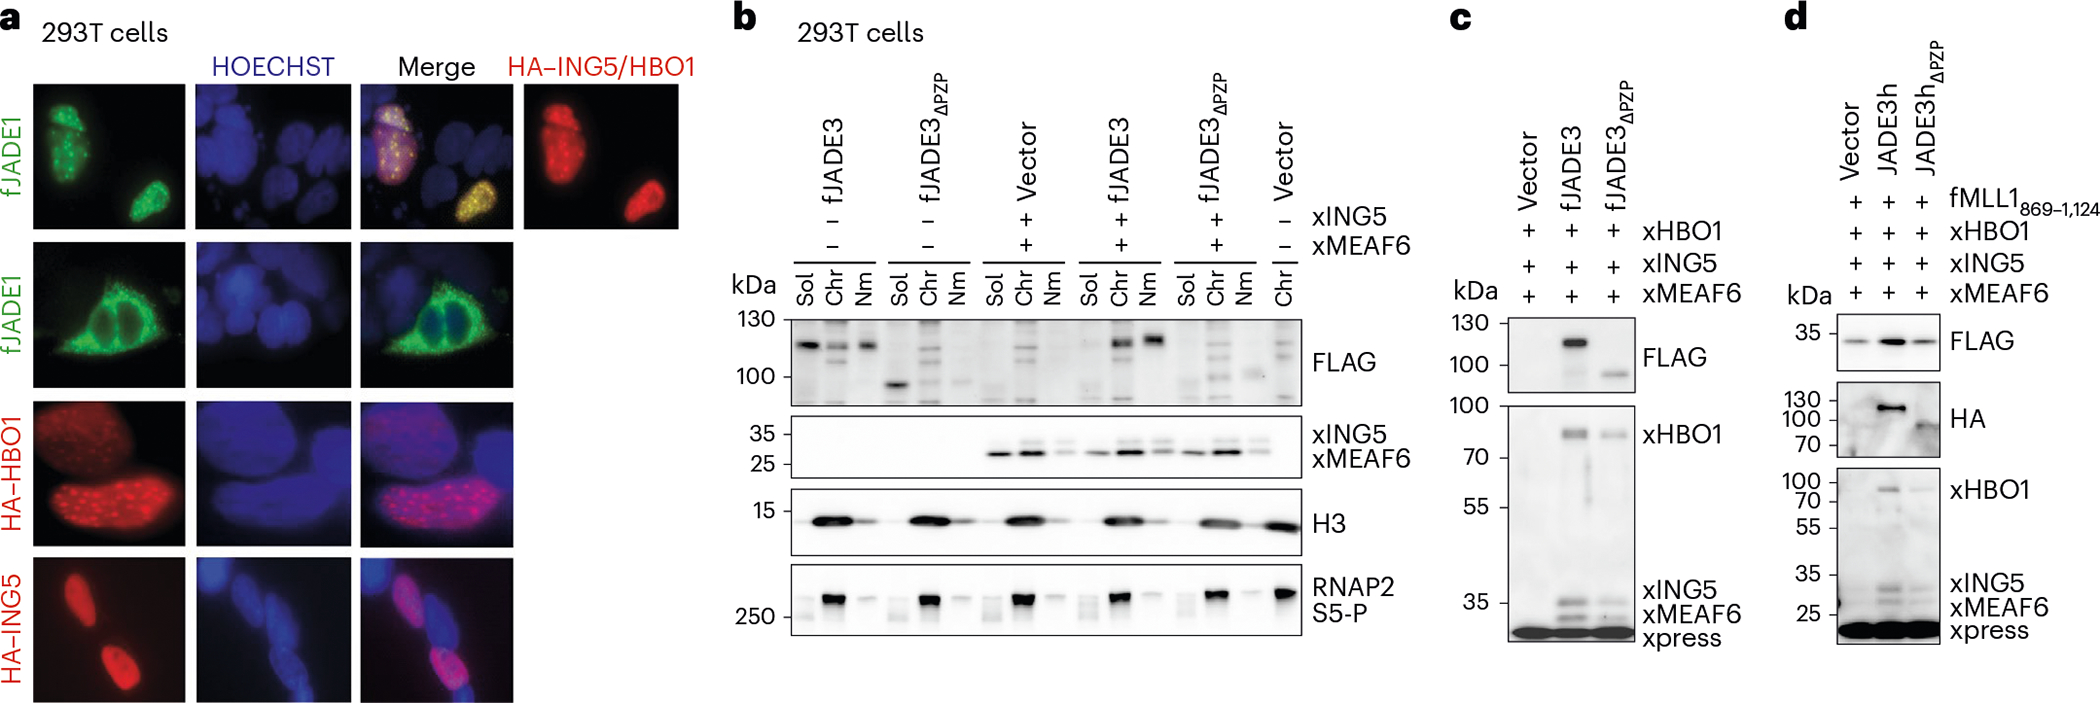
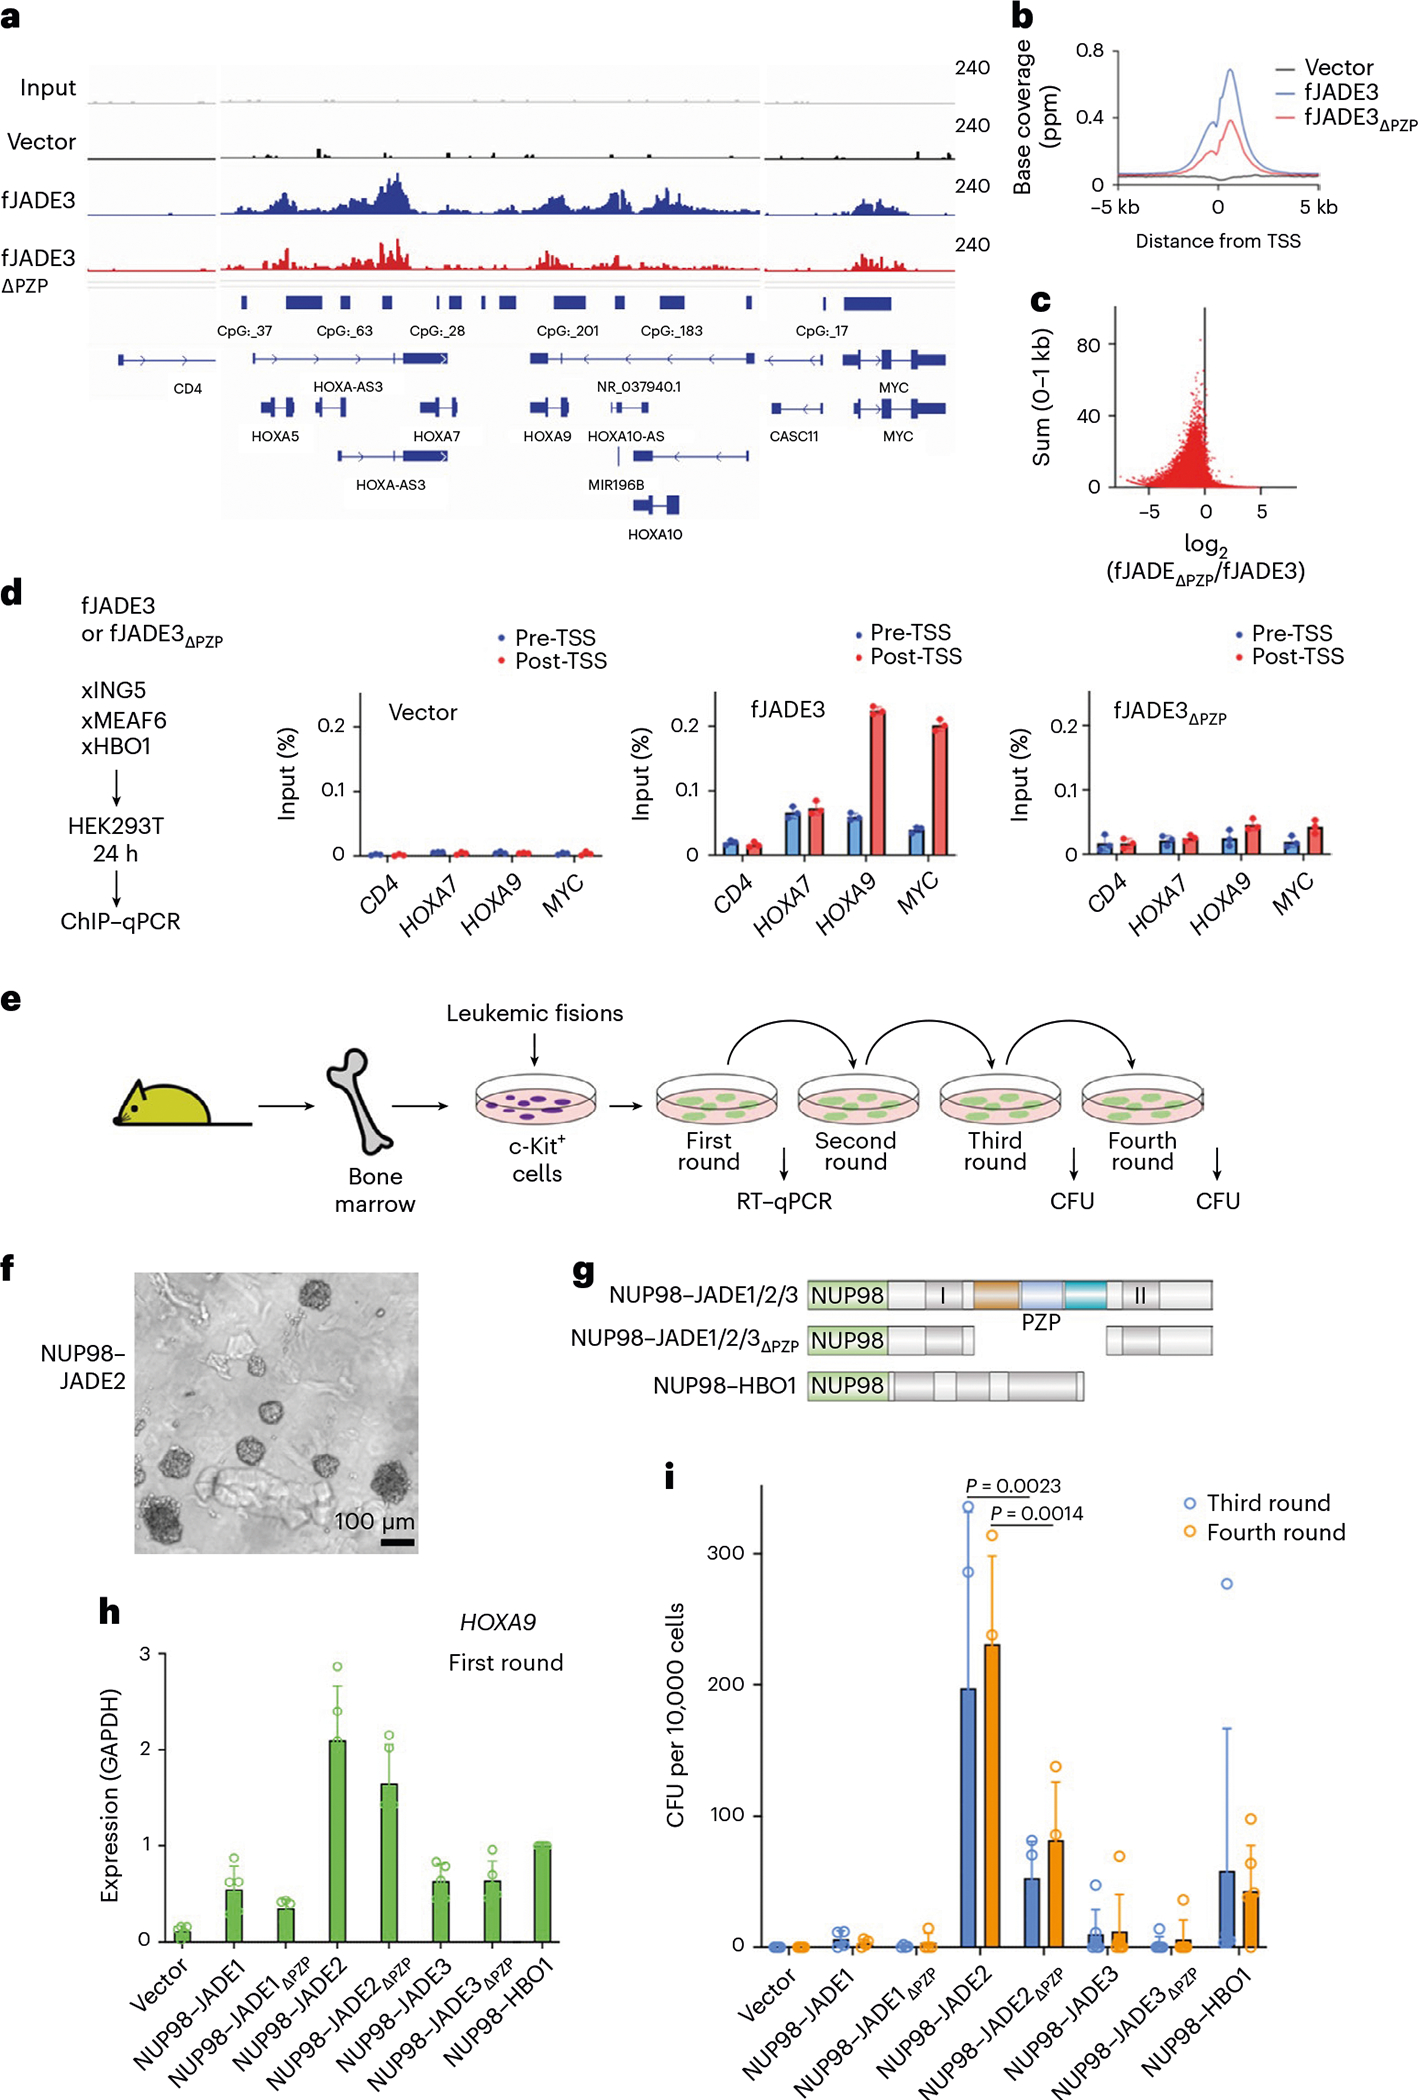
JADE is a core subunit of the HBO1 acetyltransferase complex that regulates developmental and epigenetic programs and promotes gene transcription. Here we describe the mechanism by which JADE facilitates recruitment of the HBO1 complex to chromatin and mediates its enzymatic activity. Structural, genomic and complex assembly in vivo studies show that the PZP (PHD1-zinc-knuckle-PHD2) domain of JADE engages the nucleosome through binding to histone H3 and DNA and is necessary for the association with chromatin targets. Recognition of unmethylated H3K4 by PZP directs enzymatic activity of the complex toward histone H4 acetylation, whereas H3K4 hypermethylation alters histone substrate selectivity. We demonstrate that PZP contributes to leukemogenesis, augmenting transforming activity of the NUP98-JADE2 fusion. Our findings highlight biological consequences and the impact of the intact JADE subunit on genomic recruitment, enzymatic function and pathological activity of the HBO1 complex.


Conflict of interest statement

Competing interests

The authors declare no competing interests.

Figures

Fig. 1 |
Fig. 1 |. All JADEs form HBO1 complexes.
a, Cartoon of HBO1 complex subunits. b, HEK293T cells transiently expressing FLAG-tagged JADE1, JADE2 or JADE3 and Xpress-tagged HBO1, ING5 and MEAF6 were subjected to fanChIP analysis using anti-FLAG antibody. Exogenously expressed proteins and endogenous MLL1 were detected by the antibodies indicated (see Supplementary Fig. 1 for further results). c, Heatmaps of ChIP signal intensities of indicated proteins at the transcription start site (TSS) are shown using ngsplot. d, ChIP signal distribution of endogenous JADE3, HBO1, ING4, MEAF6, MLL1 and RNA polymerase II with nonphosphorylated CTD (RNAP2 non-P) or Ser5-phosphorylated CTD (RNAP2 Ser5-P) within 5 kb of the TSS is shown using ngsplot. e, Representative image of ChIP–seq data at the HOXA locus visualized using Integrative Genomics Viewer (Broad Institute).
Fig. 2 |
Fig. 2 |. JADE1 recruits HBO1 to the nucleosome.
a, Schematic of HBO1 complex subunits with dot lines indicating contacts between subunits. The catalytic MYST domain and histone-binding zinc finger domains are labeled. The naturally occurring splice variant JADE1S is indicated by an arrow. b, JADE1 and JADE1S proteins were stably expressed as 3Flag-2Strep tagged versions from the AAVS1 safe harbor locus in K562 cells and purified from soluble nuclear extracts by tandem affinity chromatography. Silver-stained SDS–PAGE of biotin-eluted fractions is shown with associated protein bands labeled. c, Western blot of the purified JADE1- and JADE1S-containing HBO1 complexes with proteins detected by indicated antibodies. d, HAT assays using the purified HBO1 complexes from b and c with recombinant NCPs unmodified, carrying one (asymmetric) or two (symmetric) H3K4me3 tails (red dots). e, Cartoon summarizing results in d. Kac, acetylated lysine. f, Overlay of 1H,15N HSQC spectra of JADE1PZP in the presence of increasing amounts of H31–12 peptide. Spectra are colored according to the protein:peptide molar ratio. g, Binding curves used to determine Kd by tryptophan fluorescence. Kd is represented as average ± s.d. from three independent experiments (n = 3). h, Overlay of 1H,15N HSQC spectra of JADE1PZP in the presence of increasing amounts of H3K4me31–12 peptide. Spectra are colored according to the protein:peptide molar ratio. i, Binding curves used to determine Kd by NMR. Kd values are represented as average ± s.d. from four signals. j,k, Models of the chromatin association mechanism and function of the JADE1–HBO1 complexes.
Fig. 3 |
Fig. 3 |. Structural basis for the recognition of histone H3 by JADE1PZP.
a, Crystal structure of JADE1PZP in complex with H3 tail is shown as a ribbon diagram with PHD1, Zn-kn and PHD2 colored wheat, light blue and cyan, respectively. The A1–A7 region of H3 is shown as green sticks, and the R8–G12 region of H3 is omitted for clarity. Yellow dashed lines and gray spheres indicate hydrogen bonds and zinc ions, respectively. For comparative analysis of PHD and PZP, see refs. ,. b, Close-up view of the histone H3-binding site of JADE1PZP. c, Overlay of the crystal structures of the H3–JADE1PZP complex (colored as in a) and the apo state of JADE1PZP (gray).
Fig. 4 |
Fig. 4 |. JADE1PZP associates with two regions of the H3 tail.
a, Binding affinity of JADE1PZP for the H31–31 peptide as measured by tryptophan fluorescence. Kd is represented as average ± s.d. from three independent experiments (n = 3). b,c, Superimposed 1H,15N HSQC spectra of JADE1PZP collected in the presence of increasing amounts of the indicated H3 peptides. Spectra are color coded according to the protein:peptide molar ratio. d, Binding affinity of JADE1PZP for the H315–34 peptide as measured by tryptophan fluorescence. Kd is represented as average ± s.d. from three independent experiments (n = 3). e,f, Overlay of the structures of the H31–7–JADE1PZP, colored as in Fig. 3, and AF10PZP–H321–27 (PDB 5DAH) complexes, depicted as surface (e) or ribbon (f) with AF10PZP not shown for clarity. The histone regions H31–7 and H321–27 are green and yellow, respectively. The D224 and E215 residues mutated in this study are labeled. g, Binding affinities of JADE1PZP for the indicated histone peptides as measured by tryptophan fluorescence. Kd values are represented as average ± s.d. from three independent experiments (n = 3). nb, no binding. h,i, Binding curves used to determine Kd values in g. jo, Superimposed 1H,15N HSQC spectra of the JADE1PZP mutants collected upon titration with indicated H3 peptides. Spectra are color coded according to the protein:peptide molar ratio.
Fig. 5 |
Fig. 5 |. JADE1PZP binds to nucleosomes in a bivalent manner.
a, Electrostatic surface potential of H3–JADE1PZP with blue and red colors representing positive and negative charges, respectively. The H3 tail is shown as green sticks. Two positively charged regions of JADE1PZP are indicated by dotted ovals, with lysine and arginine residues labeled. b, EMSA of 147 bp 601 DNA in the presence of increasing amounts of JADE1PZP. DNA:protein ratio is shown below the gel image. c, Cartoon of fluorescein-labeled NCPs. d, Binding curves obtained for the interaction of JADE1PZP with indicated NCPs in fluorescence anisotropy assays. Data represent mean ± s.d. of three independent experiments (n = 3). e, EMSA of DNA147 in the presence of increasing amounts of the JADE1PZP mutants. DNA:protein ratio is shown below the gel image. f,g, Binding curves obtained for the interaction of the indicated WT and mutated JADE1PZP with NCP207 in fluorescence anisotropy assays. Data represent mean ± s.d. of three independent experiments (n = 3). h, A model of the bivalent interaction of JADE1PZP with histone H3 (green) of the nucleosome and the linker DNA. PHD1, Zn-kn and PHD2 are colored as in Fig. 3.
Fig. 6 |
Fig. 6 |. JADE1PZP facilitates HBO1 complex association with chromatin in vivo.
a, HEK293T cells transiently transfected with indicated HBO1 components were analyzed by IF. Magnification used in the images is ×60 except for HBO1, which is ×100. b, HEK293T cells transiently expressing the indicated transgene products were fractionated into three fractions: soluble (Sol), chromatin (Chr) and nuclear matrix (Nm). Proteins in subfractions were visualized using the antibodies indicated. c, HEK293T cells transiently expressing FLAG-tagged JADE3 proteins and Xpress-tagged HBO1, ING5 and MEAF6 were subjected to fanChIP analysis using anti-FLAG antibody. The coprecipitates were visualized using the antibodies indicated. d, HEK293T cells transiently expressing FLAG-tagged MLL1 fragment (amino acids 869–1,124), HA-tagged JADE3 proteins and Xpress-tagged HBO1, ING5 and MEAF6 were subjected to fanChIP analysis using anti-FLAG antibody. The coprecipitates were visualized using the antibodies indicated. See also Supplementary Fig. 5.
Fig. 7 |
Fig. 7 |. JADE1PZP enhances the transforming activity of NUP98–JADE2 in vivo.
a, Representative image of the ChIP–seq data of JADE3 and its PZP-deletion mutant at the HOXA locus. FLAG-tagged JADE3 proteins were coexpressed with Xpress-tagged HBO1, ING5 and MEAF6 in HEK293T cells and subjected to fanChIP using anti-FLAG antibody. ChIP–seq data were visualized by Integrative Genomics Viewer (Broad Institute). b, Average distribution of JADE3 proteins near TSSs. ChIP signal distribution of FLAG-tagged JADE3 proteins within a 5 kb range of the TSS is shown using ngsplot. c, ChIP–seq tags of FLAG-tagged JADE3 proteins at all genes were clustered into a 1-kb bin (0 to +1 kb from the TSS), and the sum of the WT JADE3 ChIP signals and the ChIP signals of the JADE3 PZP-deletion mutant relative to the WT JADE3 are plotted on the y and x axes, respectively. d, Localization of FLAG-tagged JADE3 proteins 24 h after gene transduction. ChIP–qPCR of the chromatin samples, prepared as in a, was performed on two technical replicates of each genotype for the indicated gene loci using qPCR probes designed for the pre-TSS (−1 to −0.5 kb from TSS) and post-TSS (+1 to +1.5 kb from TSS) regions of each gene. ChIP signals are expressed as a percentage of the input with error bars (mean ± s.d. of three technical replicates). e, Diagram of myeloid progenitor transformation assays for NUP98–JADE fusions. CFU, colony-forming units. f, Representative image of the colonies. g, Schematic of the NUP98 fusion gene constructs. h, Hoxa9 expression in the first-round colonies. Hoxa9 expression normalized to Gapdh in first-round colonies is shown as the relative value of NUP98–HBO1 (arbitrarily set at 1) (mean ± s.d. of five biological replicates, n = 5). i, Leukemic transformation of hematopoietic progenitors by NUP98–JADE fusions. Colony-forming ability at the third- and fourth-round passages is shown with error bars (mean ± s.d. of five biological replicates, n > 4). Statistical analysis was performed using ordinary two-way ANOVA (two-sided, multiple comparison).

Similar articles

Cited by

References

    1. Grunstein M Histone acetylation in chromatin structure and transcription. Nature 389, 349–352 (1997). - PubMed
    1. Schubeler D et al. Nuclear localization and histone acetylation: a pathway for chromatin opening and transcriptional activation of the human beta-globin locus. Genes Dev 14, 940–950 (2000). - PMC - PubMed
    1. Kuo MH & Allis CD Roles of histone acetyltransferases and deacetylases in gene regulation. Bioessays 20, 615–626 (1998). - PubMed
    1. Mizzen CA & Allis CD Linking histone acetylation to transcriptional regulation. Cell. Mol. Life Sci. 54, 6–20 (1998). - PMC - PubMed
    1. MacPherson L et al. HBO1 is required for the maintenance of leukaemia stem cells. Nature 577, 266–270 (2020). - PubMed

LinkOut - more resources