. 2024 Mar;627(8003):399-406.
doi: 10.1038/s41586-024-07134-4. Epub 2024 Mar 6.

Universal recording of immune cell interactions in vivo

Affiliations

Universal recording of immune cell interactions in vivo

Sandra Nakandakari-Higa et al. Nature. 2024 Mar.

Abstract

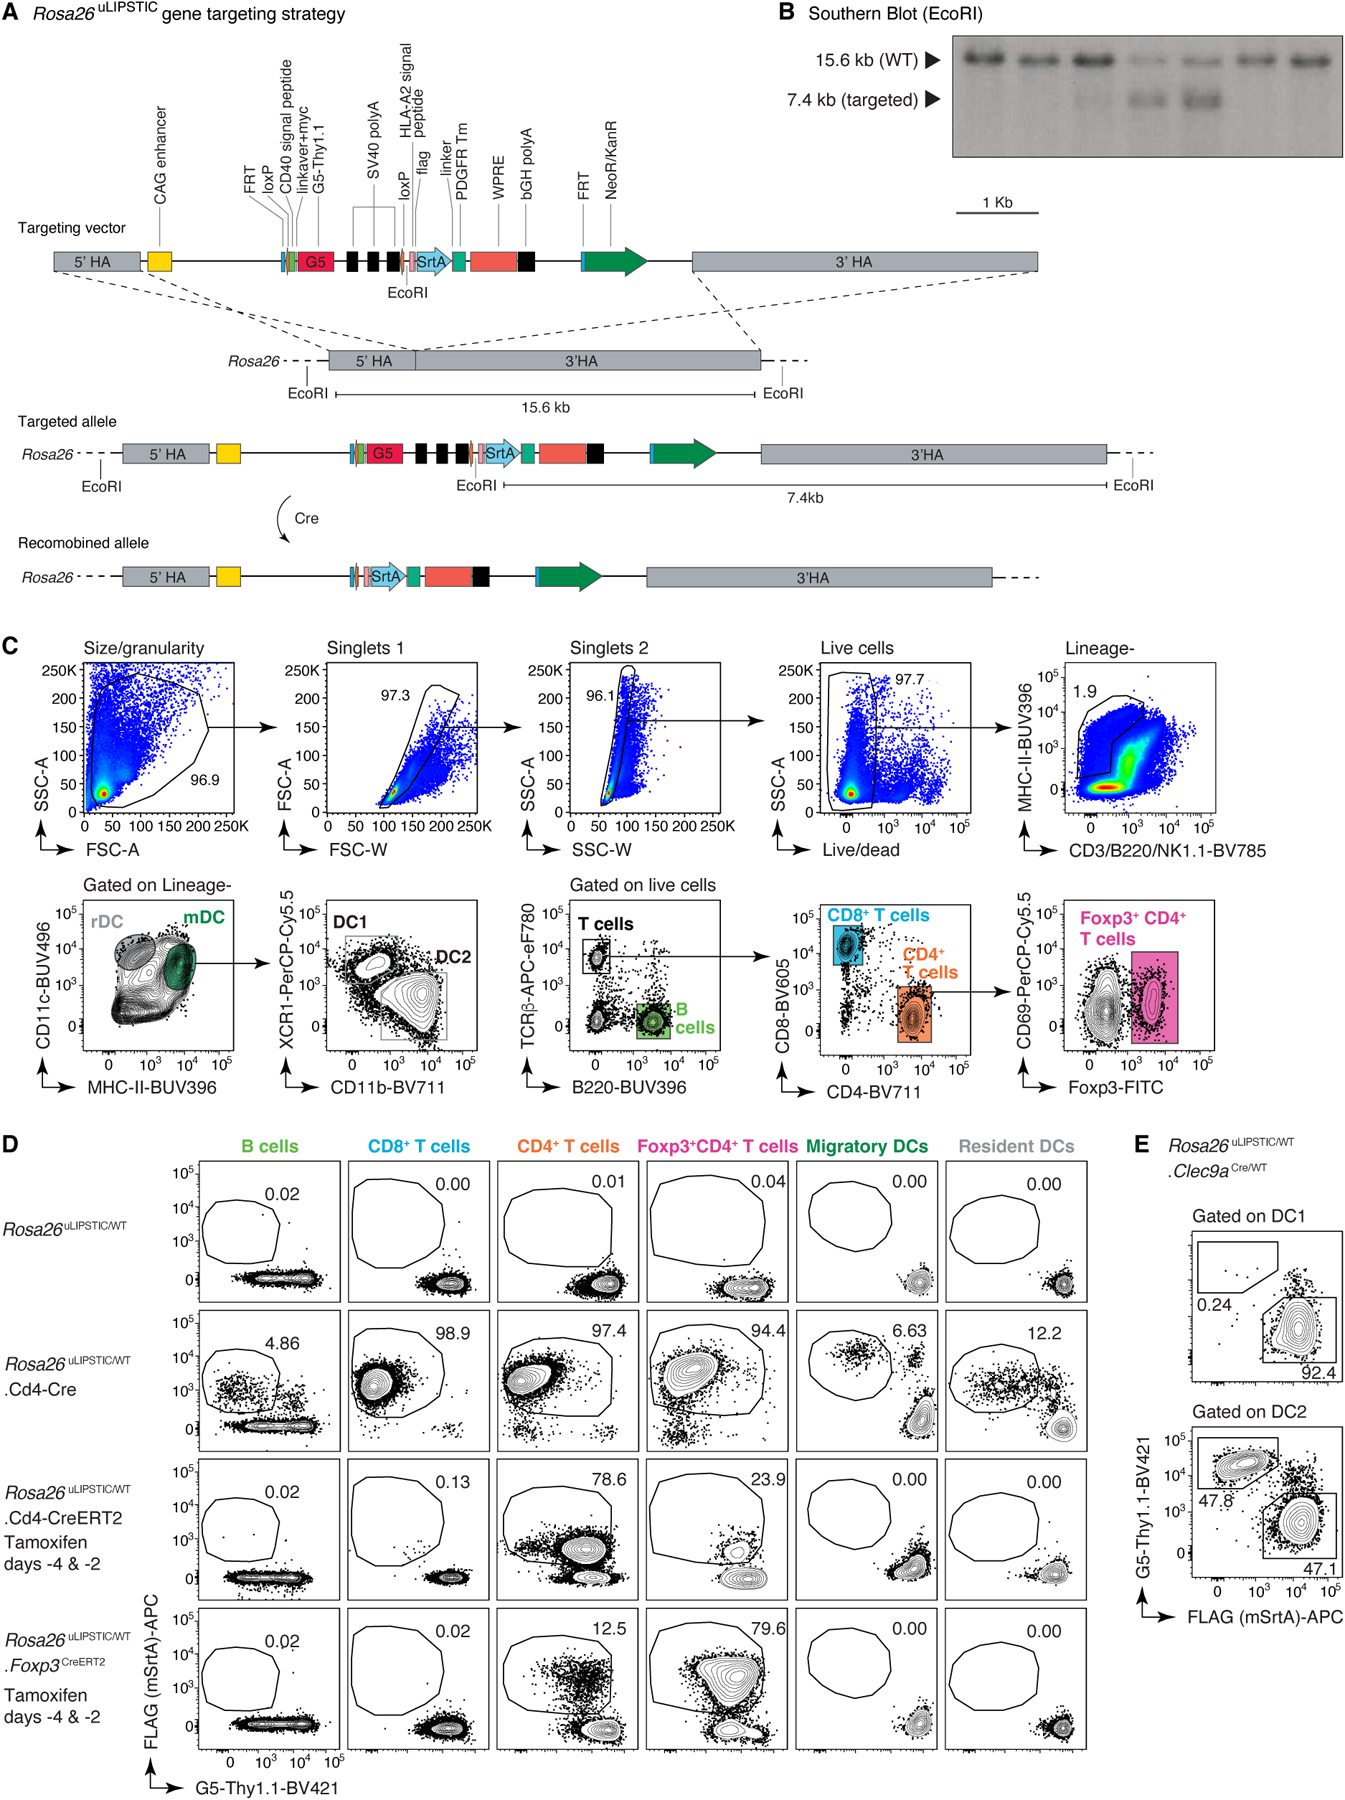
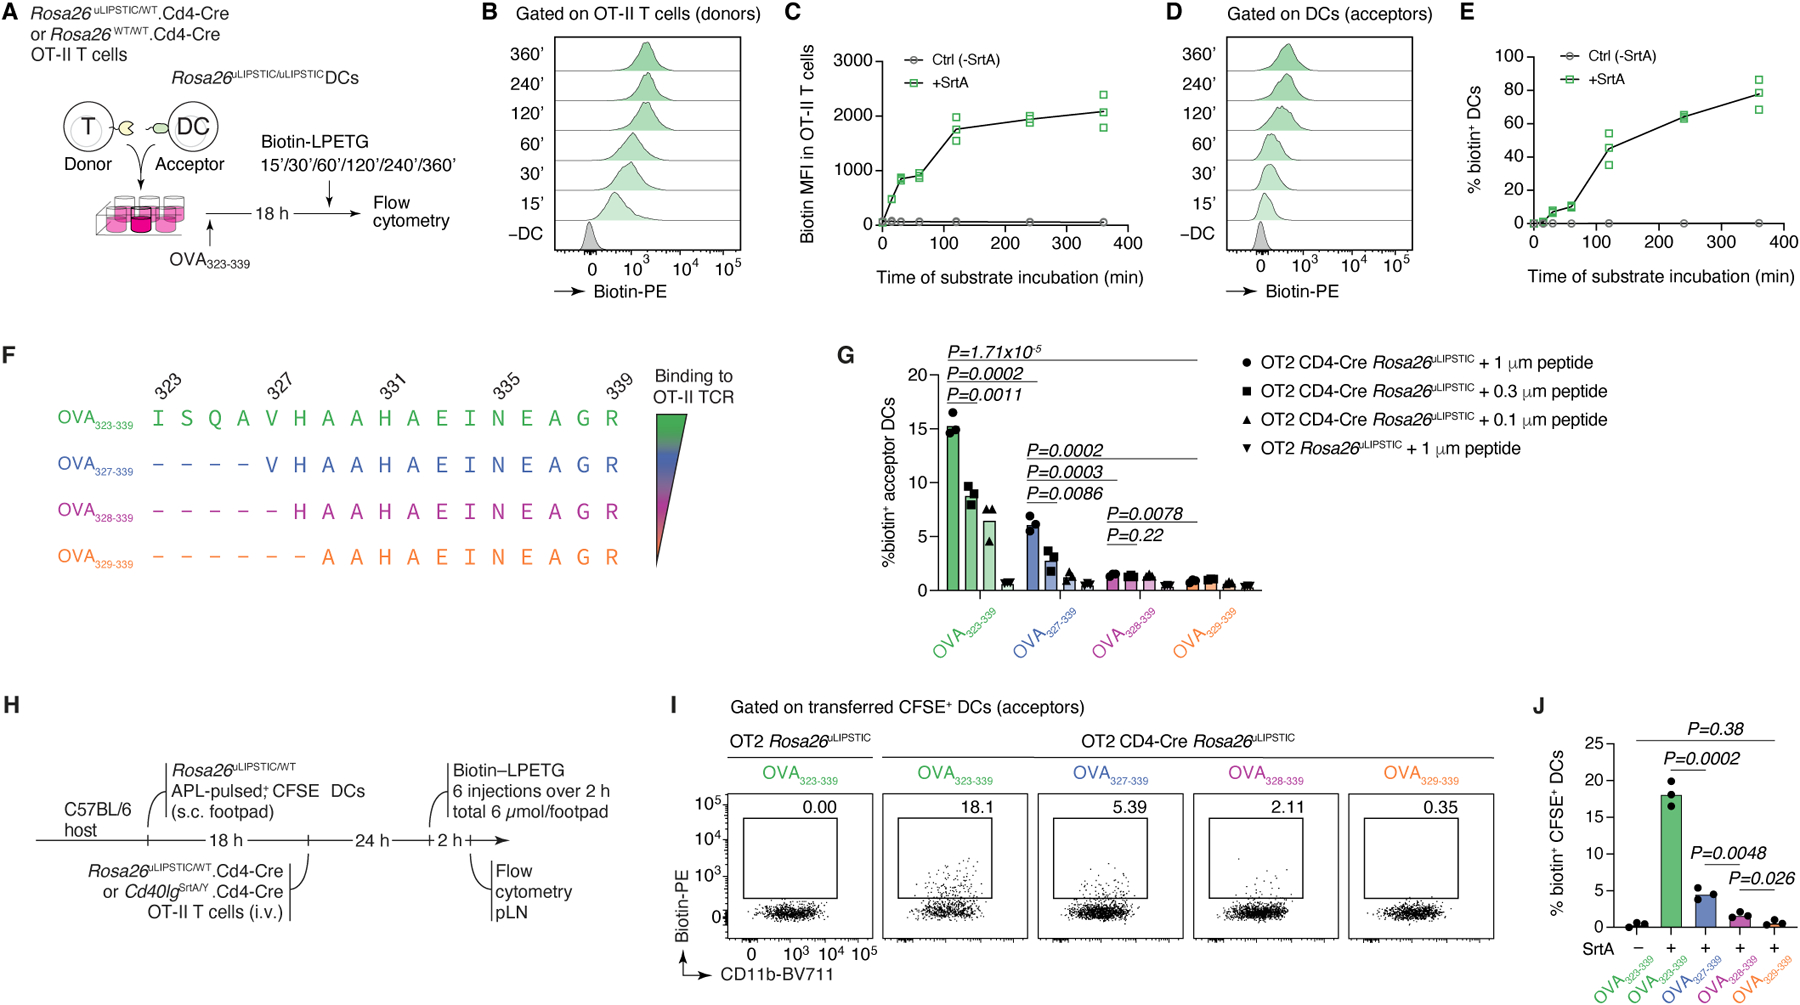
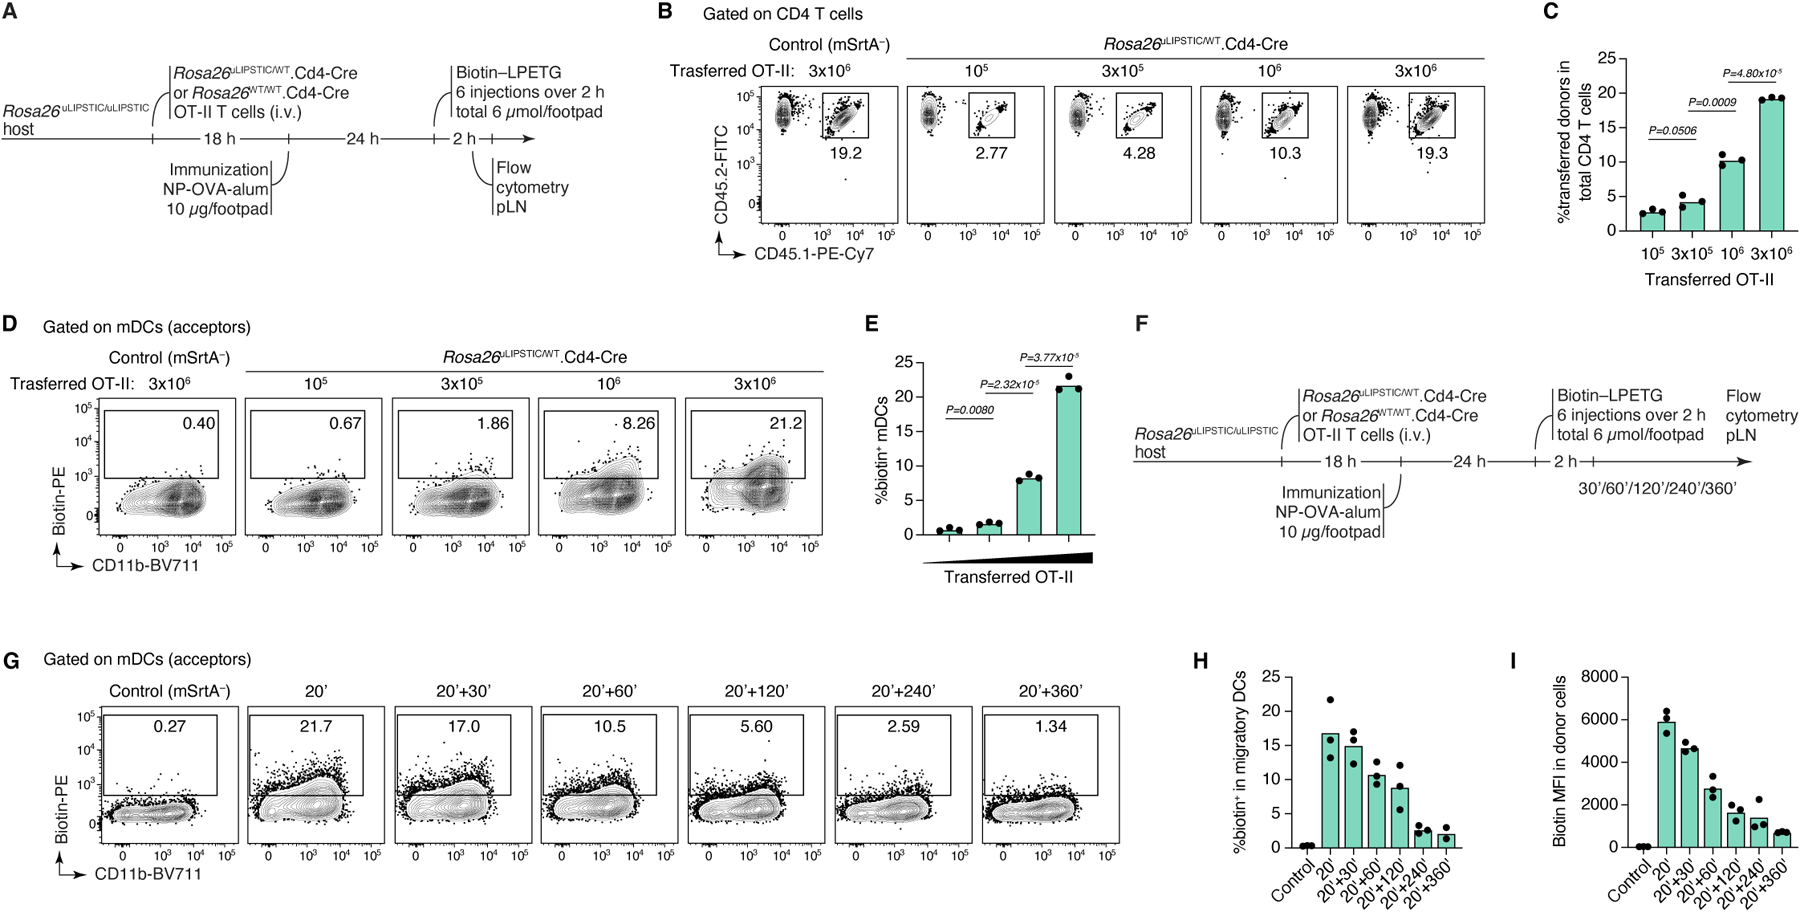
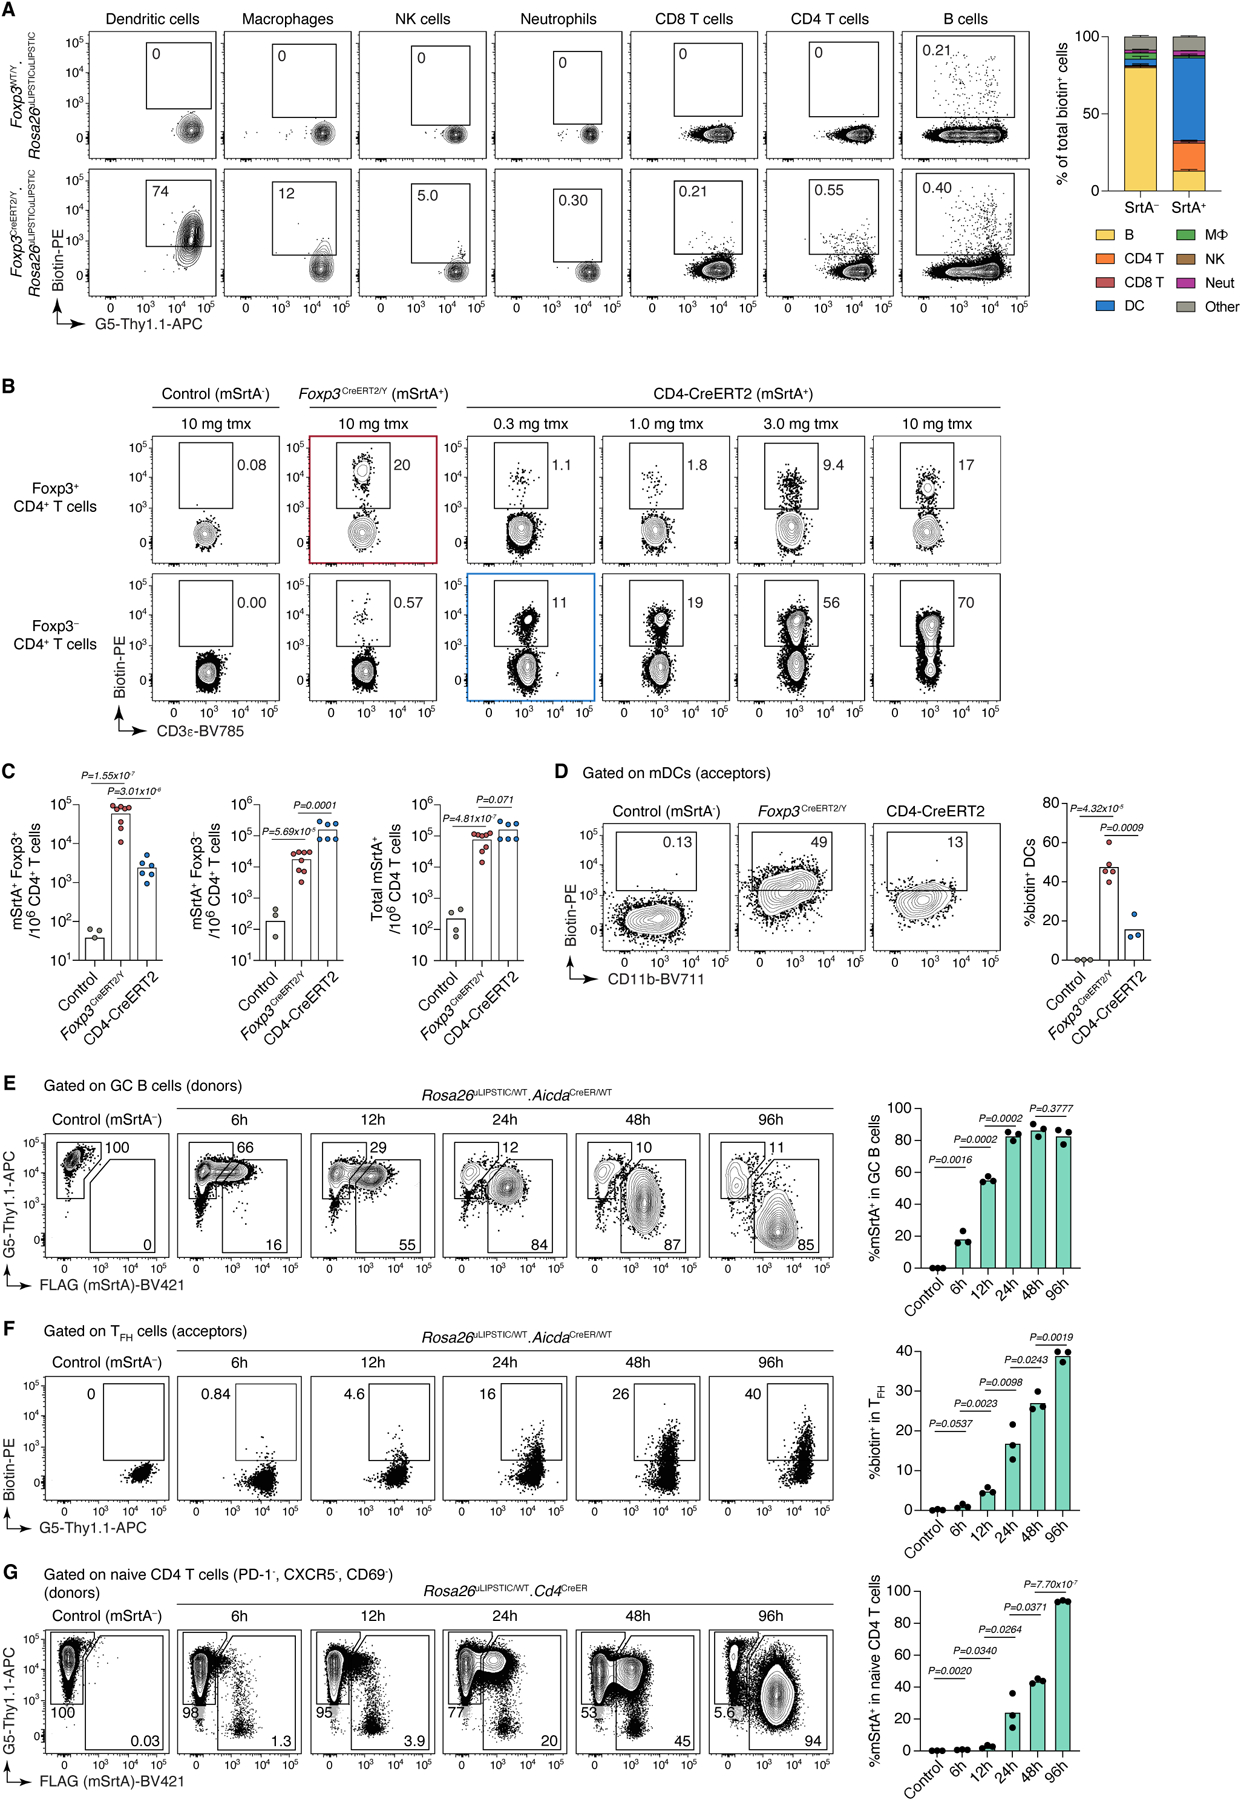
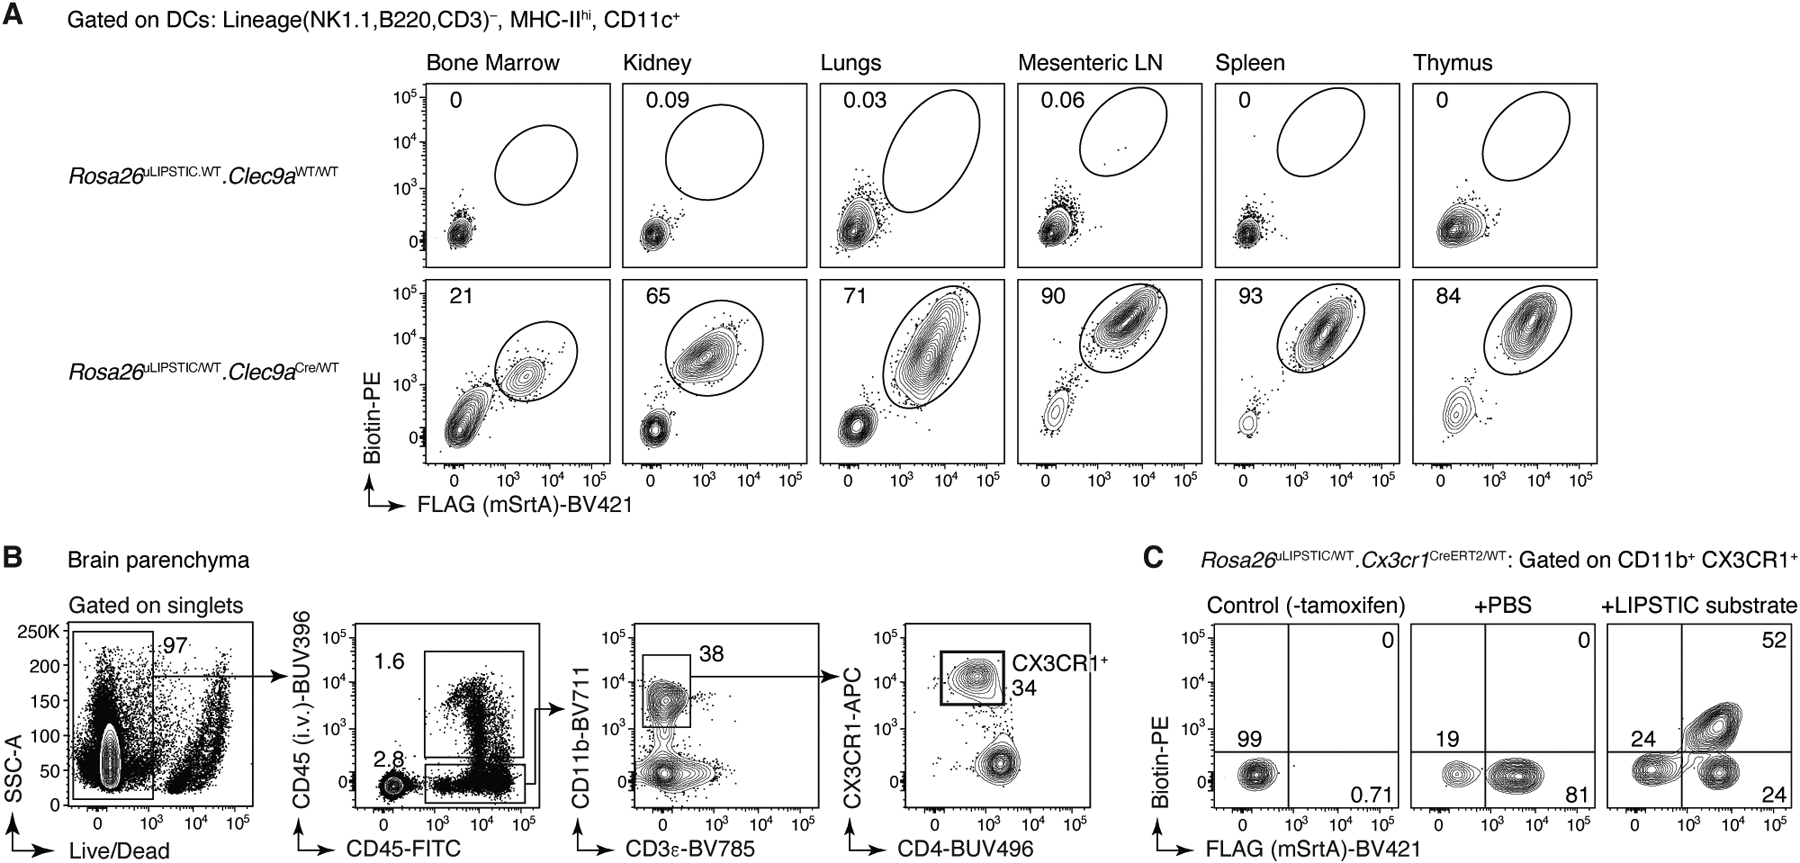
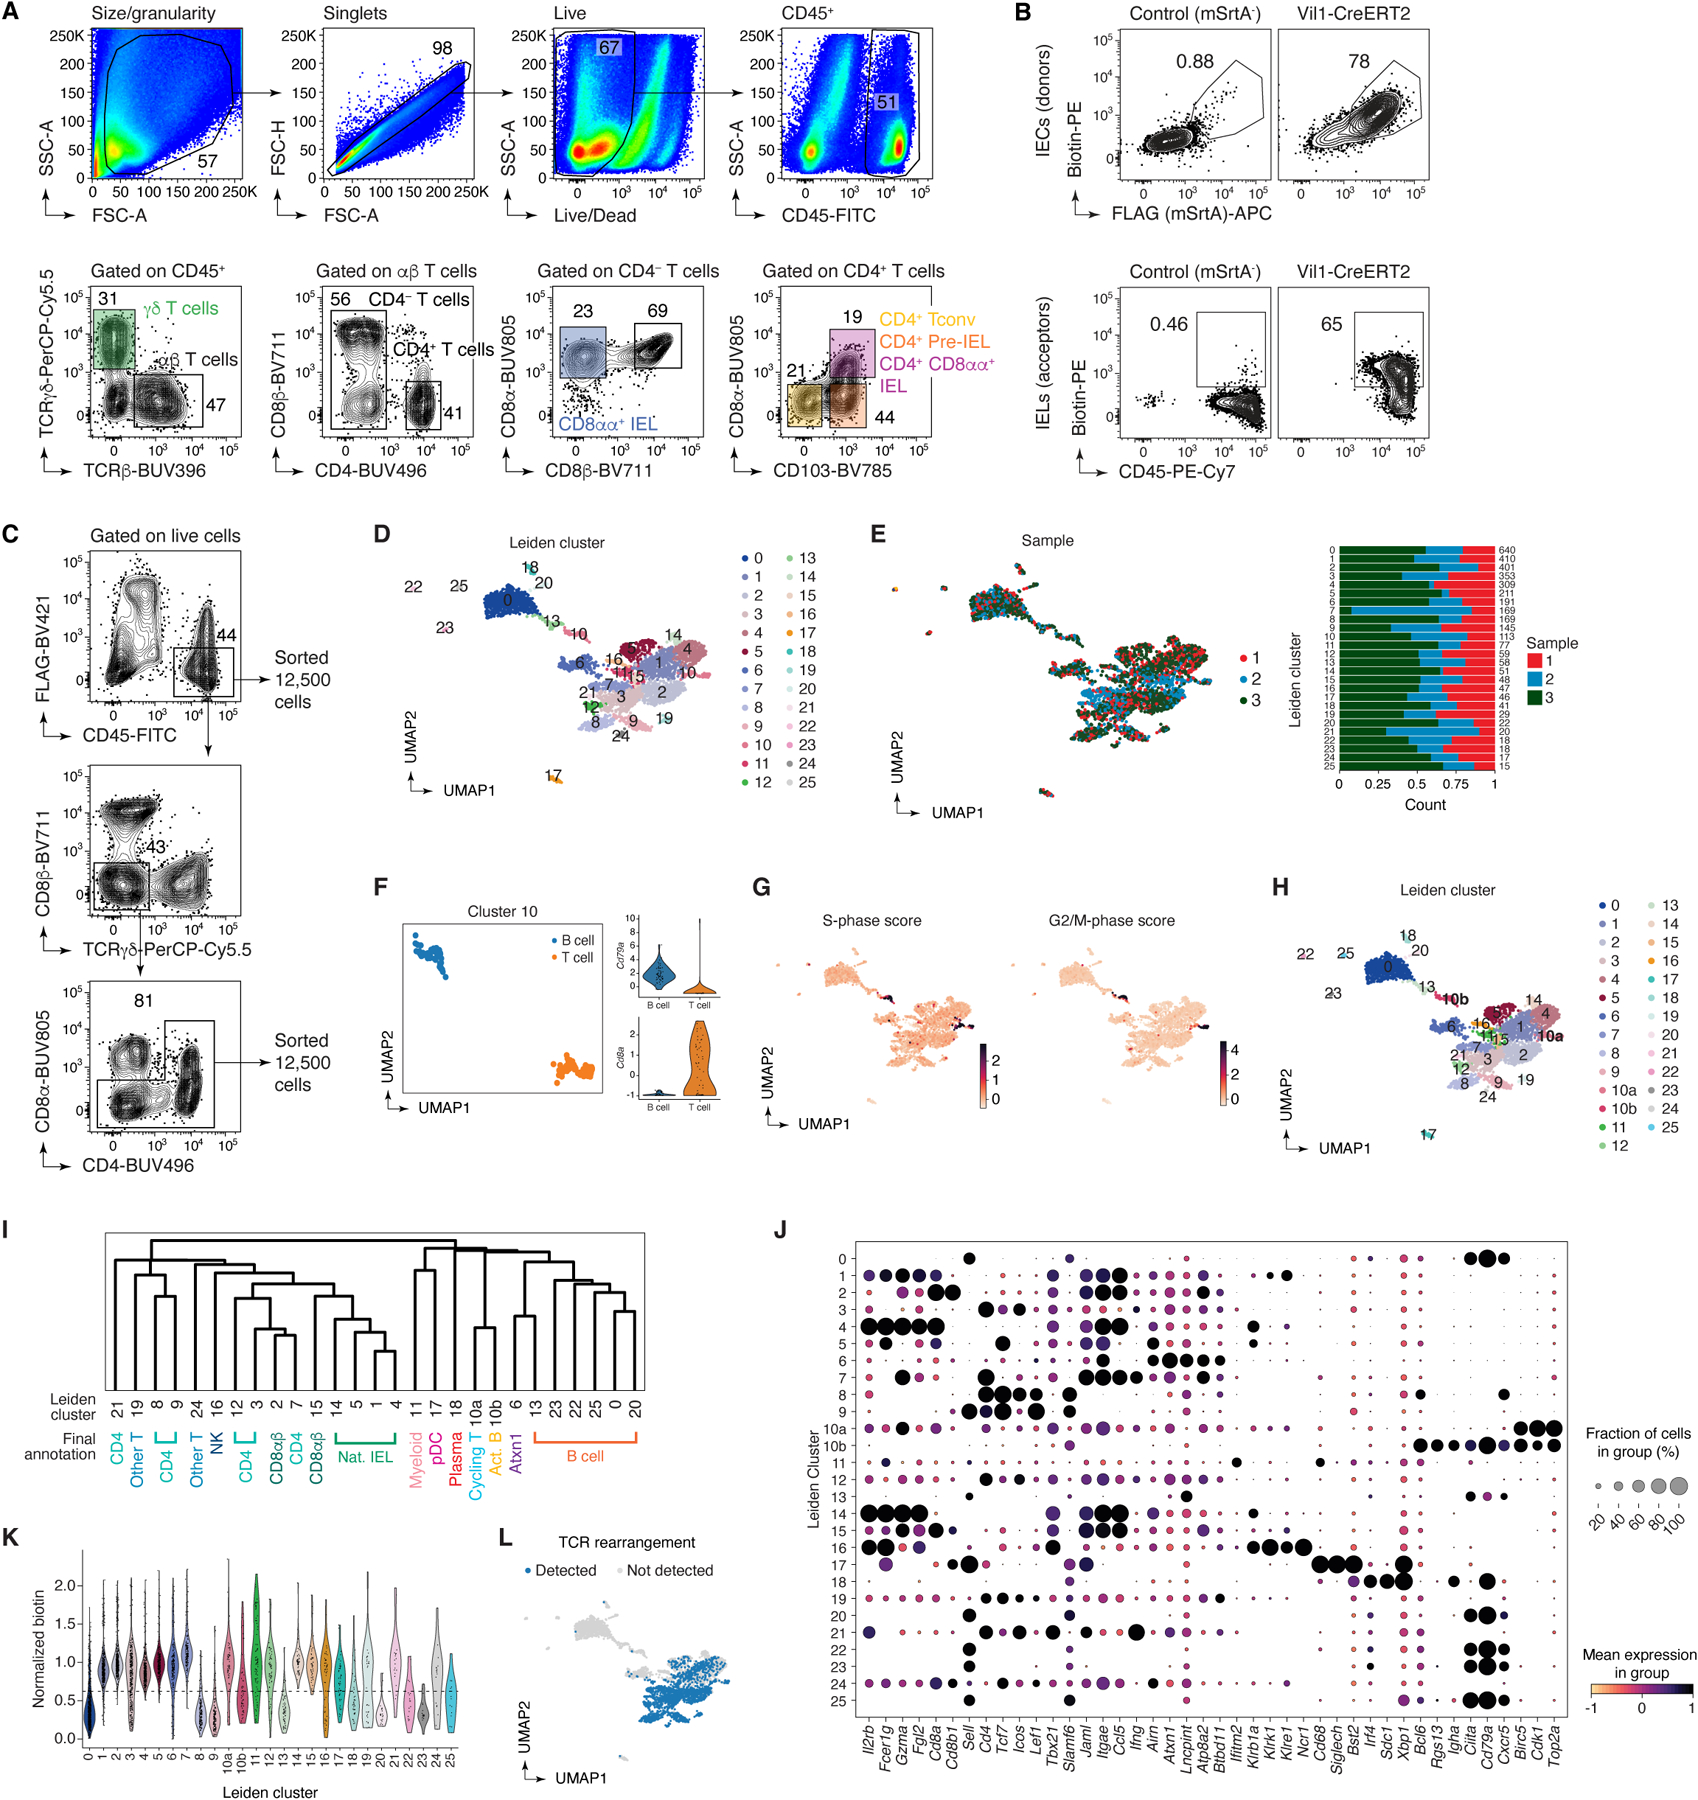
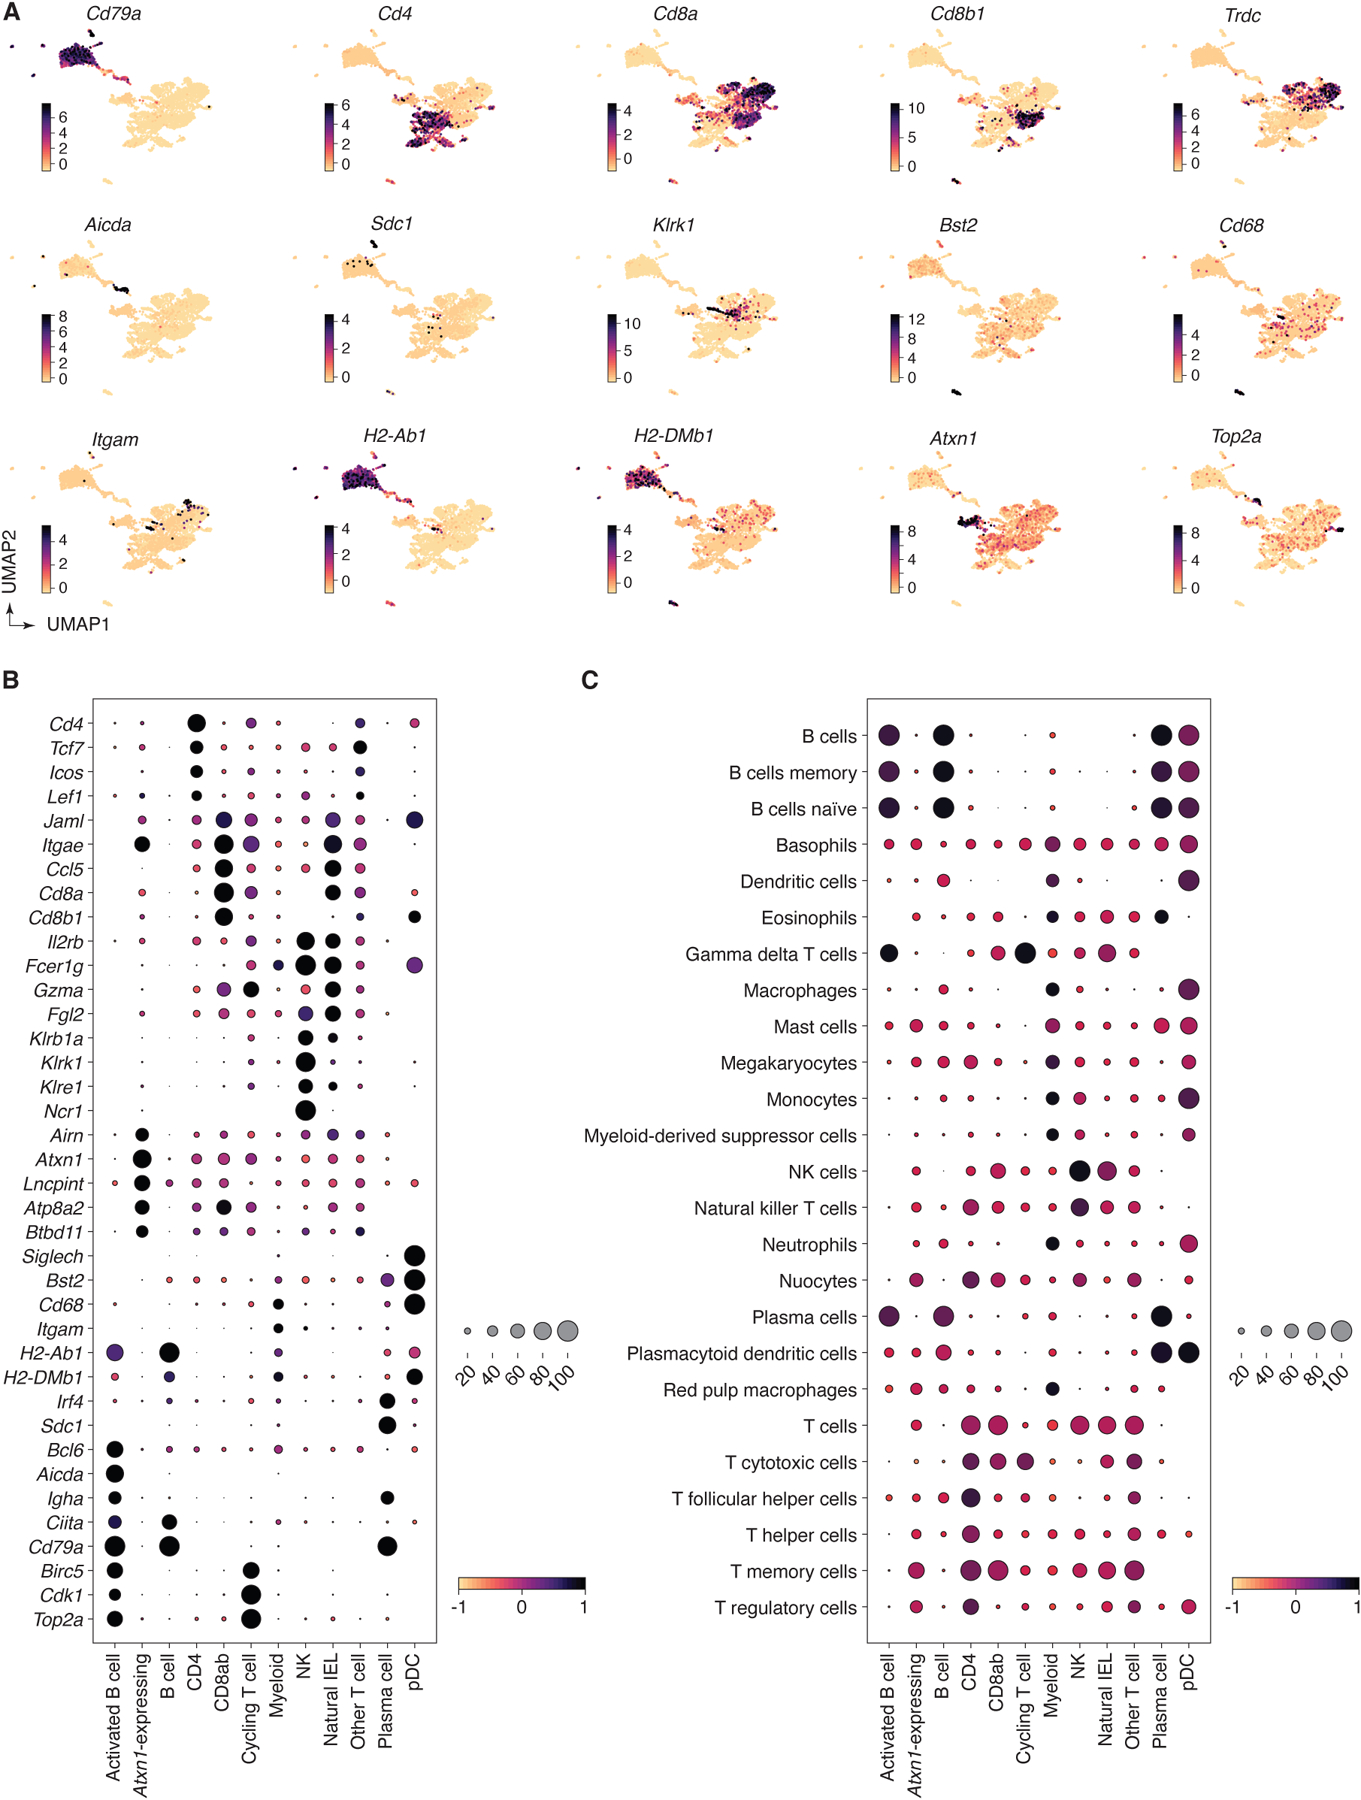
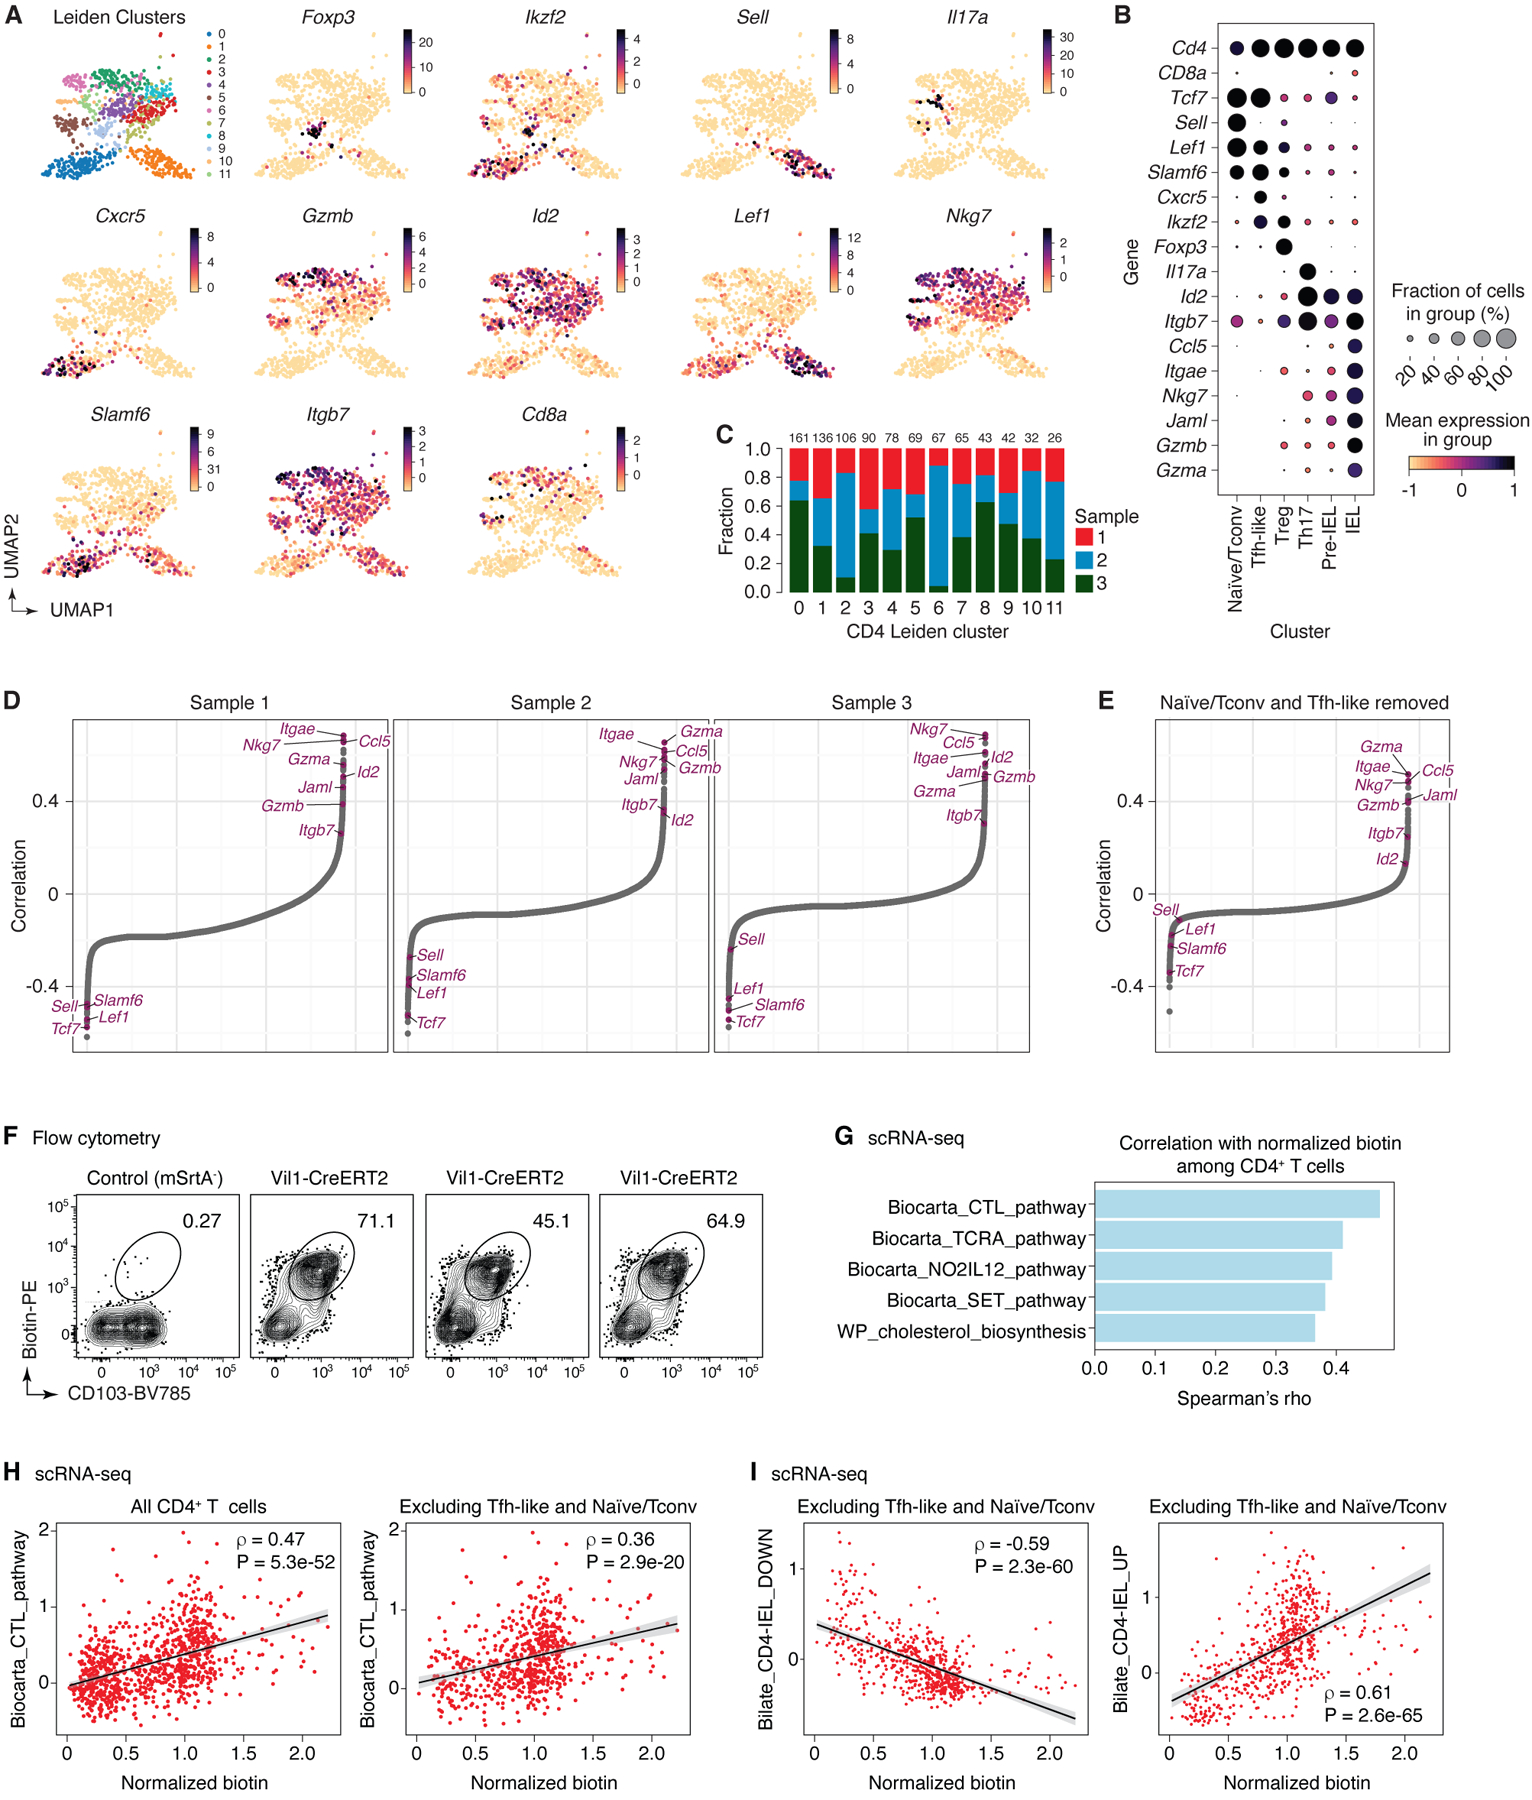
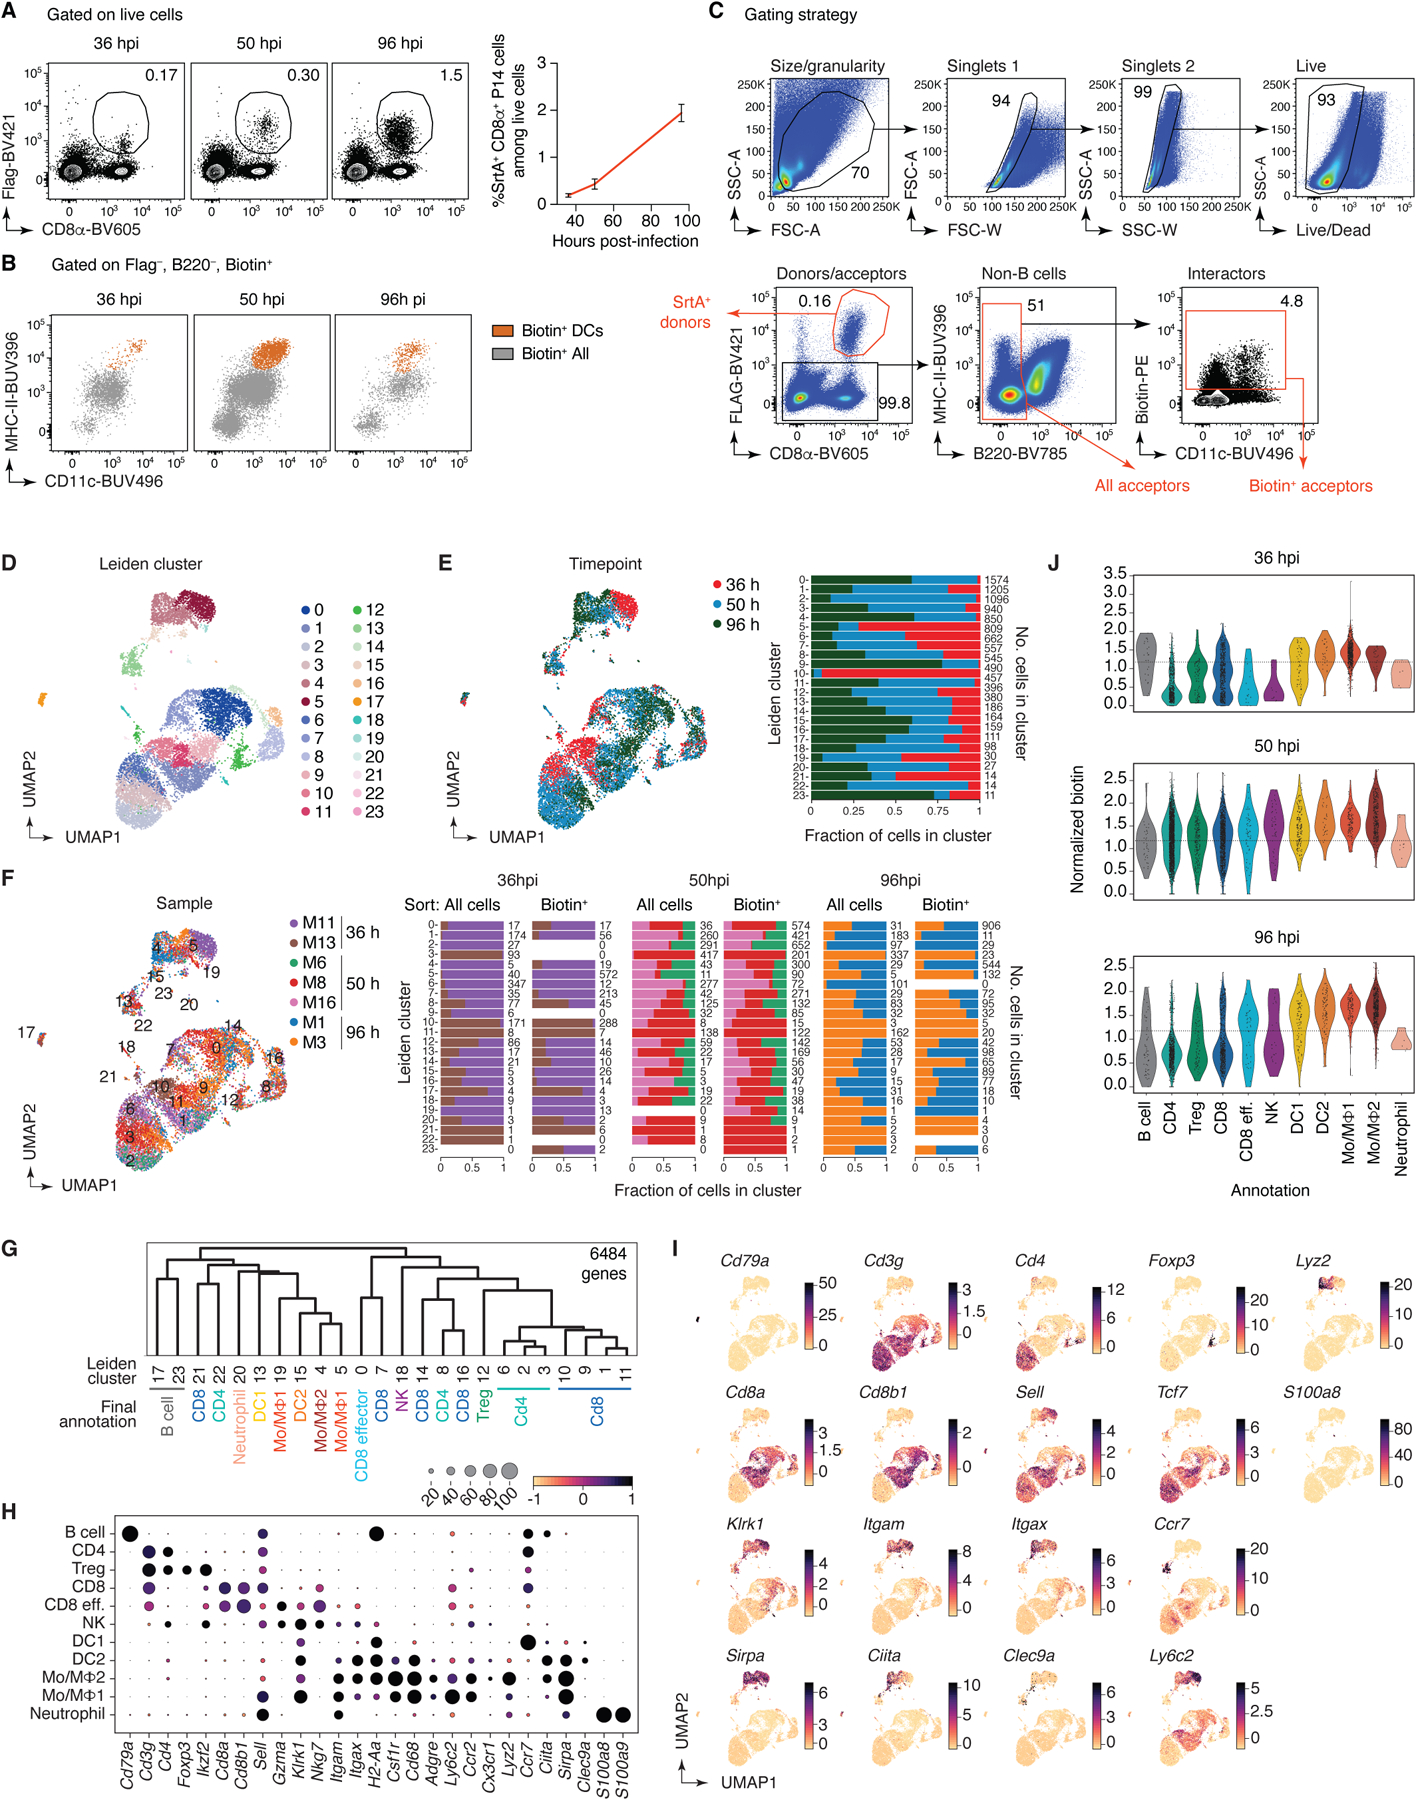
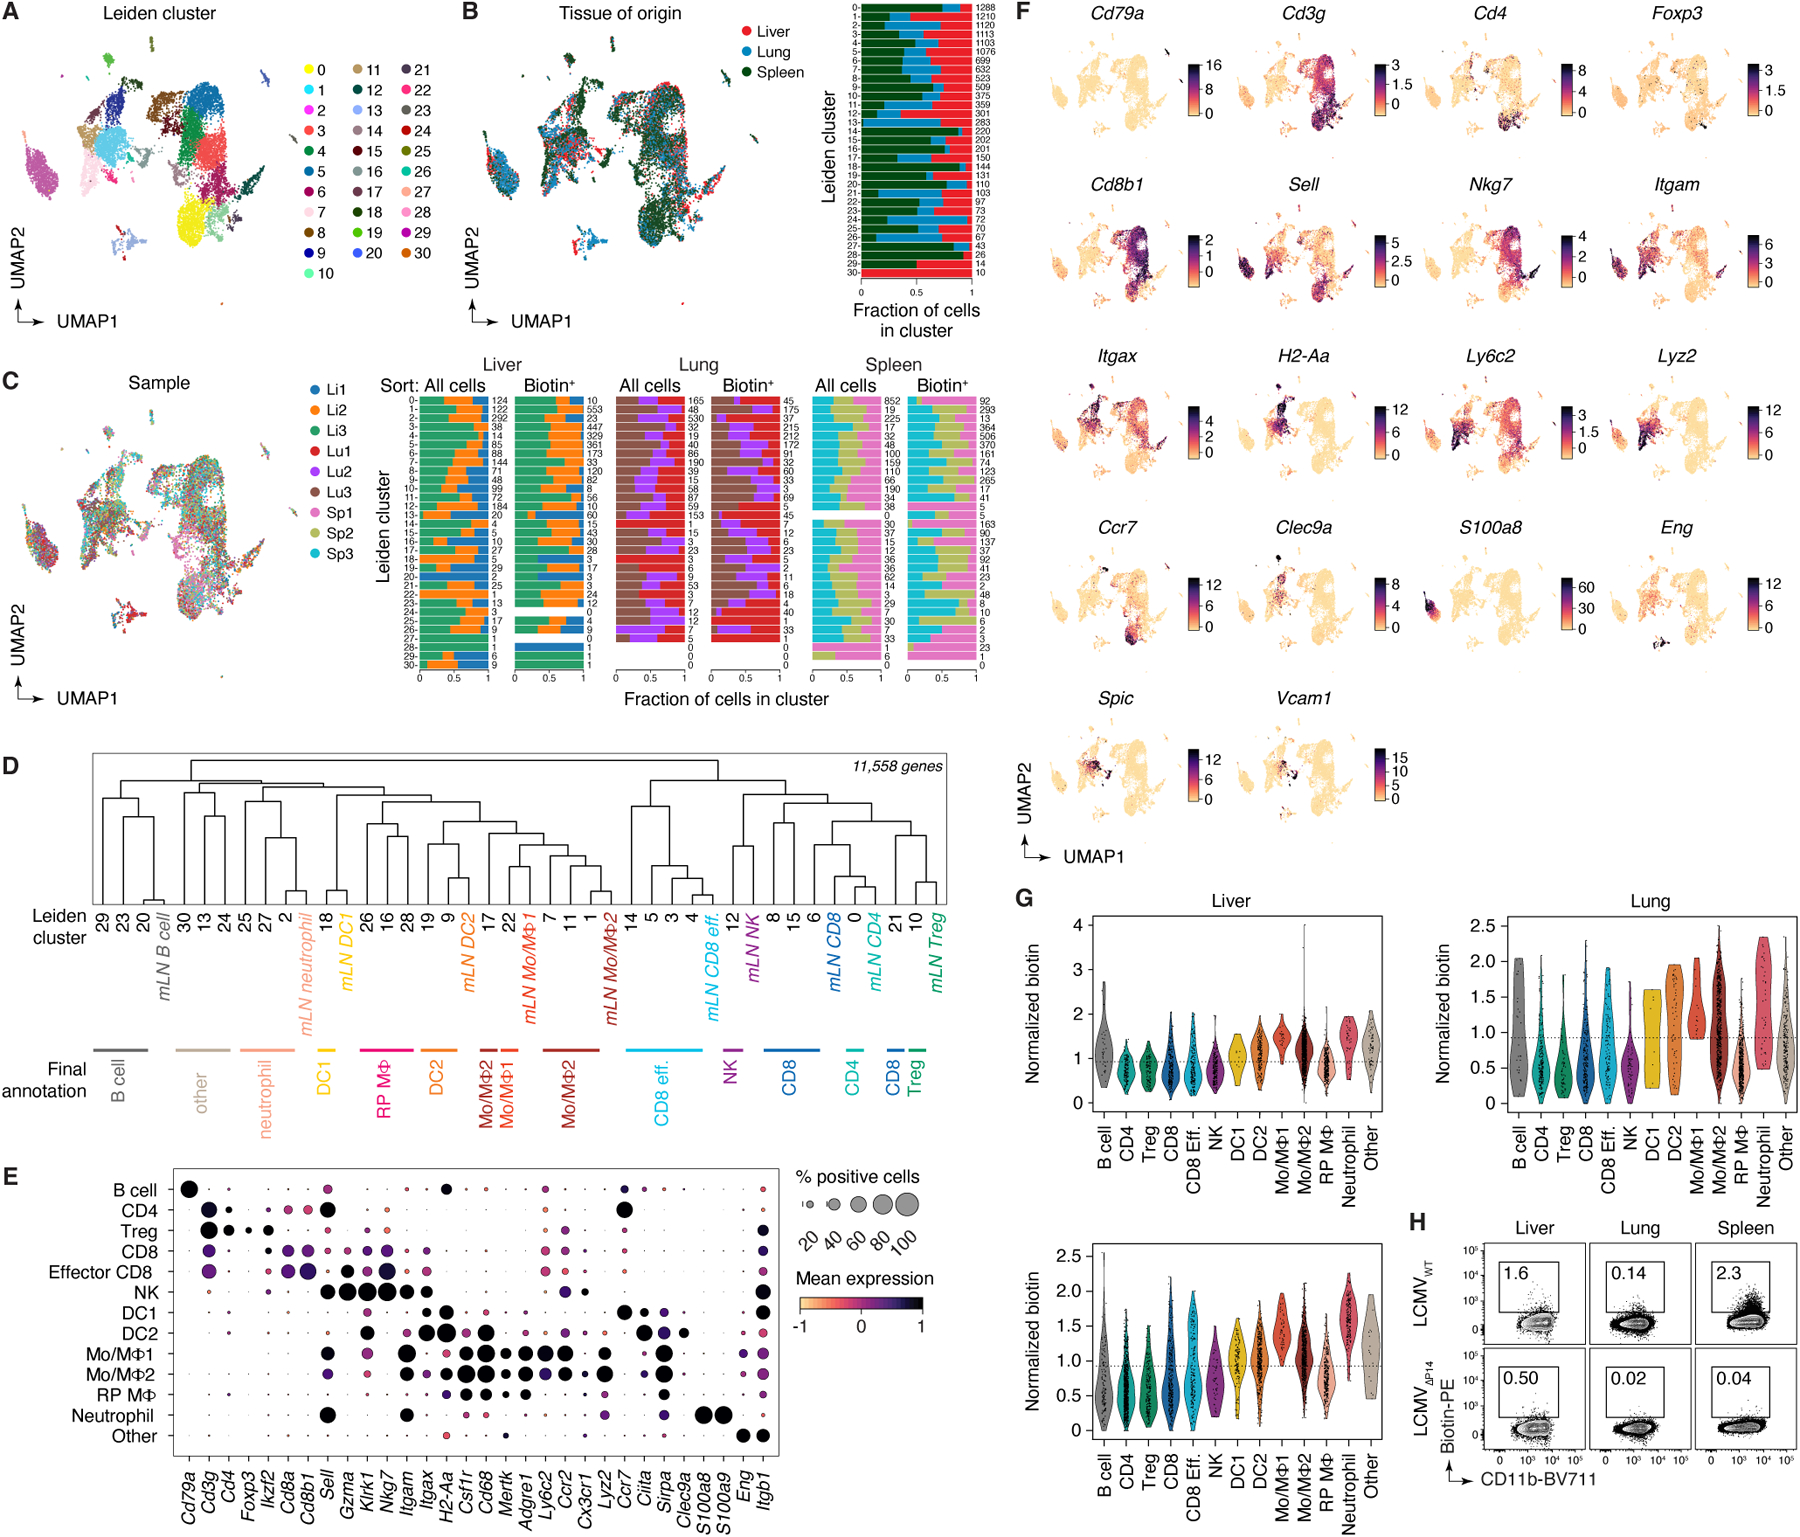
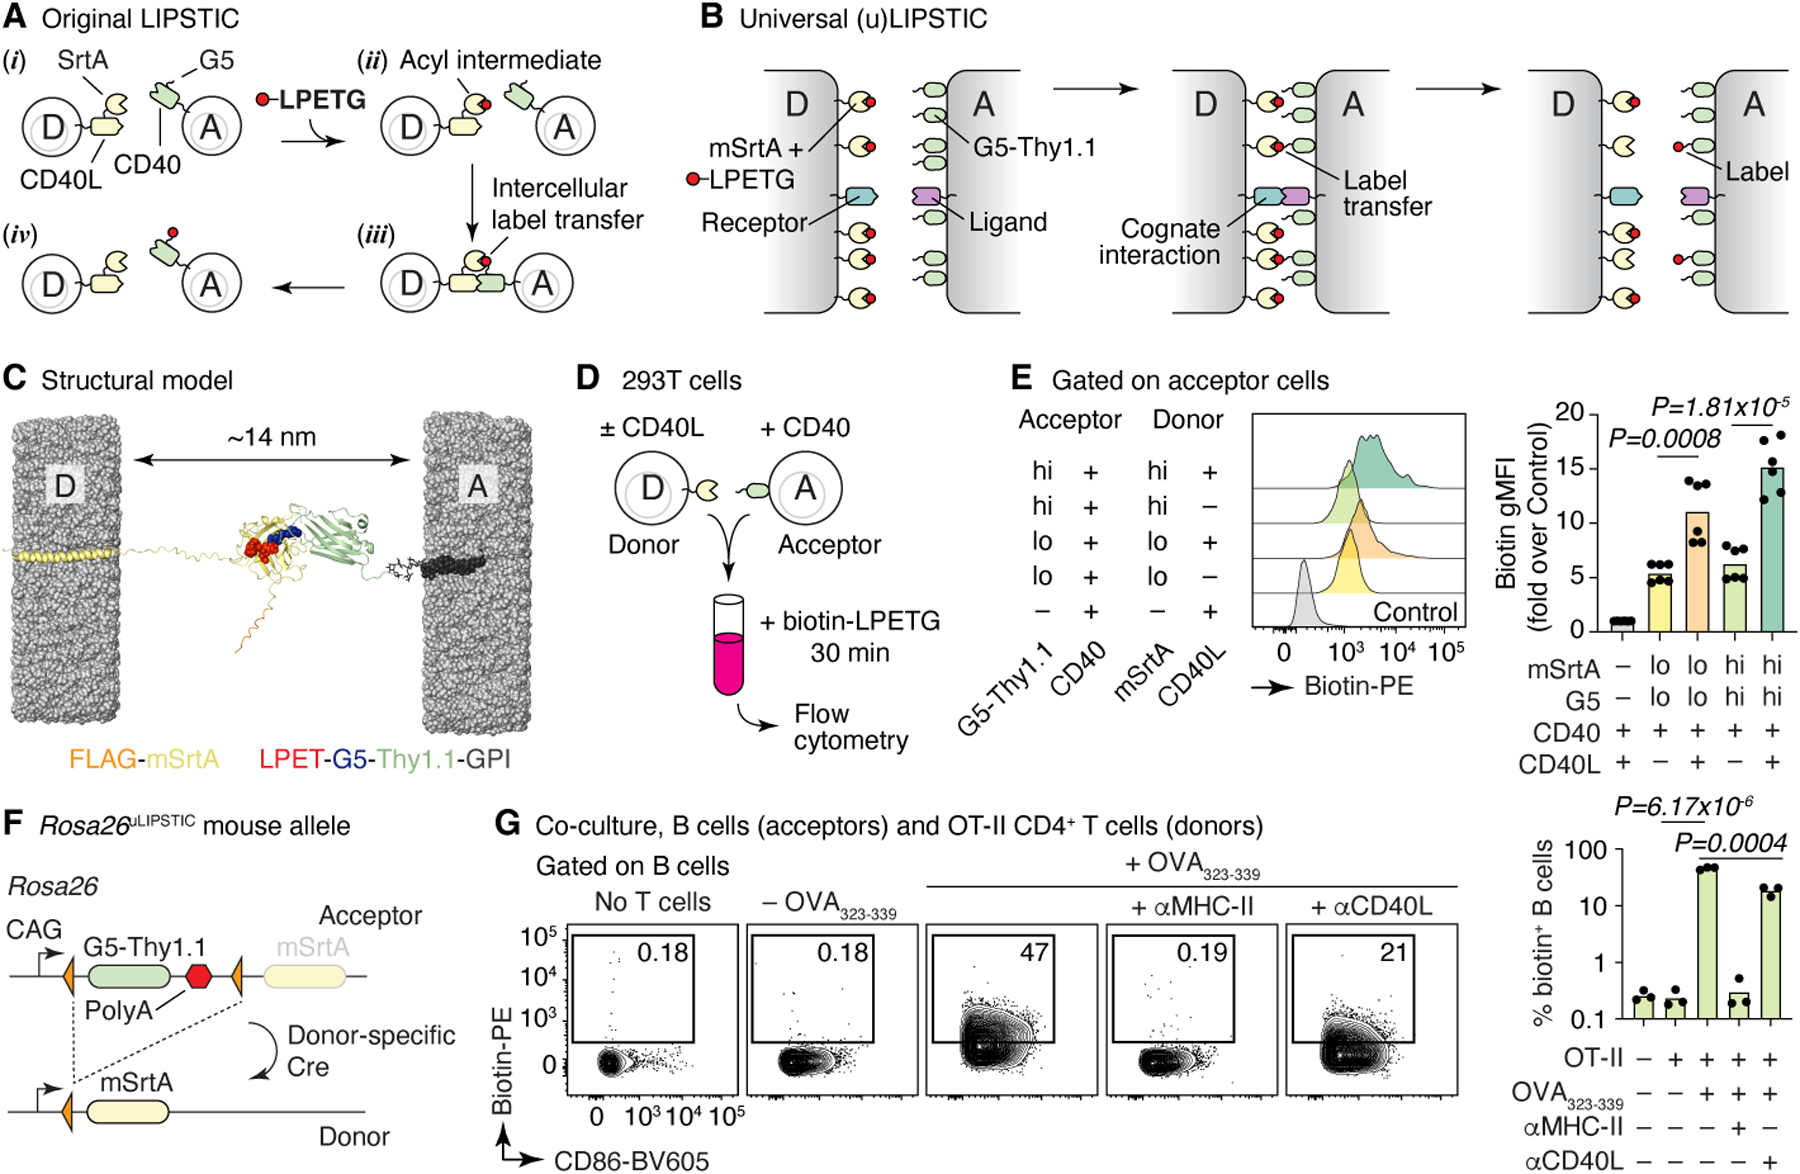
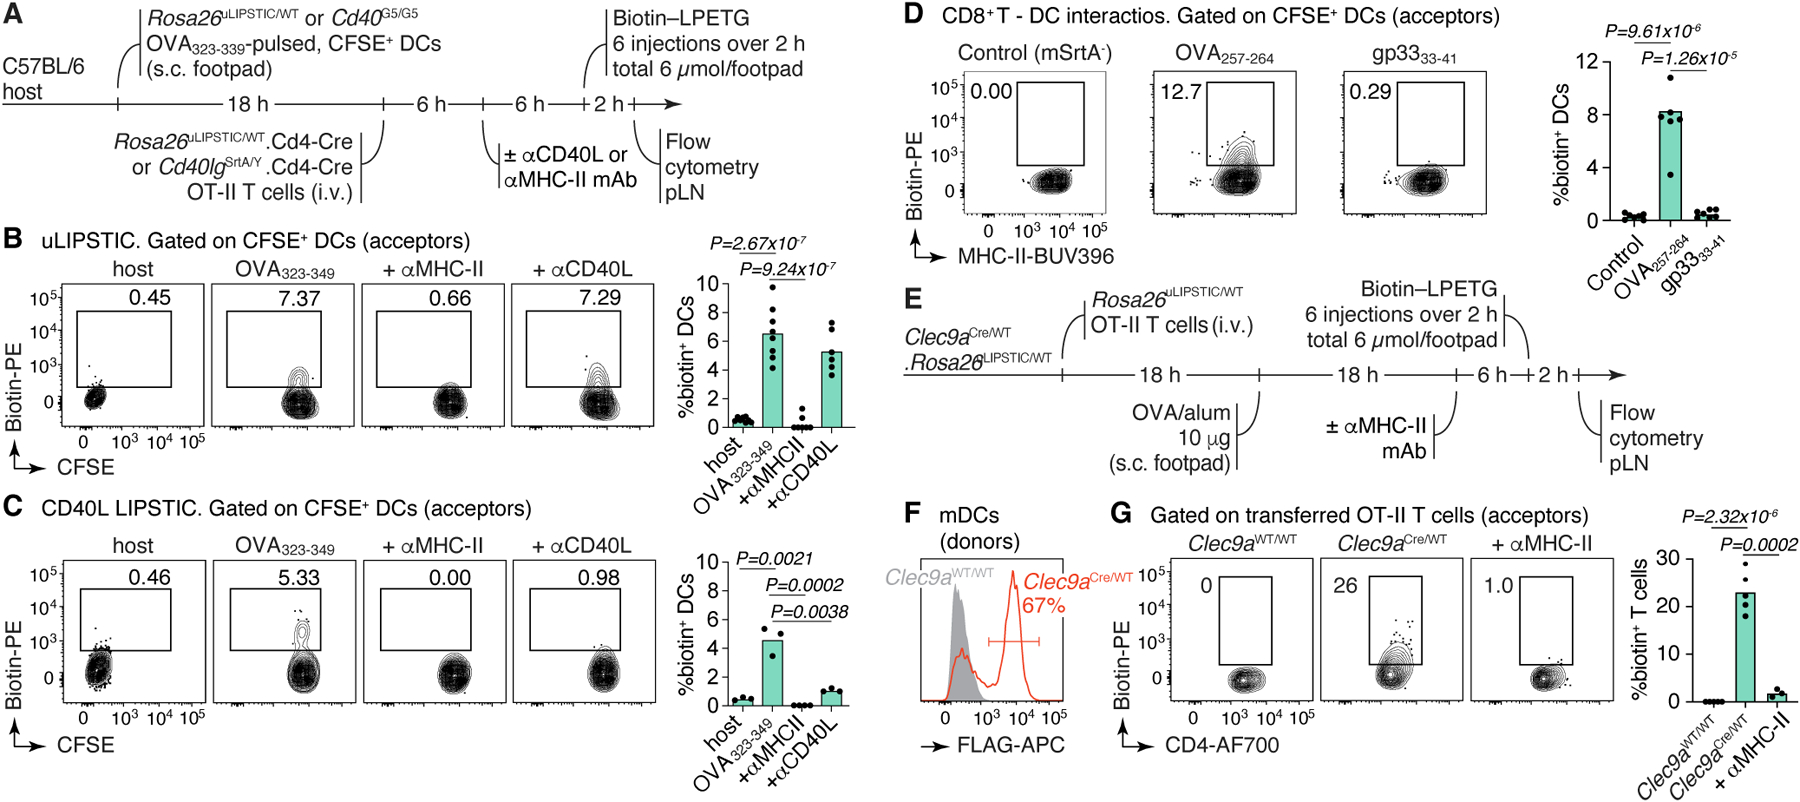
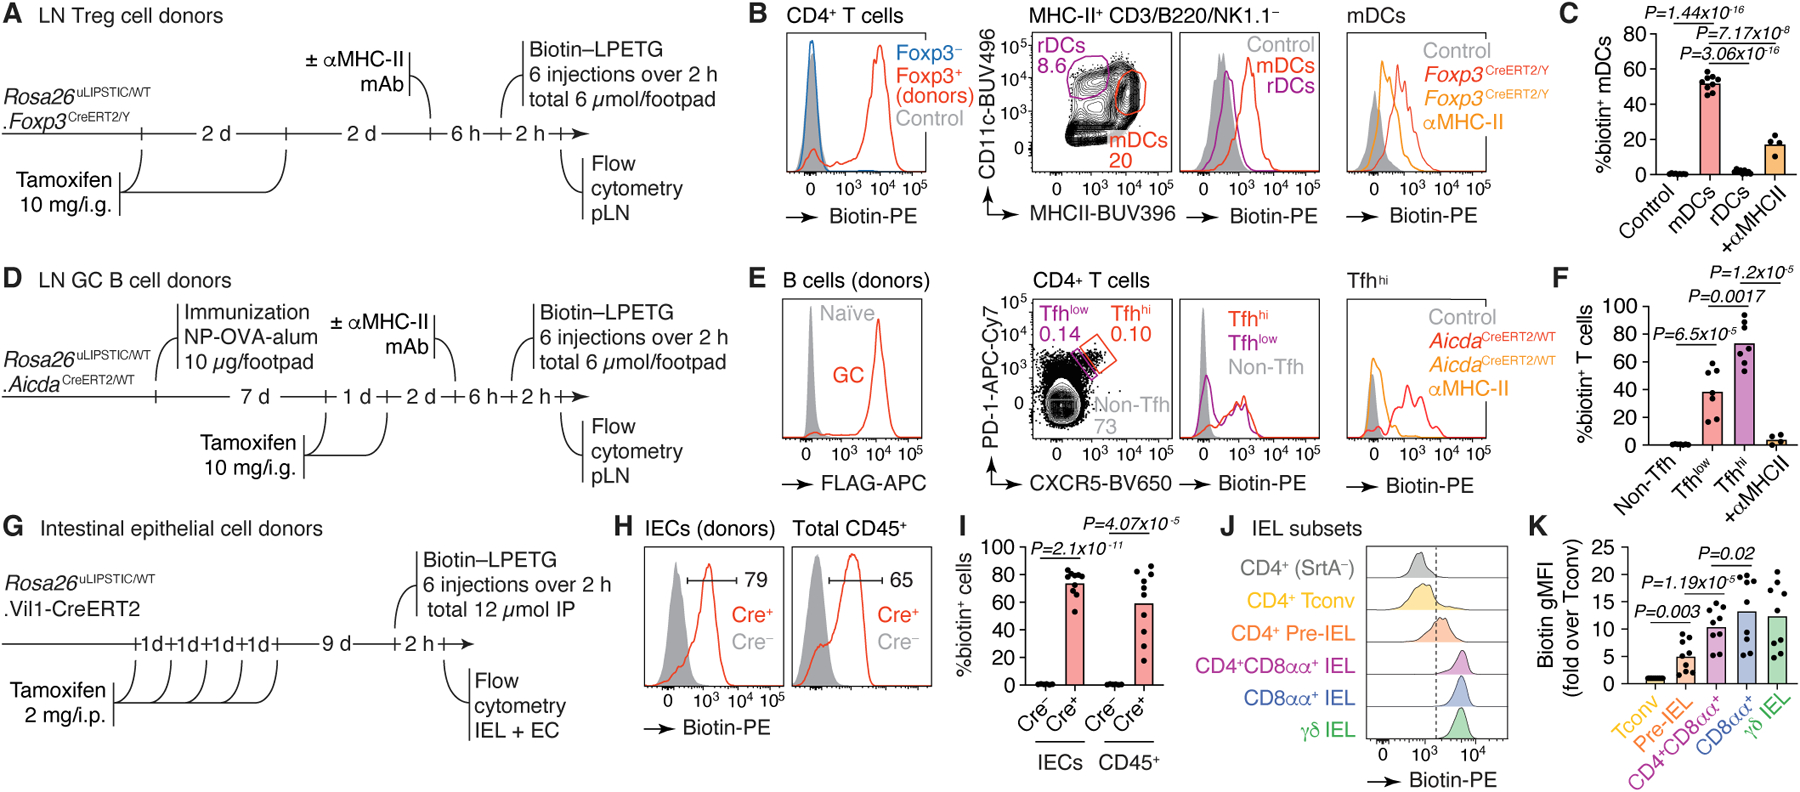
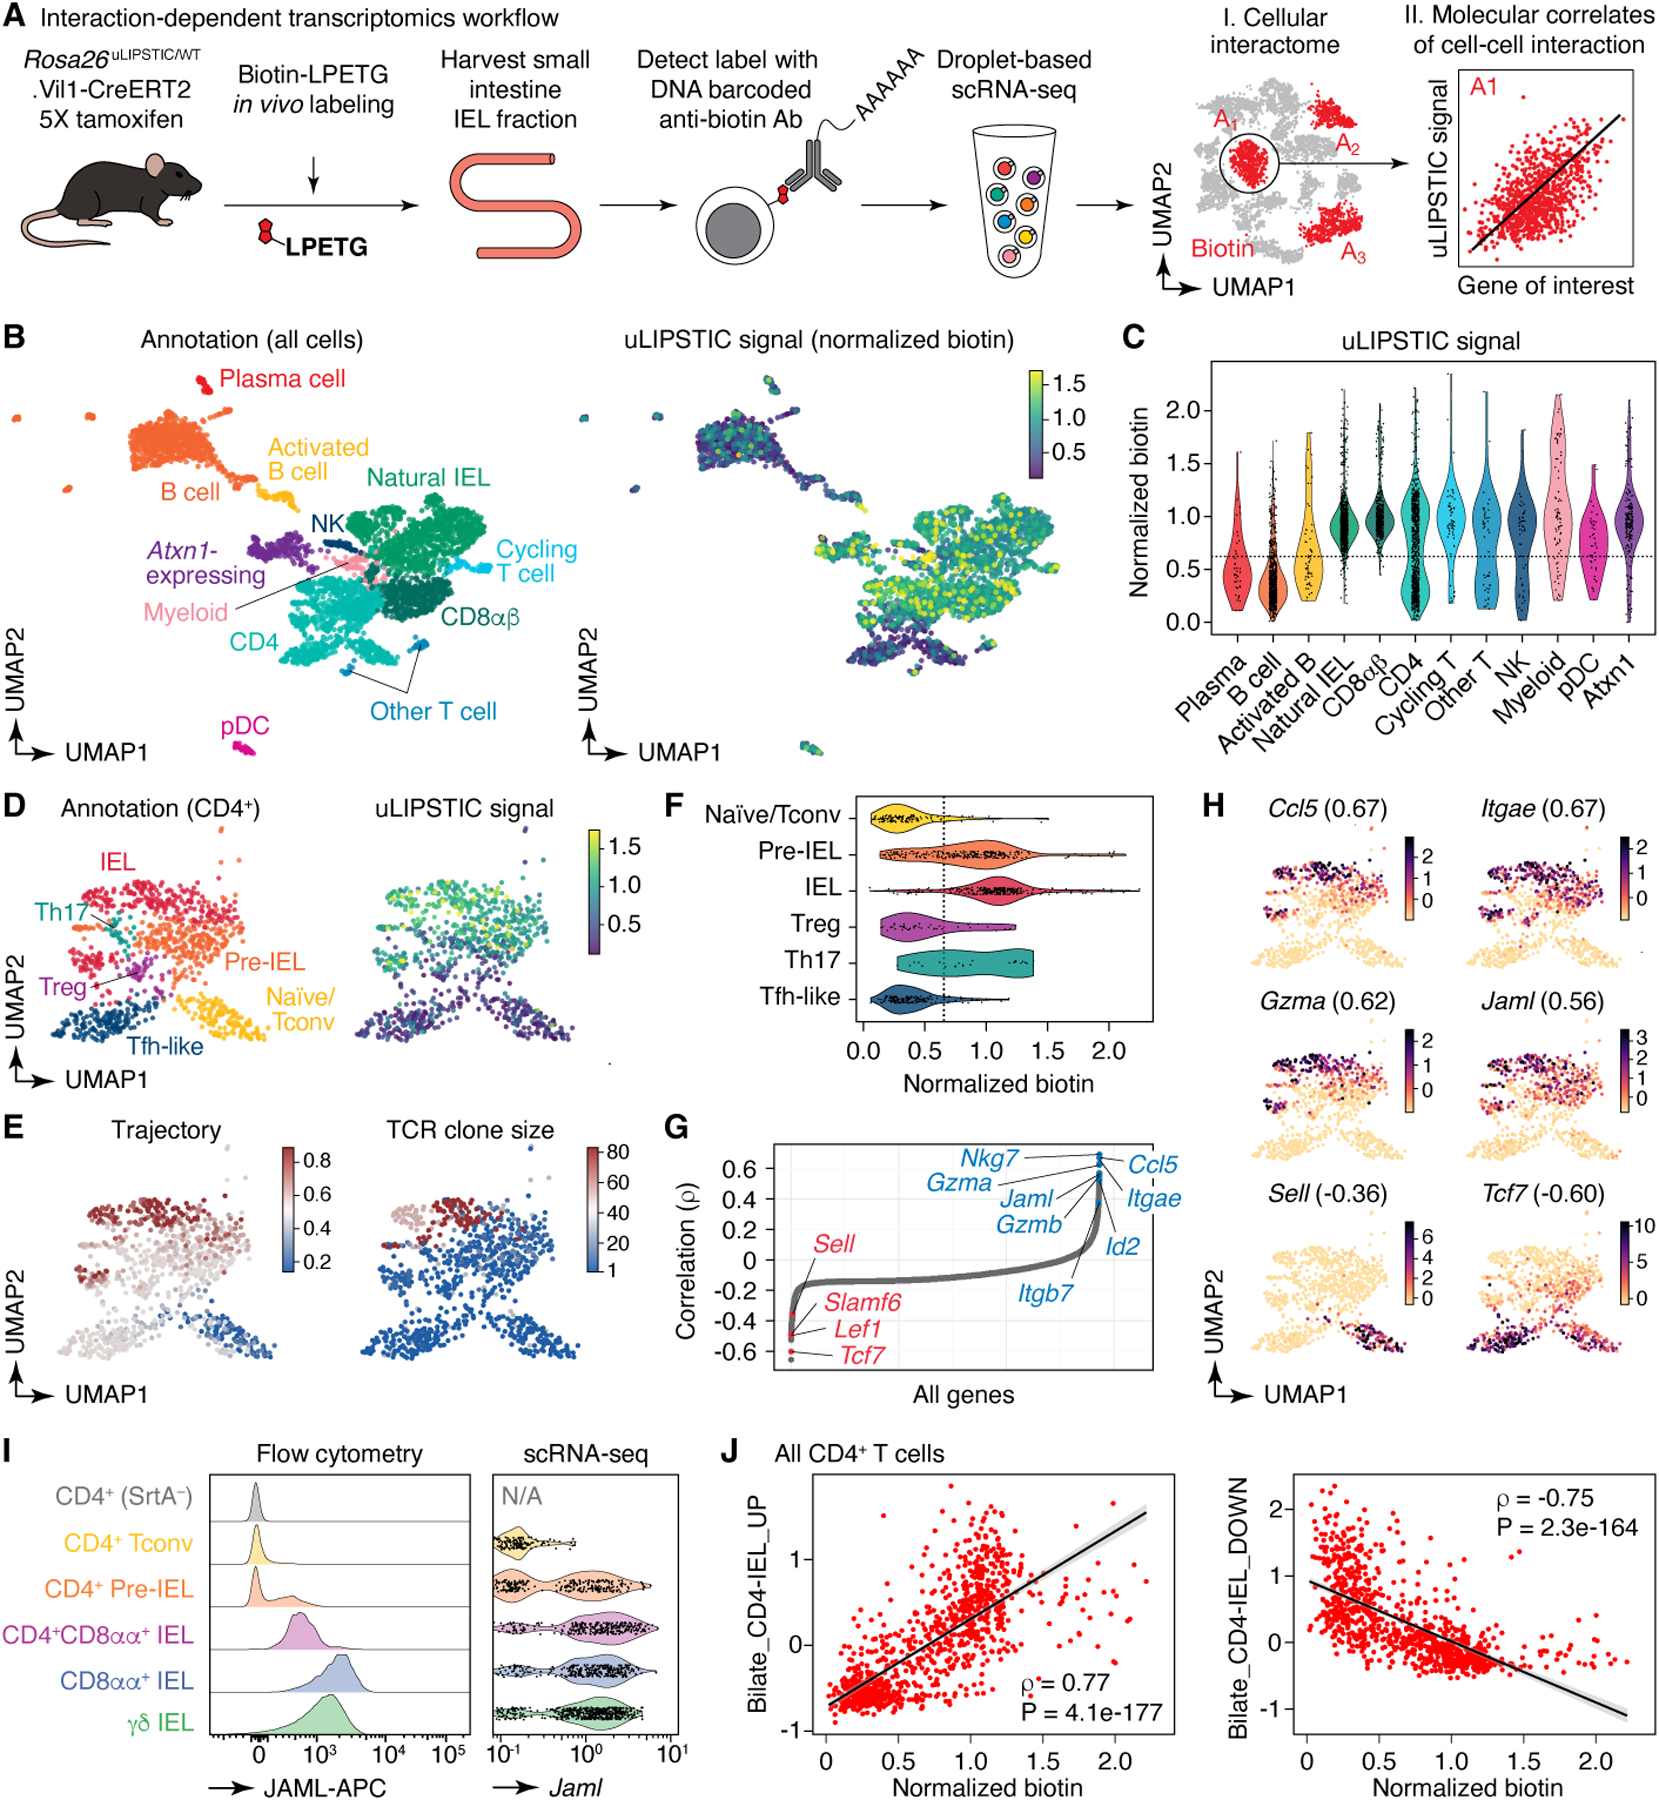
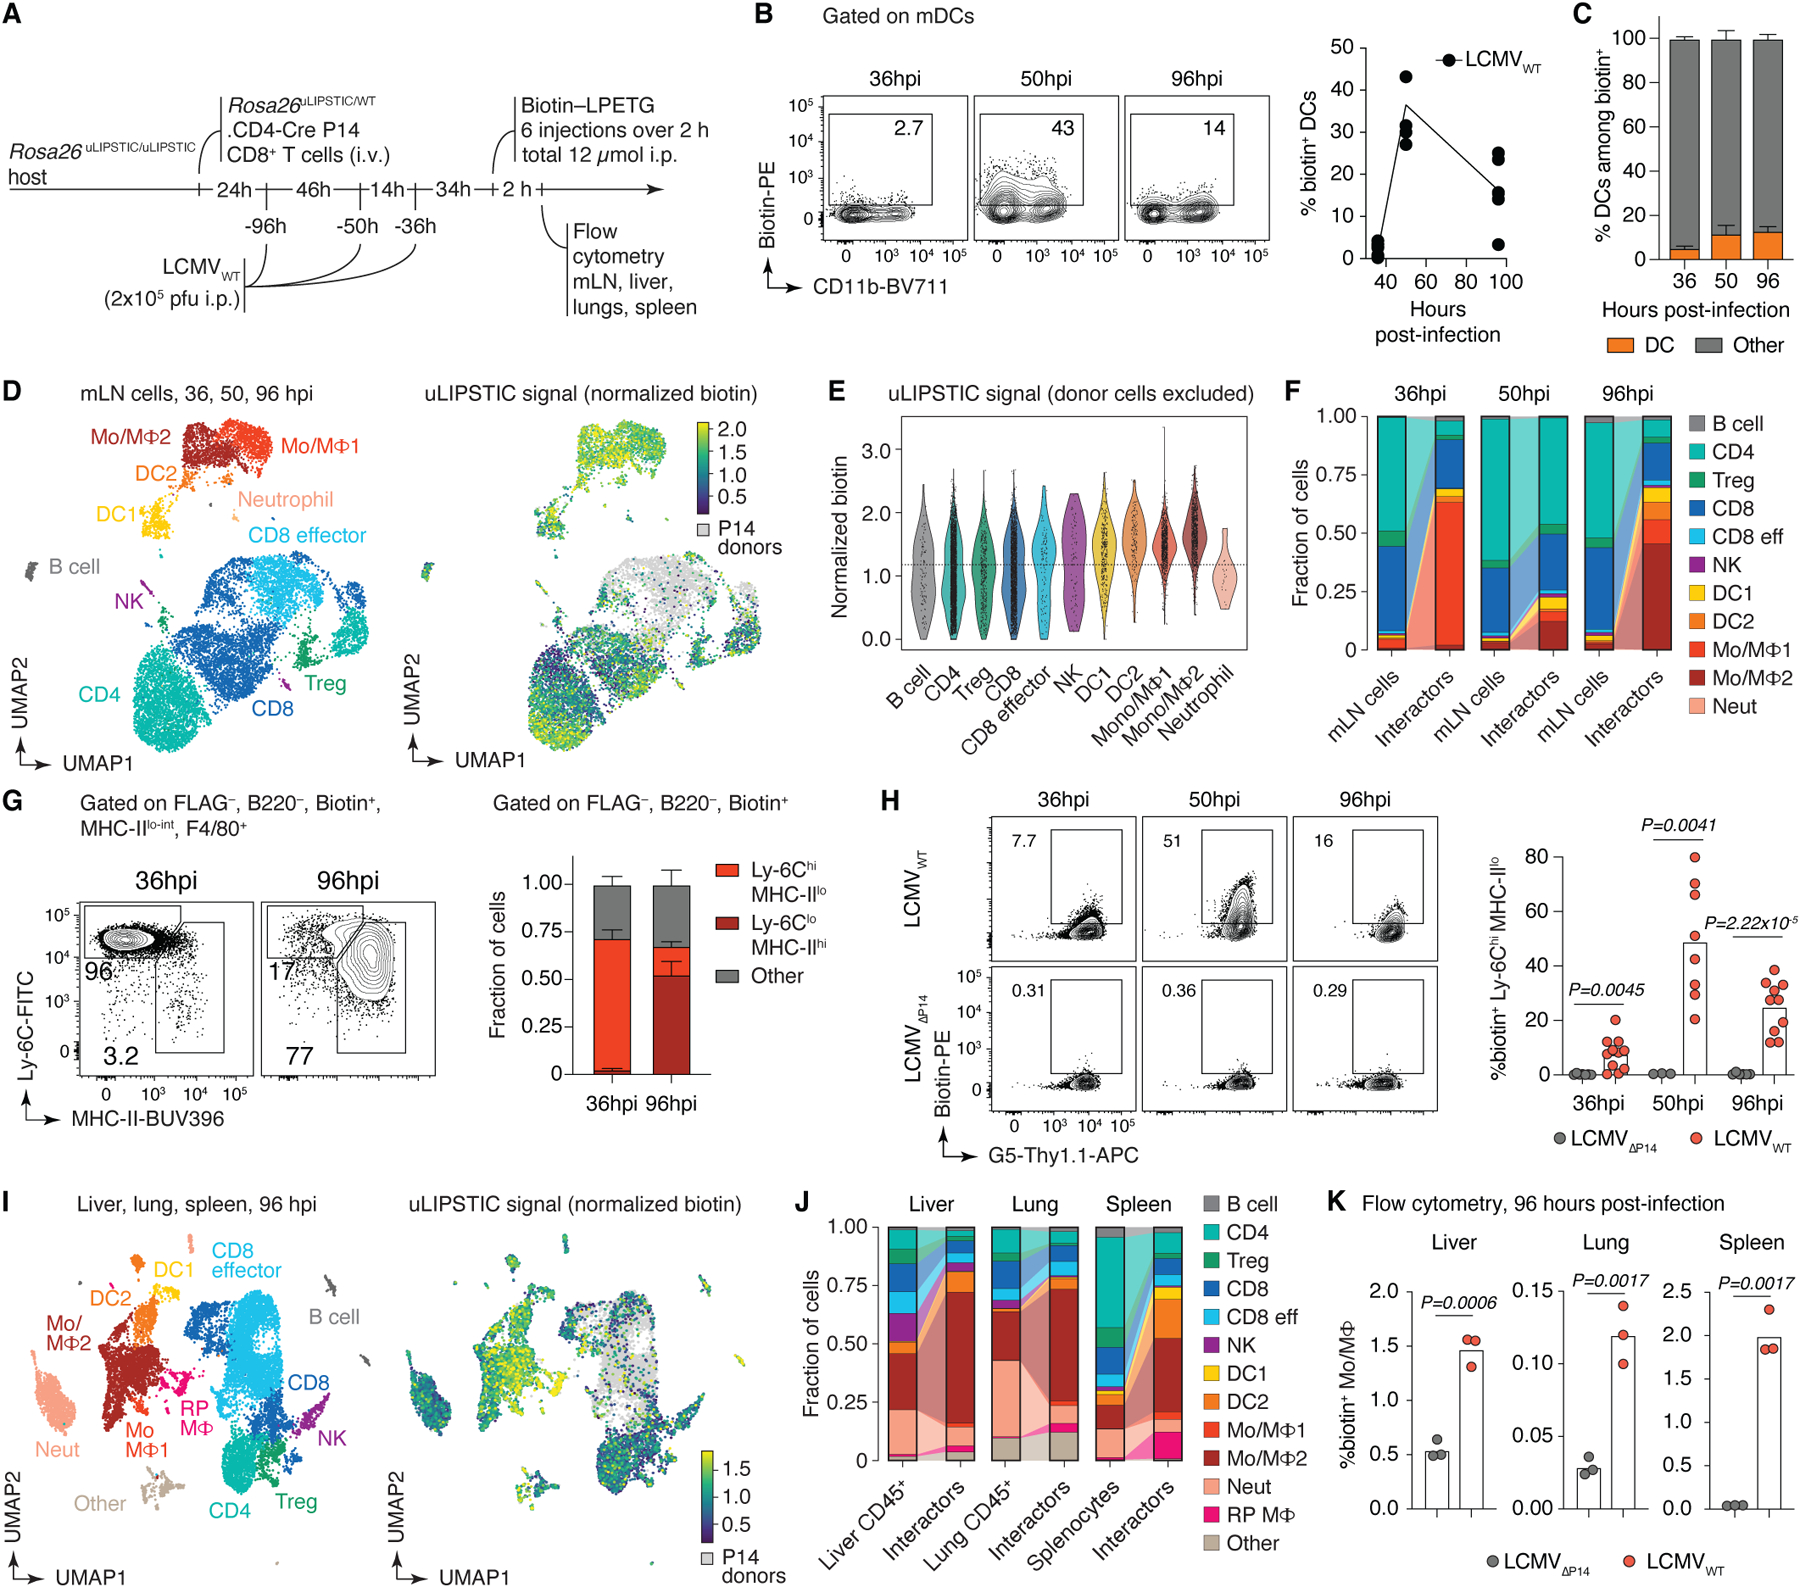
Immune cells rely on transient physical interactions with other immune and non-immune populations to regulate their function1. To study these 'kiss-and-run' interactions directly in vivo, we previously developed LIPSTIC (labelling immune partnerships by SorTagging intercellular contacts)2, an approach that uses enzymatic transfer of a labelled substrate between the molecular partners CD40L and CD40 to label interacting cells. Reliance on this pathway limited the use of LIPSTIC to measuring interactions between CD4+ T helper cells and antigen-presenting cells, however. Here we report the development of a universal version of LIPSTIC (uLIPSTIC), which can record physical interactions both among immune cells and between immune and non-immune populations irrespective of the receptors and ligands involved. We show that uLIPSTIC can be used, among other things, to monitor the priming of CD8+ T cells by dendritic cells, reveal the steady-state cellular partners of regulatory T cells and identify germinal centre-resident T follicular helper cells on the basis of their ability to interact cognately with germinal centre B cells. By coupling uLIPSTIC with single-cell transcriptomics, we build a catalogue of the immune populations that physically interact with intestinal epithelial cells at the steady state and profile the evolution of the interactome of lymphocytic choriomeningitis virus-specific CD8+ T cells in multiple organs following systemic infection. Thus, uLIPSTIC provides a broadly useful technology for measuring and understanding cell-cell interactions across multiple biological systems.


Conflict of interest statement

Competing Interests: G.D.V. is an advisor for and owns stock futures in the Vaccine Company, Inc. E.F. recently served on the SABs of L’Oreal and Arsenal Biosciences and owns stock futures in the latter company.

Figures

Extended Data Figure 1 |
Extended Data Figure 1 |. Design and characterization of Rosa26uLIPSTIC mice.
(A) The uLIPSTIC cassette carrying the lox-stop-lox G5Thy1.1 followed by mSrtA-PDGFRtm fused to FLAG tag was cloned into the Ai9 Rosa26 targeting plasmid. (B) Insertion of the uLIPSTIC cassette was assessed in embryonic stem (ES) cells by Southern blotting using a 32P-labeled probe (Supplementary Table 8 and Supplementary Figure 1 for gel source data) annealing upstream of the left arm after EcoRI digestion. ESCs carrying the insertion exhibit an extra EcoRI restriction site, resulting in a 7.4 kb fragment upon enzymatic digestion. The blot shows 2 heterozygous integrations out of 7 ES cell clones screened. (C-E) The specificity and efficiency of Rosa26uLIPSTIC recombination are determined by the Cre driver used. (C) Representative gating strategy for resident dendritic cells (rDCs; LIN, MHC-IIint, CD11chi), migratory dendritic cells (mDCs; LIN, MHC-IIhi, CD11c+), CD4+ T cells, CD8+ T cells, regulatory T (Treg) cells and B cells in lymph nodes. (D) SrtA expression (determined by FLAG detection) is induced by Cre recombination. Use of a constitutive Cre line (e.g., CD4-Cre) results in efficient but non-specific SrtA expression, generating T cells that can only be used in adoptive cell transfer experiments. The use of inducible Cre lines such as CD4-CreERT2 and Foxp3CreERT2 can often resolve specificity issues, enabling the implementation of uLIPSTIC in fully endogenous models. (E) SrtA expression in conventional DC subsets 1 (cDC1) and 2 (cDC2) in Rosa26uLIPSTIC/WT.Clec9aCre/WT mice.
Extended Data Figure 2 |
Extended Data Figure 2 |. Kinetics and sensitivity of the uLIPSTIC reaction.
(A-E) Kinetics of the uLIPSTIC reaction. (A) Experimental setup for panels (B-E). OT-II CD4+ T cells from Rosa26uLIPSTIC/WT.CD4-Cre or Rosa26WT/WT.CD4-Cre control mice were co-incubated ex vivo with Rosa26uLIPSTIC/uLIPSTIC acceptor DCs in the presence of OVA323–339 cognate peptide. LIPSTIC substrate was added during the final minutes of incubation as indicated. (B,C) Efficiency of formation of the acyl intermediate (loading of LIPSTIC substrate onto SrtA) in OT-II SrtA+ donor T cells increases gradually with time. (D,E) Transfer of LIPSTIC substrate onto the surface of interacting acceptor DCs followed similar kinetics as acyl intermediate formation. (F-J) uLIPSTIC can resolve differences in peptide concentration and affinity both in vitro and in vivo. (F) Altered peptide ligands (APLs) of the OVA323–339 peptide, when complexed with MHC-II, display decreasing affinities for the OT-II TCR. (G) In vitro co-culture of Rosa26uLIPSTIC/WT.CD4-Cre OT-II T cells with Rosa26uLIPSTIC/uLIPSTIC DCs loaded with its APLs results in a reduction in LIPSTIC labeling that aligns with both the affinity of the peptide-MHCII complex to the OT-II TCR and the peptide concentration gradients. (H) Experimental layout for panels (I,J). (I) In vivo labeling of APL-pulsed DCs show decreased uLIPSTIC labeling in accordance with the affinity to the fixed OT-II TCR. Quantified in (J). Data for all plots are for three mice per condition from one experiment. P-values were calculated using two-tailed Student’s tests.
Extended Data Figure 3 |
Extended Data Figure 3 |. uLIPSTIC labeling of T cell–DC interactions in adaptive transfer models.
(A-E) mSrtA+ donor cell numbers determine the degree of uLIPSTIC labeling. (A) Experimental layout for panels (B-E). Increasing numbers (105, 3 × 10⁵, 106, 3 × 10⁶) of Rosa26uLIPSTIC/+.CD4-Cre OT-II CD4+ T cells were adoptively transferred into recipient Rosa26uLIPSTIC/ uLIPSTIC mice, followed by OVA/alum immunization 18 h post-transfer and LIPSTIC substrate injection one day later. The number of transferred cells (CD45.1/2) determined the proportion of donor cells in the CD4+ T cell compartment (B-C) and the corresponding percentage of labeled interacting cells in the mDC compartment (D-E). (F-I) Persistence of label on acceptor cells with time. (F) Experimental layout for panels (G-I). (G) uLIPSTIC labeling of mDCs after incremental delays between substrate injection and tissue harvest. Quantified in (H,I). Data for all plots are for three mice per condition from one experiment. P-values were calculated using two-tailed Student’s tests.
Extended Data Figure 4 |
Extended Data Figure 4 |. uLIPSTIC labeling in inducible Cre lines in fully endogenous models.
(A-D) uLIPSTIC labeling of Treg cell interactions in the steady-state pLN. (A) Cellular interactome of Tregs at steady-state. Rosa26uLIPSTIC/WT.Foxp3CreERT2/Y experimental mice and Rosa26WT/WT.Foxp3CreERT2/Y controls were given tamoxifen and administered LIPSTIC substrate in the footpad 2 days later. Left, flow cytometry plots show uLIPSTIC labeling in selected immune populations in control (top) and experimental (bottom) mice. The presence of residual labeling in B cells is an artifact common to uLIPSTIC and to other flow-cytometry based methods aimed at identifying rare B cell populations, likely due to B cell receptor-dependent binding of detection components by polyclonal B cells. Right, quantification of the proportion of all labeled cells belonging to each major immune population in control (SrtA) or experimental (SrtA+) mice. Data for three mice per condition from one experiment, bar plots show mean ± SEM. (B-D) Treg cells interact with mDCs to a greater extent than conventional CD4+ T cells. (B) To test if enhanced interaction with mDCs is a specific feature of Treg cells or a general feature of all CD4+ T cells, we titrated the dose of tamoxifen in Rosa26uLIPSTIC/+.CD4-CreERT2 mice to achieve a similar percentage of SrtA-expression among total CD4+ T cells as in Rosa26uLIPSTIC/+.Foxp3CreERT2/Y mice. (C) At a dose of 0.3 mg of tamoxifen, Rosa26uLIPSTIC/+.CD4-CreERT2 mice showed SrtA expression in a small number of Treg cells (left), with most SrtA+ cells observed in CD4+ conventional T cells (center) and overall numbers of SrtA+ cells among total CD4+ T cells that were comparable with those of Rosa26uLIPSTIC/+.Foxp3CreERT2/Y mice treated with 10 mg tamoxifen (right). (D) When numbers of Treg and CD4+ conventional donor cells are equalized, acceptor mDCs show stronger interaction with Treg cell partners. For (C) and (D), data from two independent experiments with each symbol representing one mouse, P-values were calculated using two-tailed Student’s tests. (E-G) Kinetics of tamoxifen-driven recombination of the Rosa26uLIPSTIC allele according to cell type. (E) SrtA expression in the highly proliferative mesenteric lymph node GC B cells of Rosa26uLIPSTIC/WT.AicdaCreER/WT mice was assessed at different timepoints after tamoxifen administration. The fraction of recombined cells plateaus at 24 h post-tamoxifen administration (hpt), while SrtA protein expression is still increasing by 96 hpt. (F) Labeling of GC B cell interacting partners can be detected as early as 12 hpt, increasing thereafter according to SrtA expression levels. (G) In contrast, SrtA expression in quiescent naïve (PD-1CXCR5CD69) CD4+ T cells in Rosa26uLIPSTIC/WT.Cd4-CreERT2 mice increased at a slower rate than, reaching >80% positive cells only at 96 hpt. For (E), (F) and (G), each plot used three mice per condition from one experiment, P-values were calculated using two-tailed Student’s tests
Extended Data Figure 5 |
Extended Data Figure 5 |. Intraperitoneally-injected LIPSTIC substrate reaches cells in multiple tissues.
(A) Steady state Rosa26uLIPSTIC/WT.Clec9aCreER/WT or Rosa26uLIPSTIC/WT.Clec9aWT/WT control mice were injected i.p. with the LIPSTIC substrate and its loading onto DCs was achieved in all analyzed tissues. (B-C) I.p. injection of the LIPSTIC substrate reaches the brain in Rosa26uLIPSTIC/WT.Cx3xr1CreERT2/WT mice. (B) Flow cytometry gating strategy to analyze CX3CR1-expressing microglia in the brain. To discriminate resident from circulating immune cells in the brain, α-CD45 antibody was injected intravenously to mark the latter. (C) SrtA expression was detected in ~80% of CD11b+CX3CR1+ cells, 68% of which acquired i.p.-administered LIPSTIC substrate.
Extended Data Figure 6 |
Extended Data Figure 6 |. uLIPSTIC to study epithelial cell – immune cell interactions in the gut.
(A-C) Flow cytometry strategy for intraepithelial immune cells. (A) Representative gating strategy for γδ TCR and αβ TCR (Cd8αα+, CD8αβ+, and CD4+) IEL subsets. (B) Top, expression of SrtA (FLAG) and capture of LIPSTIC substrate by IEC donor cells and bottom, transfer of substrate onto CD45+ acceptor cells in SrtA-expressing and control mice. (C) Sorting strategy for the scRNA-seq experiment. Samples were enriched for rarer (e.g., B cell, CD4-IEL) populations by first sorting 12,500 total cells then an additional 12,500 cells depleted of the dominant γδ, CD8αα, and CD8αβ IEL populations. Three independent samples were sorted and stained with different hashtag oligos for downstream identification. (D-L) Clustering analysis of the immune interactome of IECs in the small intestine. (D) UMAP colored by Leiden clustering of the entire scRNA-seq/uLIPSTIC dataset (n=3,677 cells) used as an intermediate step in cell type annotations. (E) Left, UMAP colored by biological replicate. Right, bar plot indicating cluster composition by biological replicate, cluster size indicated at the right of each bar. (F-G) Further analysis of cluster 10 shows that is a composite comprising proliferating T and B cells. This co-clustering of B and T cells held true for varying number of PCs between 20 and 100 (not shown). (F) Left, Leiden cluster 10 was isolated and sub-clustered, yielding two separate clusters (UMAP). Right, normalized expression of Cd79a and Cd8a for these two sub-clusters of cluster 10 determines their annotation as either B or T cells. (G) UMAP showing the S and G2M phase cell cycle gene list scores (obtained using the `score_genes_cell_cycle()` function with lists from the Seurat package), characterizing Leiden cluster 10 as proliferating cells, thus explaining their co-clustering. (H) UMAP showing final clustering of the entire data, with Leiden cluster 10 subdivided into clusters 10a and 10b. (I) Dendrogram representing transcriptional similarities among clusters. Differentially expressed genes were identified for each cluster (log2FC > 1, FDR < 0.05, see Methods), and normalized expression of all such genes (5,956 genes total), averaged per cluster, was used for the hierarchical clustering analysis that produced the dendrogram. Final annotation clusters shown in Fig. 4 are indicated below the Leiden cluster numbers. (J) Dot plot of marker genes indicating their level of expression in each cluster. Dot size indicates the fraction of cells in the cluster with Pearson residual normalized expression greater than 0, dot color represents level of expression. (K) Violin plot showing levels of normalized uLIPSTIC signal for each Leiden cluster. (L) UMAP showing presence of rearranged TCRα and β in each cell.
Extended Data Figure 7 |
Extended Data Figure 7 |. Expression of marker genes and gene signatures in the annotated scRNA-seq data.
(A) UMAP plots showing normalized gene expression levels for selected marker genes characteristic of the final annotation clus. (B) Dot plot of marker genes indicating level of expression for each cell type annotation. (C) Dot plot of scores for gene signatures of immune cell types from PanglaoDB. For both dot plots, dot size indicates the fraction of cells in the population with values greater than 0, dot color represents level of value (Pearson residual normalized expression or gene signature scores for B and C, respectively).
Extended Data Figure 8 |
Extended Data Figure 8 |. Analysis of combined scRNA-seq + uLIPSTIC data for CD4+ T cells.
(A) UMAP for CD4+ T cells showing new Leiden sub-clusters and expression of selected marker genes in each cluster (n=915). (B) Dot plot of marker genes for each annotated subset of CD4+ T cells. Dot size indicates the fraction of cells in the cluster with Pearson residual normalized expression greater than 0, dot color represents level of expression. (C) Bar plot indicating CD4 Leiden cluster composition by biological replicate, cluster size indicated at the top of each bar. (D) Spearman correlation values, in increasing order, for uLIPSTIC signal and normalized expression of a gene, calculated separately for cells from each biological replicate, indicating consistency across mice. (E) Spearman correlation values, in increasing order, for uLIPSTIC signal and normalized expression of a gene, calculated when removing Tfh-like and naïve/conventional T cells (Leiden CD4 sub-clusters 0 and 1). (F-I) Correlation between acquisition of uLIPSTIC label and expression of CD103 and selected gene signatures by CD4-IELs. (F) Flow cytometry plots show uLIPSTIC signal and CD103 expression in one control Rosa26uLIPSTIC/WT and three Vil1-Cre.Rosa26uLIPSTIC/WT mice treated as in Fig. 3G. (G) Gene signatures from the MSigDB “canonical pathways” (M2.CP) database showing significant positive association with normalized biotin signal in scRNA-seq analysis over all CD4+ T cells. Plots show Spearman’s ρ value for each signature. (H) Correlation between acquisition of uLIPSTIC signal by CD4+ T cells (shown for all T cells and excluding Tfh-like and Naïve/Tconv clusters) and expression of the Biocarta CTL gene signature. Trend line and error are for linear regression with 95% confidence interval, Spearman’s ρ and two-sided P-value are listed. (I) Correlation between acquisition of uLIPSTIC signal by CD4+ T cells (shown for T cells excluding Tfh-like and Naïve/Tconv clusters) and expression of gene signatures up and downregulated as epithelial T cells transition from Tconv (CD4+CD103CD8αα) to CD4-IEL (CD4+CD103+CD8αα+) phenotypes (signatures based on data from Bilate et al.). Trend line and error are for linear regression with 95% confidence interval, Spearman’s ρ and two-sided P-value are listed.
Extended Data Figure 9 |
Extended Data Figure 9 |. Using uLIPSTIC to study CD8+ T cell priming during acute systemic LCMV infection.
(A) Left, adoptively transferred LCMV-specific P14 CD8+ T cells infiltrated the mediastinal (m)LN of LCMV-infected Rosa26uLIPSTIC/uLIPSTIC hosts as early as 36 hpi. Right, fraction of P14 cells in total lymphocytes at the indicated timepoint. Data for ten mice per timepoint from three independent experiments, bar plots show mean ± SEM. (B) uLIPSTIC labeling of the P14-interactome (“Biotin+ All” in grey) showed that DCs (“Biotin+ DCs,” in orange) make up only a fraction of all interacting cells. (C) Sorting strategy for the scRNA-seq experiment. Immune cells—excluding B cells—were sorted both in an unbiased and biased manner, enriching for biotin+ acceptor cells and Flag+ donor cells using distinct hashtag oligos for downstream classification. Two-three independent samples per timepoint were sorted and stained with different hashtag oligos for downstream identification. (D-J) scRNA-seq nalysis of the immune interactome of P14 CD8+ T cells in the mLN during acute LCMV infection. (D) UMAP colored by Leiden clustering of the entire scRNA-seq/uLIPSTIC dataset (n=11,846 cells). (E) Left, UMAP colored by timepoint. Right, bar plot indicating cluster composition by timepoint, cluster size indicated at the right of each bar the right. (F) Left, UMAP colored by biological replicate. Right, bar plot indicating cluster composition by biological replicate, separated by whether the sample was sorted as total mLN cells or biotin-enriched mLN cells, as specified in (C). The cluster size is indicated at the right of each bar. (G) Dendrogram representing transcriptional similarities among clusters. Differentially expressed genes were identified for each cluster (log2FC > 1, FDR < 0.01, see Methods), and normalized expression of all such genes (6,484 genes total), averaged per cluster, was used for the hierarchical clustering analysis that produced the dendrogram. Final annotation clusters shown in Fig. 5 are indicated below the Leiden cluster numbers. (H) Dot plot of marker genes indicating their level of expression in each cell type annotation. Dot size indicates the fraction of cells in the cluster with Pearson residual normalized expression greater than 0, dot color represents level of expression. (I) UMAPs showing normalized gene expression levels for selected marker genes. (J) Violin plot showing levels of normalized uLIPSTIC signal for each cell type annotation, separated by timepoint and excluding P14 donor cells (high FLAG).
Extended Data Figure 10 |
Extended Data Figure 10 |. Analysis of combined scRNA-seq + uLIPSTIC data for LCMV tissues (profiled at 96 hpi).
(A) UMAP colored by Leiden clustering of the entire scRNA-seq/uLIPSTIC dataset (n=12,324 cells). (B) Left, UMAP colored by tissue type. Right, bar plot indicating cluster composition by tissue, cluster size indicated at the right of each bar. (C) Left, UMAP colored by biological replicate. Right, bar plot indicating cluster composition by biological replicate, separated by whether the sample was unsorted cells or sorted as biotin-enriched cells. The cluster size is indicated at the right of each bar. (D) Dendrogram representing transcriptional similarities among tissue Leiden clusters with annotations from the mLN data. Normalized expression of all genes in the LCMV datasets (11,558 genes total), averaged per Leiden cluster for the tissue data and averaged per annotation for the mLN data, was used for the hierarchical clustering analysis that produced the dendrogram. Final annotation clusters shown in Fig. 5 are indicated below the Leiden cluster numbers. (E) Dot plot of marker genes indicating their level of expression in each cell type annotation. Dot size indicates the fraction of cells in the population with Pearson residual normalized expression greater than 0, dot color represents level of expression. (F) UMAP plots showing normalized gene expression levels for selected marker genes characteristic of the final annotation clusters. (G) Violin plot showing levels of normalized uLIPSTIC signal for each cell type annotation, separated by tissue type and excluding P14 donor cells (high FLAG). (H) uLIPSTIC labeling of MHC-IIhi monocytes/macrophages (Mo/MΦ2) in organs of mice treated as in Fig. 5A but infected with either LCMVWT or LCMVΔP14, analyzed at 96 hpi. Data from one experiment with each symbol representing one mouse, P-values were calculated using two-tailed Student’s test.
Figure 1 |
Figure 1 |. The uLIPSTIC system.
(A, B) Schematic comparison of the original and universal LIPSTIC systems. In the original system (A), SrtA and G5 were brought into proximity by fusion to a receptor–ligand pair involved in a cell–cell interaction, allowing intercellular transfer of labeled substrate (LPETG) from donor cell “D” to acceptor cell “A.” In uLIPSTIC (B), SrtA and G5 (fused to the irrelevant protein Thy1.1) are anchored non-specifically to the cell membrane at high density; the enzymatic reaction is allowed to proceed when apposing membranes come within a short distance (< 14 nm) of each other, which can be driven by interactions between any receptor–ligand pair of the appropriate dimensions. (C) Computational model depicting the inter-membrane span of fully extended mSrtA upon transfer of the LPETG substrate onto G5-Thy1.1. (D,E) Populations of 293T cells co-transfected with high or low levels of either mSrtA or G5-Thy1.1 were co-incubated in the presence of biotin-LPETG for 30 min and analyzed by flow cytometry. Histograms show the extent of labeling of acceptor cells. Each symbol on column plot represents one technical replicate, pooled from two independent experiments. (F) Rosa26uLIPSTIC allele. Using the Ai9 high-expression backbone, a LoxP-flanked G5-Thy1.1 is followed by mSrtA. Cre-recombinase switches cells from “acceptor” (G5-Thy1.1+) to “donor” (mSrtA+) modes. (G) Rosa26uLIPSTIC/+.CD4-Cre OT-II donor T cells were co-cultured with Rosa26uLIPSTIC/+ acceptor B cells in the presence or absence of OVA323–339 peptide and blocking antibodies to CD40L and MHC-II. Flow cytometry plots show biotin-LPETG transfer from T to B cells. Each symbol in column plot represents a biological replicate from three independent experiments. For (E) and (G), P-values were calculated using two-tailed Student’s tests.
Figure 2 |
Figure 2 |. uLIPSTIC labeling of cell-cell interactions in vivo.
(A) Experimental layout for the experiments in panels (B,C). (B,C) uLIPSTIC (B) and CD40L LIPSTIC (C) labeling of adoptively-transferred DCs in an in vivo priming model. Flow cytometry plots are gated on transferred (CFSE-labeled) DCs. Column plot on the right summarize the extent of DC labeling. (D) uLIPSTIC labeling of DCs by CD8+ T cells. Experimental setup as in (A), but DCs were pulsed either with cognate (OVA257–264) or control (LCMV gp3333–41) peptides and transferred along with Rosa26uLIPSTIC/WT.CD4-Cre OT-I CD8+ donor T cells or control mSrtA Rosa26uLIPSTIC/WT OT-I CD8+ T cells. Labeling of DCs is summarized in column plot. (E-G) Labeling of antigen-specific CD4+ T cells by Clec9a-expressing DCs. (E) Experimental layout. (F) efficiency of recombination of the uLIPSTIC allele in migratory (m)DCs by Clec9aCre. (G) Left, labeling of adoptively transferred OT-II T cells upon immunization with OVA/alum. Right, summary of data. All results shown in column plots are from two independent experiments, with each symbol representing one mouse. P-values were calculated using two-tailed Student’s tests.
Figure 3 |
Figure 3 |. uLIPSTIC identifies cellular partners of Treg cells, Tfh cells, and IECs.
(A) Experimental layout for panels (B,C). (B) Left, efficiency of recombination of the uLIPSTIC allele in Treg cells by Foxp3CreERT2. Biotin signal represents the acquisition of substrate by Treg cells (the biotin-LPET-SrtA acyl intermediate) and also shows the absence of transfer of substrate to Foxp3 T cells. Center, labeling of migratory (m)DCs and resident (r)DCs by Treg cells at steady state. Right, labeling of mDCs upon injection of a blocking antibody to MHC-II. (C) Summary of data from 3 independent experiments. (D) Experimental layout for panels (E,F). (E) Labeling of Tfh cells by GC B cells. Left, efficiency of recombination of the uLIPSTIC allele in GC B cells by AicdaCreERT2 after 2 doses of tamoxifen, as in (B). Center, labeling of Tfh cells by GC B cells at 10 days after immunization with NP-OVA/alum. T cells are gated as high or low expressors of Tfh markers CXCR5 and PD-1 (Tfhhi and Tfhlo, respectively). Right, labeling of Tfhhi cells upon injection of a blocking antibody to MHC-II. (F) Summary of data from 2 independent experiments. (G) Experimental layout for panels (H-K). (H) Left, Efficiency of conversion of IECs into uLIPSTIC donors and substrate capture in Vil1-CreERT2 mice (as in (B)). Right, labeling of total CD45+ intraepithelial leukocytes. (I) Summary of data from three independent experiments. (J) Differential labeling of selected IEL populations by IEC donors. The dashed line is placed for reference. (K) Biotin geometric mean fluorescence intensity (gMFI) from three independent experiments is summarized. For all column plots, each symbol represents one mouse, bars represent the mean. P-values were calculated using two-tailed Student’s tests.
Figure 4 |
Figure 4 |. Using uLIPSTIC for interaction-based transcriptomics.
(A) Experimental workflow. (B) UMAP plots of the CD45+ intraepithelial immune cell fraction from a uLIPSTIC reaction as in Fig. 3G. Data pooled from three mice. Left, major cell populations (see Extended Data Figs. 6,7). Right, normalized uLIPSTIC signal in log-scaled arbitrary units. (C) Normalized uLIPSTIC signal among CD45+ cell populations. (D) UMAP plots of CD4+ T cells from (B), n=915 cells. Left, major cell subpopulations (see Extended Data Fig. 11). Right, normalized uLIPSTIC signal. (E) Left, inferred trajectory and right, αβTCR diversity (plotted as clone size) among CD4+ T cells. (F) Normalized uLIPSTIC signal among CD4+ T cell subpopulations. (G) Correlation (Spearman’s ρ) between normalized uLIPSTIC signal and normalized gene expression, calculated for each gene over all CD4+ T cells, shown in order of increasing correlation. Selected significantly correlated genes (FDR < 1e-23) are highlighted. (H) Normalized expression of selected genes. Correlation with normalized uLIPSTIC shown in parentheses. (I) Representative samples showing in vivo staining of JAML in IELs and scRNA-seq expression of Jaml in the equivalent populations. In the latter, CD8αα+ and γδ IEL were separated from within the “Natural IEL” cluster by the presence of rearranged αβ TCRs or expression of the Trdc gene. (J) Relationship between normalized uLIPSTIC signal among all CD4+ T cells and expression of gene signatures up and downregulated as epithelial T cells transition from Tconv (CD4+CD103CD8αα) to CD4-IEL (CD4+CD103+CD8αα+) phenotypes (signatures based on data from Bilate et al.). Trend line and error are for linear regression with 95% confidence interval, Spearman’s ρ and two-sided P-value are listed.
Figure 5 |
Figure 5 |. Using uLIPSTIC to dissect the early events in CD8+ T cell priming upon LCMV infection.
(A) Experimental layout. (B) Left, labeling of DCs by P14 cells at the indicated timepoint. Right, summary of data from three independent experiments. (C) Proportion of DCs among biotin+ acceptor cells, as determined by flow cytometry. Data for six mice per timepoint from three independent experiments. (D) UMAP plots of mLN cells sorted as in (A). Data pooled from 36, 50, and 96 hpi, with 2–3 mice per timepoint. Cells were enriched for uLIPSTIC acceptors and depleted of B cells as described in Extended Data Fig. 9C. Left, major cell type annotations (see Extended Data Fig. 9G–I). Right, normalized uLIPSTIC signal (biotin), excluding donor P14 cells. (E) Normalized uLIPSTIC signal among all cell populations, excluding donor P14 cells. (F) Distribution of cell types as in (D) in total mLN cells vs. in the biotin+ acceptor fraction (excluding P14 donors). (G) Left, distribution of uLIPSTIC labeled monocytic cells (Mo/MΦ) at indicated timepoints. Right, abundance of the indicated populations as a fraction of all uLIPSTIC-labeled acceptor cells. Data for four mice per timepoint from one experiment. (H) Left, uLIPSTIC labeling of Ly6Chi monocytes (Mo/MΦ1) at 36 hpi after infection with either LCMVWT or LCMVΔP14. Right, quantification of data from three independent experiments. (I) As in (D) but for pooled samples from liver, lung, and spleen at 96 hpi. (J) As in (F) but for pooled samples from liver, lung, and spleen at 96 hpi. (K) uLIPSTIC labeling of MHC-IIhi monocytes/macrophages (Mo/MΦ2) in organs of mice treated as in (A) but infected with either LCMVWT or LCMVΔP14, analyzed at 96 hpi. Data from one experiment. Bar plots in (C) and (G) show mean ± SEM. For (B), (H) and (K), each symbol represents one mouse and P-values were calculated using two-tailed Student’s test.

Update of

References

    1. Dustin ML The immunological synapse. Cancer Immunol Res 2, 1023–1033 (2014). 10.1158/2326-6066.CIR-14-0161 - DOI - PMC - PubMed
    1. Pasqual G et al. Monitoring T cell-dendritic cell interactions in vivo by intercellular enzymatic labelling. Nature 553, 496–500 (2018). 10.1038/nature25442 - DOI - PMC - PubMed
    1. Greenwald I & Rubin GM Making a difference: the role of cell-cell interactions in establishing separate identities for equivalent cells. Cell 68, 271–281 (1992). 10.1016/0092-8674(92)90470-w - DOI - PubMed
    1. Sudhof TC & Malenka RC Understanding synapses: past, present, and future. Neuron 60, 469–476 (2008). 10.1016/j.neuron.2008.10.011 - DOI - PMC - PubMed
    1. Victora GD & Nussenzweig MC Germinal centers. Annu Rev Immunol 30, 429–457 (2012). 10.1146/annurev-immunol-020711-075032 - DOI - PubMed

MeSH terms