. 2024 Apr;628(8006):130-138.
doi: 10.1038/s41586-024-07148-y. Epub 2024 Mar 6.

Genome-wide characterization of circulating metabolic biomarkers

Minna K Karjalainen #  1   2   3 Savita Karthikeyan #  4 Clare Oliver-Williams  4   5 Eeva Sliz  6   7 Elias Allara  4   8   9 Wing Tung Fung  4   9 Praveen Surendran  4   10   11   12 Weihua Zhang  13   14 Pekka Jousilahti  15 Kati Kristiansson  15 Veikko Salomaa  15 Matt Goodwin  16   17 David A Hughes  16   17 Michael Boehnke  18 Lilian Fernandes Silva  19 Xianyong Yin  18   20 Anubha Mahajan  21   22 Matt J Neville  23   24 Natalie R van Zuydam  21   24 Renée de Mutsert  25 Ruifang Li-Gao  25 Dennis O Mook-Kanamori  25   26 Ayse Demirkan  27   28 Jun Liu  29   30 Raymond Noordam  31 Stella Trompet  31   32 Zhengming Chen  29   33 Christiana Kartsonaki  29   33 Liming Li  34   35   36 Kuang Lin  29 Fiona A Hagenbeek  37   38   39 Jouke Jan Hottenga  37   38 René Pool  37   38 M Arfan Ikram  30 Joyce van Meurs  40 Toomas Haller  41 Yuri Milaneschi  42 Mika Kähönen  43   44 Pashupati P Mishra  43   45   46 Peter K Joshi  47 Erin Macdonald-Dunlop  47 Massimo Mangino  48   49 Jonas Zierer  48 Ilhan E Acar  50   51 Carel B Hoyng  51 Yara T E Lechanteur  51 Lude Franke  52 Alexander Kurilshikov  52 Alexandra Zhernakova  52 Marian Beekman  53 Erik B van den Akker  53   54   55 Ivana Kolcic  56 Ozren Polasek  56 Igor Rudan  47 Christian Gieger  57   58 Melanie Waldenberger  57   58 Folkert W Asselbergs  59   60 China Kadoorie Biobank Collaborative GroupEstonian Biobank Research TeamFinnGenCaroline Hayward  61 Jingyuan Fu  52   62 Anneke I den Hollander  51   63 Cristina Menni  48 Tim D Spector  48 James F Wilson  47   61 Terho Lehtimäki  43   45   46 Olli T Raitakari  64   65   66   67 Brenda W J H Penninx  42 Tonu Esko  41 Robin G Walters  29   33 J Wouter Jukema  32   68 Naveed Sattar  69 Mohsen Ghanbari  30 Ko Willems van Dijk  70   71   72 Fredrik Karpe  23   24 Mark I McCarthy  21   24   22 Markku Laakso  19   73 Marjo-Riitta Järvelin  7   13   74   75 Nicholas J Timpson  16   17 Markus Perola  15   76   77 Jaspal S Kooner  14   78   79   80 John C Chambers  13   14   78   79   81 Cornelia van Duijn  29 P Eline Slagboom  53 Dorret I Boomsma  37   38   82 John Danesh  4   8   9   11   12   83 Mika Ala-Korpela  6   7   84 Adam S Butterworth  4   8   9   11   12 Johannes Kettunen  6   7   15
Affiliations

Genome-wide characterization of circulating metabolic biomarkers

Minna K Karjalainen et al. Nature. 2024 Apr.

Abstract

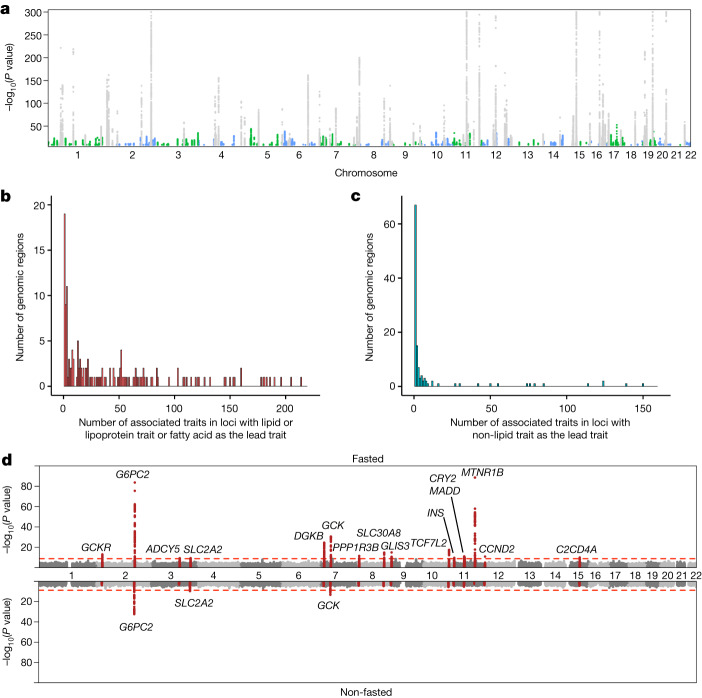
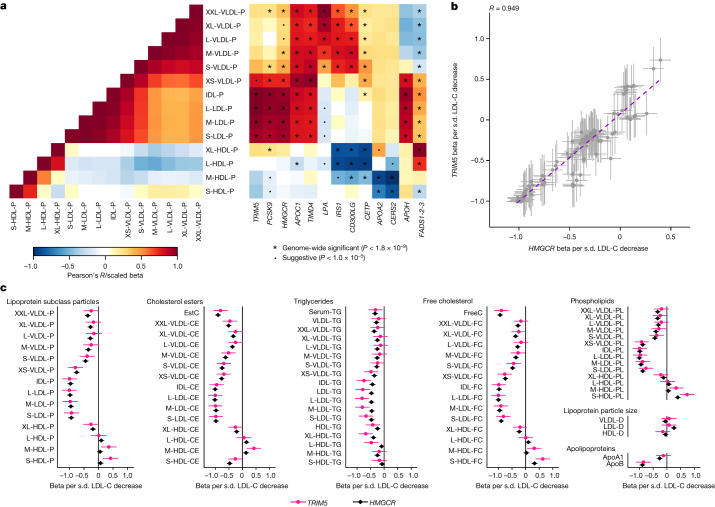
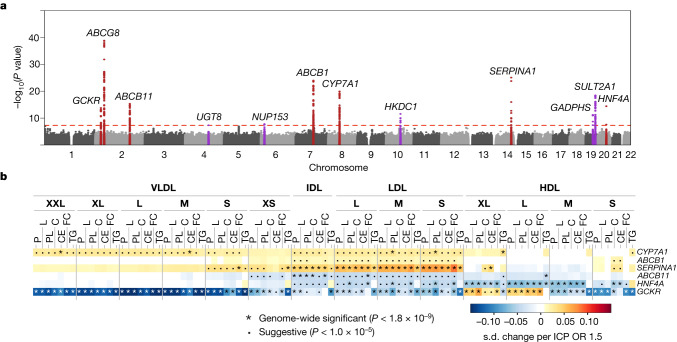
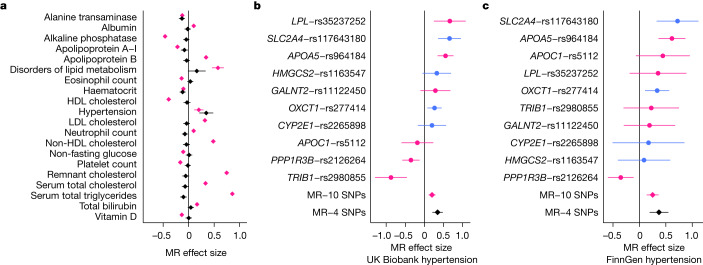
Genome-wide association analyses using high-throughput metabolomics platforms have led to novel insights into the biology of human metabolism1-7. This detailed knowledge of the genetic determinants of systemic metabolism has been pivotal for uncovering how genetic pathways influence biological mechanisms and complex diseases8-11. Here we present a genome-wide association study for 233 circulating metabolic traits quantified by nuclear magnetic resonance spectroscopy in up to 136,016 participants from 33 cohorts. We identify more than 400 independent loci and assign probable causal genes at two-thirds of these using manual curation of plausible biological candidates. We highlight the importance of sample and participant characteristics that can have significant effects on genetic associations. We use detailed metabolic profiling of lipoprotein- and lipid-associated variants to better characterize how known lipid loci and novel loci affect lipoprotein metabolism at a granular level. We demonstrate the translational utility of comprehensively phenotyped molecular data, characterizing the metabolic associations of intrahepatic cholestasis of pregnancy. Finally, we observe substantial genetic pleiotropy for multiple metabolic pathways and illustrate the importance of careful instrument selection in Mendelian randomization analysis, revealing a putative causal relationship between acetone and hypertension. Our publicly available results provide a foundational resource for the community to examine the role of metabolism across diverse diseases.


Conflict of interest statement

During the course of the project P.S. became a full-time employee of GlaxoSmithKline. V.S. has received an honorarium from Sanofi for consulting. V.S. also has an ongoing research collaboration with Bayer (outside the present study). A.M. is an employee of Genentech and a holder of Roche stock. N.v.Z. is currently employed by AstraZeneca PLC and is a shareholder in AstraZeneca. R.L.-G. is a part-time contractor of Metabolon Inc. During the course of the project J.Z. became a full-time employee of Novartis. A.I.d.H. is currently an employee of AbbVie. C.M. is funded by the Chronic Disease Research Foundation (CDRF). T.D.S. is co-founder and shareholder of ZOE Ltd. M.I.M. is an employee of Genentech and a holder of Roche stock. J.D. serves on scientific advisory boards for AstraZeneca, Novartis and UK Biobank, and has received multiple grants from academic, charitable and industry sources outside of the submitted work. A.S.B. reports institutional grants outside of this work from AstraZeneca, Bayer, Biogen, BioMarin, Bioverativ, Novartis, Regeneron and Sanofi. The other authors declare no competing interests.

Figures

Fig. 1
Fig. 1. Results of the GWAS meta-analysis of 233 metabolic traits.
a, Manhattan plot summarizing the metabolic trait associations from inverse variance-weighted GWAS meta-analysis. Loci that do not overlap with those identified in the previous large-scale NMR metabolomics GWAS, are shown in blue and green. Only genome-wide significant SNPs (two-sided P < 1.8 × 10−9) are shown and −log10(P values) were capped at 300. b,c, Numbers of associated metabolic traits at the 276 associated genomic regions are shown separately for genomic regions in which the lead trait was a lipid, lipoprotein or fatty acid trait (b; 155 loci; median 24 traits per locus) and for those in which the lead trait was a non-lipid trait (c; 121 loci; median one trait per locus). d, Results of the GWAS for glucose for the fasted (top; total n = 68,559) and non-fasted (bottom; total n = 58,112) cohorts. The red line indicates the threshold for genome-wide significance. The 500-kb regions around lead SNPs in the fasted cohorts are highlighted.
Fig. 2
Fig. 2. Effects of SNPs across lipoprotein and lipid traits.
a, Heat maps of the correlation structure of lipoprotein subclass particle concentrations (left) and the association landscapes of exemplar SNPs (right). In the heat maps, pairwise correlations of lipoprotein subclass particle concentrations (calculated in FINRISK 1997; left) and effect estimates for the SNP–metabolic trait associations (right) are represented as a colour range. The SNP effect sizes were scaled relative to the absolute maximum effect size in each locus. Each column represents a single SNP, and each row corresponds to a single metabolic measure. Two-sided tests were used. b,c, Scatter plot (b) and forest plots (c) of the effect estimates (betas and 95% confidence intervals) for TRIM5 and HMGCR lead SNPs (rs11601507 and rs12916, respectively; n = 136,016 individuals) across the lipoprotein and lipid traits. b, A best fit regression line (purple dashed line) and an estimate of Pearson’s correlation coefficient R (for betas of 116 SNP–trait pairs) are shown. The effect estimates (s.d. units) were scaled relative to a one-s.d. decrease in LDL cholesterol. VLDL, LDL, IDL and HDL are classified into different particle sizes (in order of decreasing size: XXL, XL, L, M, S and XS). Detailed descriptions of the metabolic traits and abbreviations are shown in Supplementary Table 2. ApoA1, apolipoprotein A1. Source Data
Fig. 3
Fig. 3. Metabolic trait-associated variants are associated with ICP.
a,b, Manhattan plot of the GWAS of intrahepatic cholestasis of pregnancy (ICP) (a) and heat map of loci associated with metabolic traits and ICP (b). Twelve loci were associated with ICP in the FinnGen study (1,460 cases, 172,286 controls). a, The 500-kb regions flanking the lead SNPs are highlighted, and the nearest gene is indicated for each signal. The ICP GWAS was performed with scalable and accurate implementation of generalized mixed model (SAIGE). Loci that overlap with the loci identified in the NMR meta-analysis are indicated in red. b, Loci that are likely to have shared causal variants with the metabolic traits are included. The heat map illustrates the resemblances of the association landscapes. Each row represents a single SNP, each column corresponds to a single metabolic measure, and the scaled effect estimates for the SNP–metabolite associations from inverse variance-weighted GWAS meta-analysis are represented as a colour range. The associations were scaled with respect to their associations with ICP (s.d. change per ICP odds ratio (OR) 1.5). Detailed descriptions of the metabolic traits and abbreviations are shown in Supplementary Table 2.
Fig. 4
Fig. 4. Mendelian randomization suggests a causal association between acetone and hypertension.
a, Effect estimates (betas per s.d. increase in acetone) from Mendelian randomization (MR) analysis performed under the inverse variance-weighted model are shown for the UK Biobank outcomes that were significant (P < 4.88 × 10−6) with the full (pleiotropic, n = 10 instrument SNPs, pink) or strict (non-pleiotropic, n = 4 instrument SNPs, black) set of instruments. Betas and P values are shown in Supplementary Table 15. b,c, Effect estimates (betas per s.d. increase in acetone) in Mendelian randomization analysis with hypertension as the outcome in the UK Biobank (b; 104,824 cases with hypertension, 367,542 controls) and FinnGen (c; 70,651 cases with hypertension, 223,663 controls) datasets. Single-SNP Mendelian randomization effect estimates and 95% confidence intervals are shown, with the SNPs in the strict instrument coloured blue and the other SNPs coloured pink. Mendelian randomization effect estimates are shown with pink and black diamonds for the full instrument (all ten SNPs) and strict instrument (four non-pleiotropic SNPs), respectively. Source Data
Extended Data Fig. 1
Extended Data Fig. 1. Comparisons of effect sizes across ancestries.
Scatter plots (lower left) show SNP effect sizes of the lead SNP – metabolic trait pairs within the 276 associated genomic regions across different ancestries (Europeans, n = 120,251; Finnish, n = 27,577; non-Finnish Europeans, n = 92,664; South Asians, n = 11,340; Han Chinese, n = 4,435; Africans, n = 1,405). Pearson correlation (Corr) values (r) from each comparison are shown (upper right). The diagonal squares show the number of the 8,795 associations that could be tested in each ancestry group (denominator) and the number that reached the traditional level of genome-wide significance (p < 5 ×10⁻⁸) (numerator).
Extended Data Fig. 2
Extended Data Fig. 2. Mirrored Manhattan plot showing the results of genome-wide association study of phenylalanine in the NMR GWAS meta-analysis and UK Biobank.
The top panel of the mirrored Manhattan plot shows the NMR inverse variance weighted GWAS meta-analysis results (n = 136,016) and the bottom panel the UKBB results (n = 115,025). The red lines indicate the thresholds for genome-wide significance (top panel p < 1.8 × 10⁻⁹; bottom panel p < 5 × 10⁻⁸). 500-kb regions around lead SNPs in the NMR GWAS are highlighted. Loci indicated in red have roles in coagulation-related pathways. Loci indicated in blue were genome-wide significant in both NMR GWAS meta-analysis and UK Biobank.
Extended Data Fig. 3
Extended Data Fig. 3. Examples of glucose associations for fasted and non-fasted cohorts.
The forest plots in panels a and b show examples of two lead SNPs in which glucose associations were significant in the fasted cohorts (top; n = 68,559) and non-significant in the non-fasted cohorts (bottom; n = 58,112). The associations were analyzed by inverse variance weighted GWAS meta-analysis. These associations were absent in the UK Biobank. Effect sizes (betas and 95% confidence intervals), effect allele frequencies (EAF) and p-values are indicated for each cohort. Cohort acronyms can be found in Supplementary Table 1. Panels c and d show regional association plots of the MTNR1B (c) and GLIS3 (d) loci in the fasted (left) and non-fasted (center) cohorts and in UK Biobank (right). SNPs with p < 0.1 are shown. 500-kb flanking regions around each lead SNP are shown. The linkage disequilibrium values (r2) are based on the 1000Genomes European population.
Extended Data Fig. 4
Extended Data Fig. 4. Heat map of lipoprotein and lipid associations.
Lipoprotein and lipid associated loci with similar association patterns across the lipoprotein measures were grouped together in a dendrogram based on hierarchical clustering of the SNP effects. The apolipoprotein B associated loci (n = 134, p < 0.05) were included since apolipoprotein B represents a causal part of the lipoprotein metabolism for cardiovascular disease. The heat map illustrates the resemblances of the association landscapes; each row represents a single SNP, each column corresponds to a single metabolic measure, and the scaled effect estimates from inverse variance weighted GWAS meta-analysis for the SNP-metabolite associations are visualized with a colour range. Effect sizes were scaled relative to the absolute maximum effect size (beta) in each locus. Loci that were not identified in the previous large-scale NMR metabolomics GWAS are indicated by red. Traits with absolute maximum effects in each locus are indicated by asterisks. For clarity, two of the clusters (brown and purple) are highlighted in Extended Data Fig. 5.
Extended Data Fig. 5
Extended Data Fig. 5. A zoomed heat map of lipoprotein and lipid associations.
The full heat map including all the loci and a full set of lipoprotein traits is shown in Extended Data Fig. 4. For clarity, two of the clusters are highlighted here. For details, see legend for Extended Data Fig. 4. Panels a and b corresponding to the brown and purple branches of the dendrogram shown in the full-sized heat map, respectively. Effect sizes were scaled relative to the absolute maximum effect size (beta) in each locus. In the heat map, each row represents a single SNP, each column corresponds to a single metabolic measure, and the effect estimates for the SNP-metabolite associations are visualized with a colour range. Loci highlighted in red were not identified in the previous NMR metabolomics GWAS.
Extended Data Fig. 6
Extended Data Fig. 6. Influence of pleiotropy on Mendelian randomization estimates.
The effect estimates (absolute betas) (panel a) and heterogeneity Q statistics (panel b) from the Mendelian randomization (MR) analyses using the full (pleiotropic) and strict (non-pleiotropic) MR instruments are shown. MR was performed using a fixed-effects inverse-variance weighted method. Associations that were significant (p < 4.88 × 10⁻⁶) using either the full or strict instrument or both were included; some of the significant exposure-outcome associations are indicated. Estimates indicated in light pink and light blue were not significant with the strict and full instruments, respectively. For clarity, very large beta (>5) and Q values (>60,000) were excluded from the plots.

References

    1. Suhre K, et al. Human metabolic individuality in biomedical and pharmaceutical research. Nature. 2011;477:54–60. doi: 10.1038/nature10354. - DOI - PMC - PubMed
    1. Kettunen J, et al. Genome-wide association study identifies multiple loci influencing human serum metabolite levels. Nat. Genet. 2012;44:269–276. doi: 10.1038/ng.1073. - DOI - PMC - PubMed
    1. Shin SY, et al. An atlas of genetic influences on human blood metabolites. Nat. Genet. 2014;46:543–550. doi: 10.1038/ng.2982. - DOI - PMC - PubMed
    1. Kettunen J, et al. Genome-wide study for circulating metabolites identifies 62 loci and reveals novel systemic effects of LPA. Nat. Commun. 2016;7:11122. doi: 10.1038/ncomms11122. - DOI - PMC - PubMed
    1. Gallois A, et al. A comprehensive study of metabolite genetics reveals strong pleiotropy and heterogeneity across time and context. Nat. Commun. 2019;10:4787–4788. doi: 10.1038/s41467-019-12703-7. - DOI - PMC - PubMed

MeSH terms