. 2024 Mar;627(8005):830-838.
doi: 10.1038/s41586-024-07144-2. Epub 2024 Mar 6.

A vagal reflex evoked by airway closure

Affiliations

A vagal reflex evoked by airway closure

Michael S Schappe et al. Nature. 2024 Mar.

Abstract

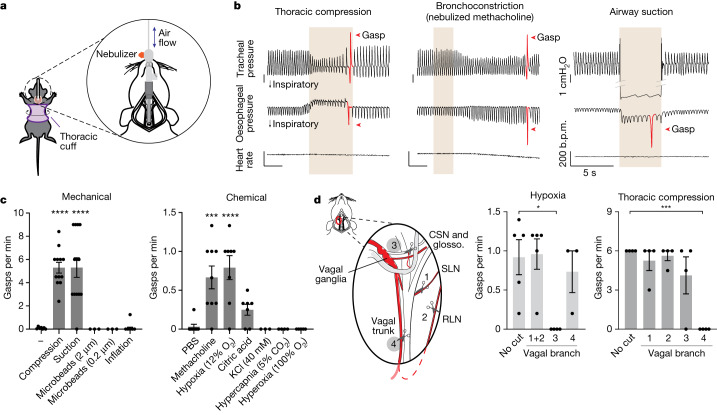
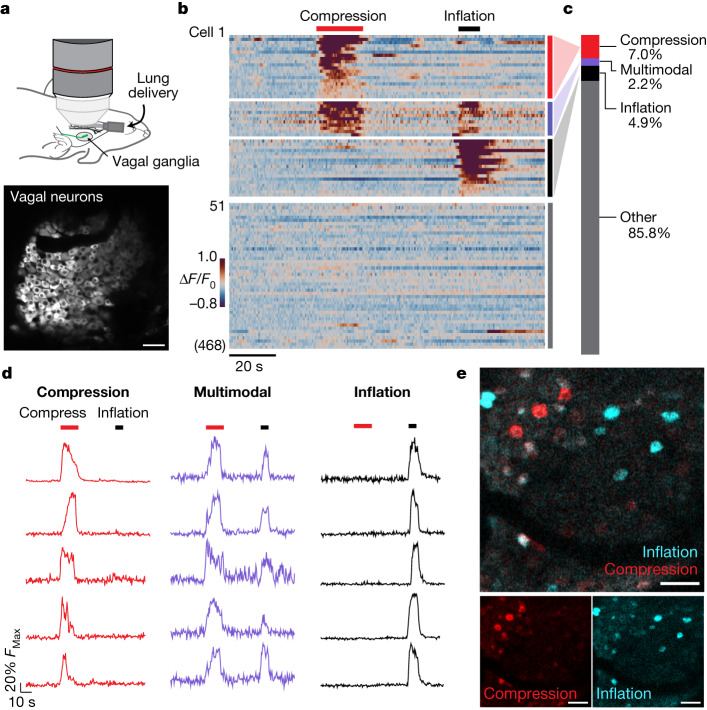
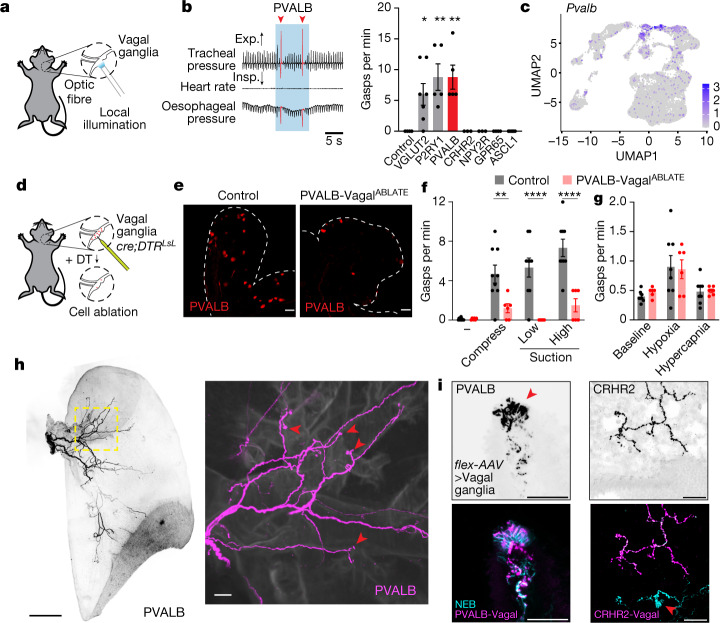
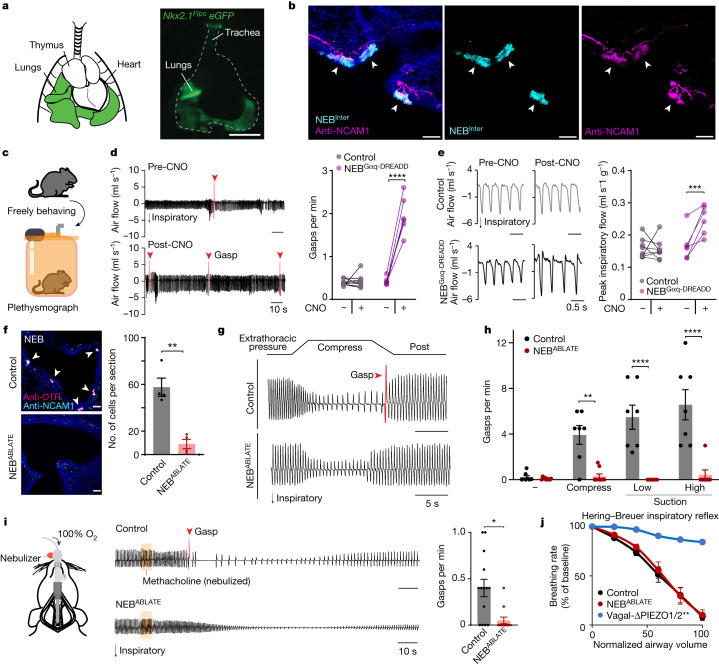
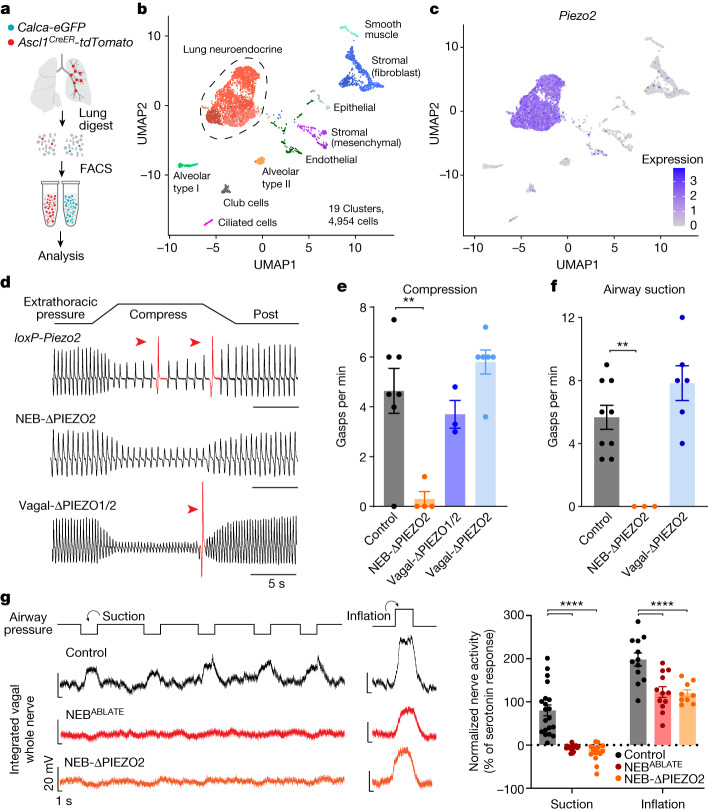
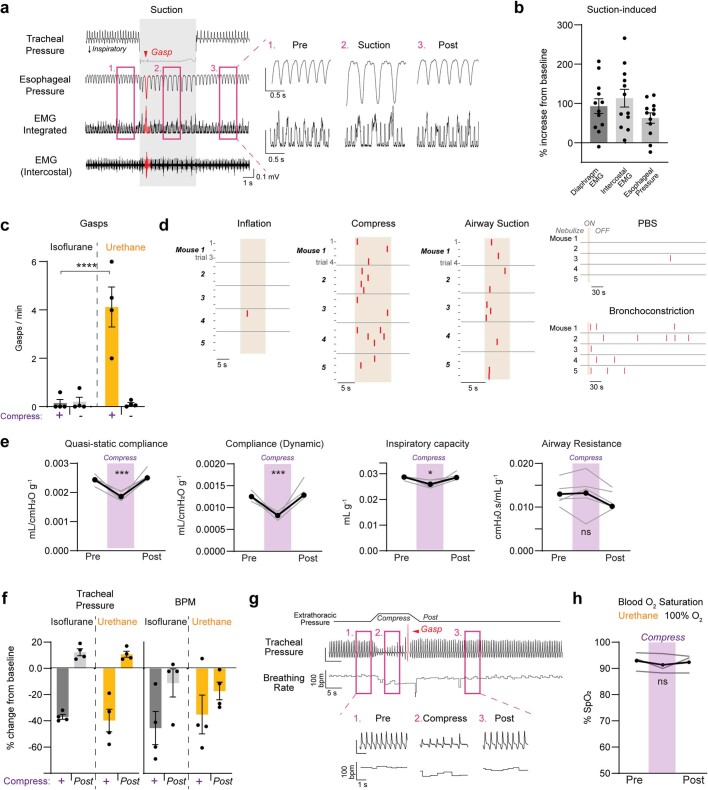
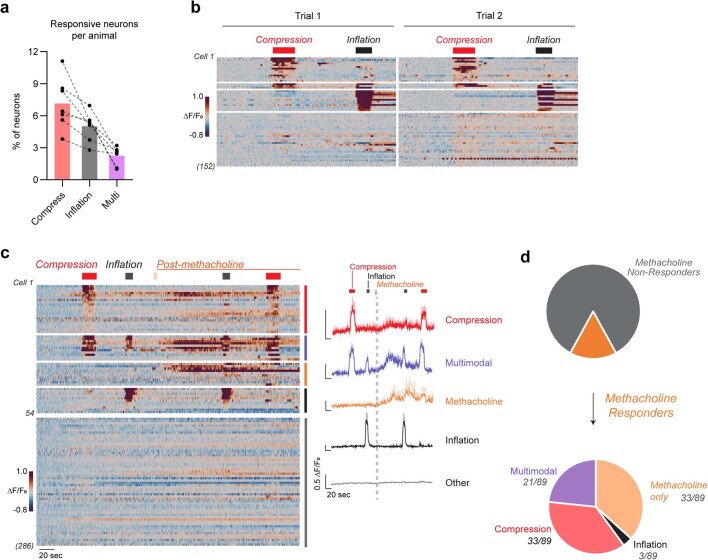
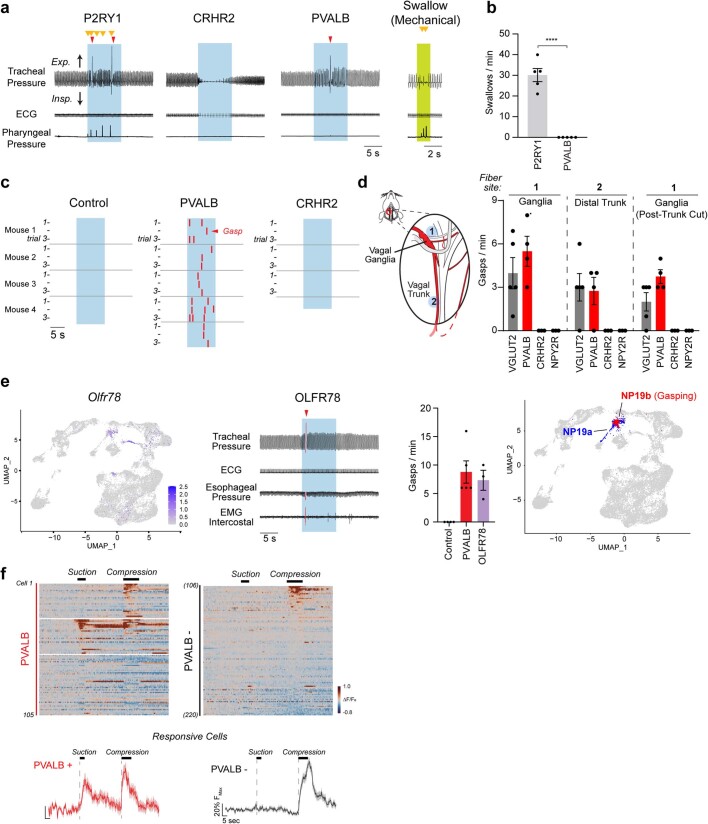
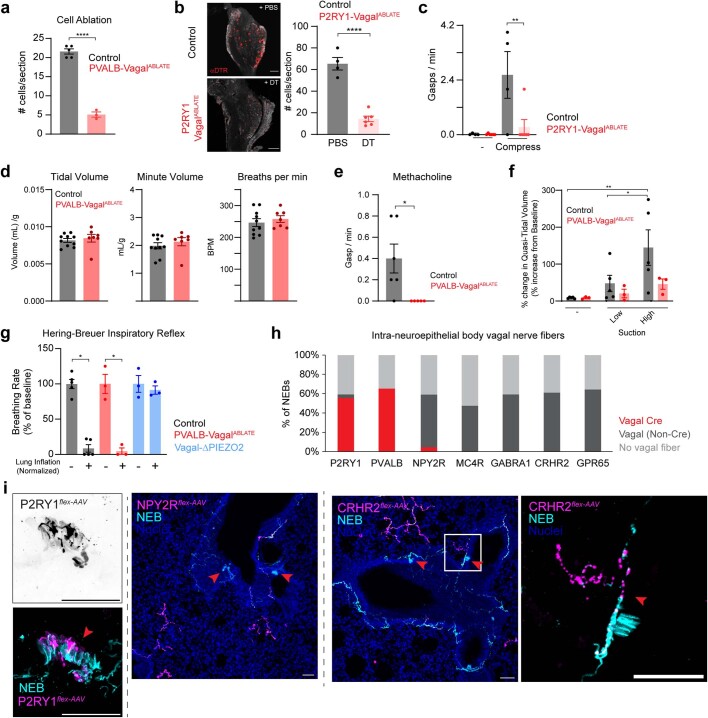
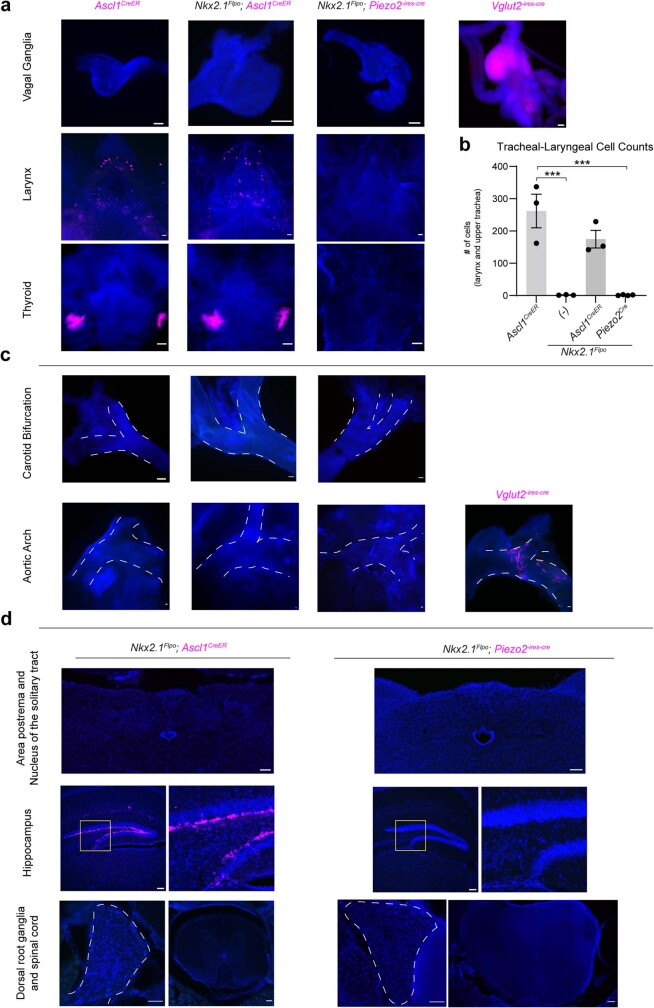
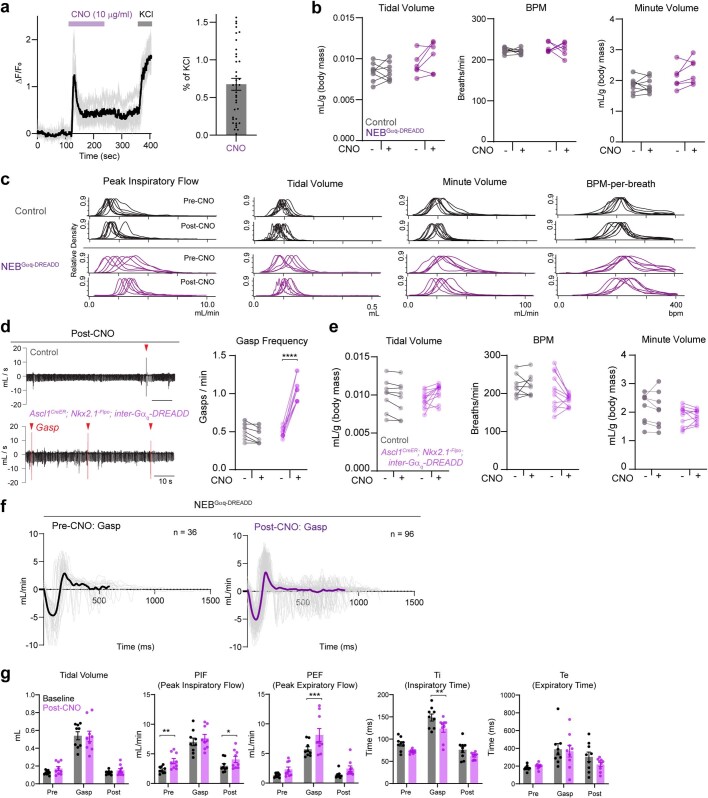
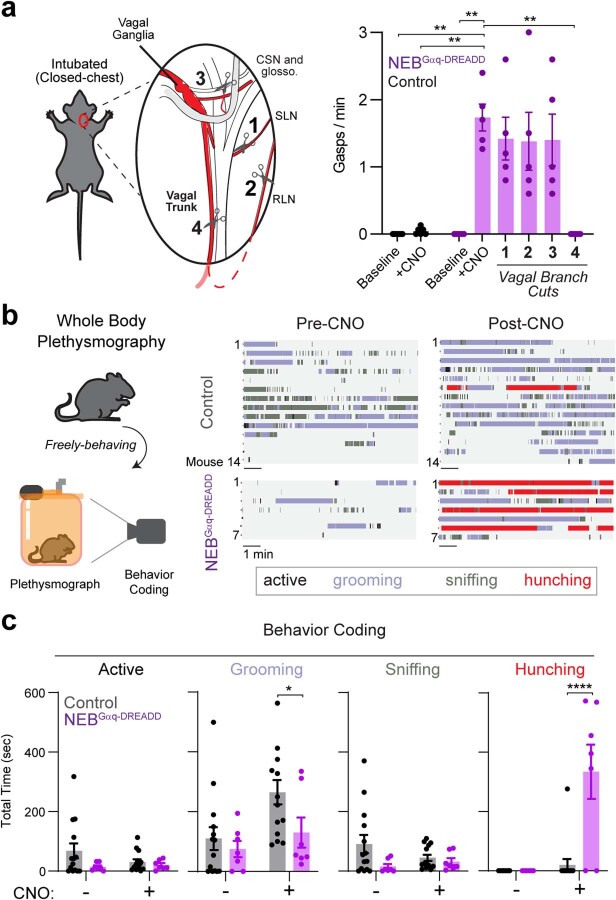
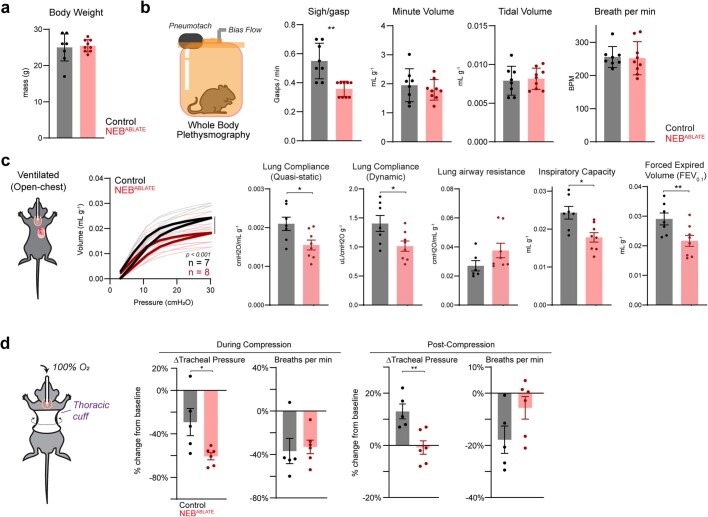
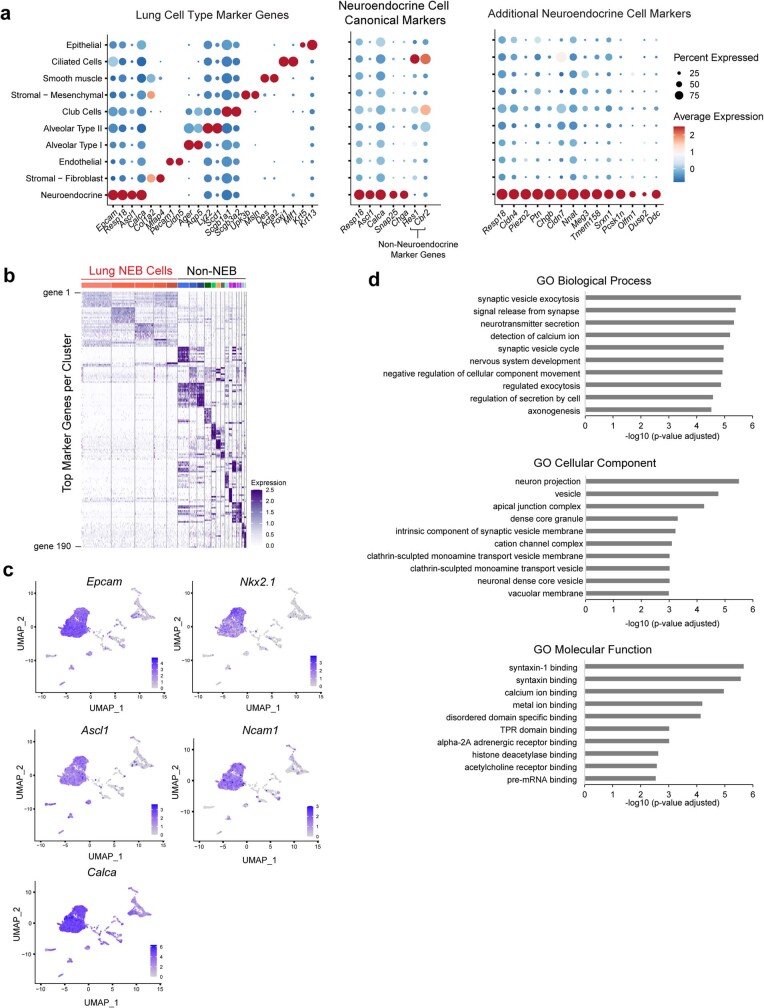
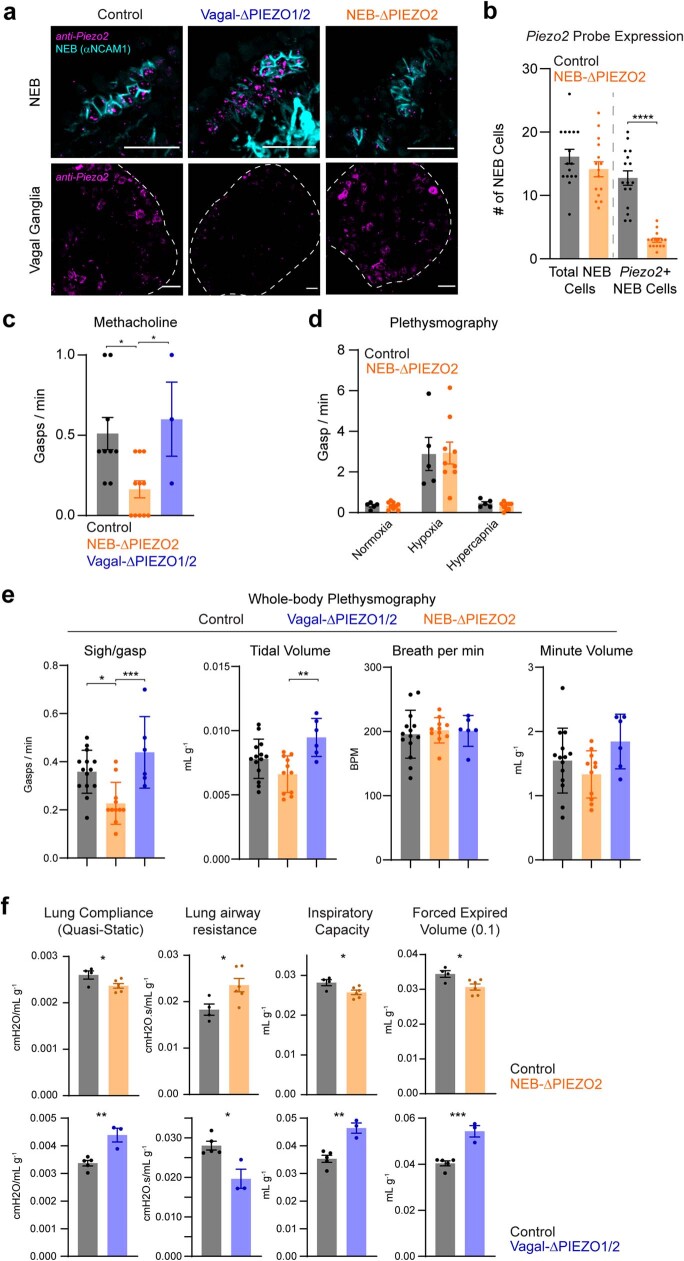
Airway integrity must be continuously maintained throughout life. Sensory neurons guard against airway obstruction and, on a moment-by-moment basis, enact vital reflexes to maintain respiratory function1,2. Decreased lung capacity is common and life-threatening across many respiratory diseases, and lung collapse can be acutely evoked by chest wall trauma, pneumothorax or airway compression. Here we characterize a neuronal reflex of the vagus nerve evoked by airway closure that leads to gasping. In vivo vagal ganglion imaging revealed dedicated sensory neurons that detect airway compression but not airway stretch. Vagal neurons expressing PVALB mediate airway closure responses and innervate clusters of lung epithelial cells called neuroepithelial bodies (NEBs). Stimulating NEBs or vagal PVALB neurons evoked gasping in the absence of airway threats, whereas ablating NEBs or vagal PVALB neurons eliminated gasping in response to airway closure. Single-cell RNA sequencing revealed that NEBs uniformly express the mechanoreceptor PIEZO2, and targeted knockout of Piezo2 in NEBs eliminated responses to airway closure. NEBs were dispensable for the Hering-Breuer inspiratory reflex, which indicated that discrete terminal structures detect airway closure and inflation. Similar to the involvement of Merkel cells in touch sensation3,4, NEBs are PIEZO2-expressing epithelial cells and, moreover, are crucial for an aspect of lung mechanosensation. These findings expand our understanding of neuronal diversity in the airways and reveal a dedicated vagal pathway that detects airway closure to help preserve respiratory function.


Conflict of interest statement

S.D.L. is a consultant for Kallyope. The remaining authors declare no competing interests.

Figures

Fig. 1
Fig. 1. A vagal gasping reflex to airway closure.
a, Cartoon depicting the application of airway challenges. b, Representative physiological measurements before, during and after airway closure (tan shading). b.p.m., beats per minute. c, Quantification of gasp frequency in response to the indicated stimuli. Data are mean ± s.e.m., with dots indicating the average per animal across three trials. n (left to right) = 7, 12, 13, 3, 3 and 6 (mechanical); 8, 9, 8, 7, 3, 4 and 5 (chemical). Significance determined by one-way analysis of variance (ANOVA) with Bonferroni post hoc test: mechanical, F5,38 = 15.61, P < 0.0001; – versus compression, P < 0.0001; – versus suction, P < 0.0001; chemical, F6,37 = 9.399, P < 0.0001, PBS versus methacholine, P = 0.0004; PBS versus hypoxia, P < 0.0001. d, Quantification of gasp frequency (right) to hypoxia (10% oxygen) or thoracic compression following transection of nerve branches as numbered in the cartoon (left). Data are mean ± s.e.m., with dots indicating the average per animal across three trials. n (left to right)  = 5, 5, 4 and 3 (hypoxia); 4, 4, 4, 4 and 4 (thoracic compression). One-way ANOVA with Bonferroni post hoc test: hypoxia, F3,13 = 5.030, P = 0.0157; no cut versus nerve branch 3, P = 0.0157; thoracic compression, F4,15 = 11.04, P = 0.0002, no cut versus nerve branch 4, P = 0.0002. CSN and glosso., glossopharyngeal nerve, including the carotid sinus nerve (CSN). Source data
Fig. 2
Fig. 2. Imaging neuronal responses to airway closure.
a, Cartoon depicting vagal ganglion imaging (top) and a two-photon image (bottom) of SALSA fluorescence in vagal ganglia of Vglut2-ires-cre;lsl-SALSA mice. b, Heatmap depicting vagal sensory neuron calcium responses (ΔF/F colour coded, 468 imaged neurons, 2 representative mice) to airway compression (red bar) and airway inflation (black bar). All 55 responsive and some randomly selected non-responsive neurons are shown. c, Quantification of neurons responsive to only compression (red, 91 out of 1,303 neurons), only inflation (black, 64 out of 1,303), both (purple, 29 out of 1,303) or neither (grey, 1,119 out of 1,303) across 1,303 neurons, 7 mice. d, Representative traces of ratiometric GCaMP6f fluorescence from individual vagal neurons responding to the indicated stimuli. e, Representative images of maximal GCaMP6f fluorescence in vagal ganglion neurons during airway compression (blue) and inflation (red). Scale bars, 50 μm (a,e). Source data
Fig. 3
Fig. 3. Vagal gasping neurons innervate NEBs.
a, Cartoon depicting vagal optogenetics. b, Representative physiological changes (left) and gasp quantification (right) from optogenetic stimulation (blue shading) of indicated vagal neurons. Exp., expiration; Insp., inspiration; red triangle, gasp. Data are mean ± s.e.m., with dots indicating the average per animal across three trials. n (left to right) = 4, 7, 5, 5, 3, 3, 4 and 6. One-way ANOVA (Bonferroni post hoc): F7,29 = 7.912, P < 0.0001; pairwise comparisons to control: VGLUT2, P = 0.0399; P2RY1, P = 0.0022; PVALB, P = 0.0022, others are not significant (NS). c, Uniform manifold approximation and projection (UMAP) plot from published single-cell transcriptome data of vagal and glossopharyngeal sensory ganglia indicating Pvalb expression (purple shading, natural log scale). d, Cartoon depicting targeted vagal neuron ablation. e, Representative image of native tdTomato fluorescence in vagal ganglia of Pvalb-t2a-cre;lsl-DTR;lsl-tdTomato mice with or without DT injection. f, Gasp frequency in PVALB-VagalABLATE mice or control Cre-negative DT-injected littermates. Dashed lines indicate vagal ganglia. Data are the mean ± s.e.m., with dots indicating the average responses of individual animals across 4 trials per mouse. n = 9 (control) and 6 (PVALB-VagalABLATE) mice. Two-way ANOVA (Bonferroni post hoc): condition × genotype F3,39 = 7.066, P = 0.0007; pairwise comparisons of control versus PVALB-VagalABLATE: –, NS; compress, P = 0.0066; low suction, P < 0.0001; high suction, P < 0.0001. g, Gasp frequency by whole-body plethysmography in PVALB-VagalABLATE mice or control Cre-negative DT-injected littermates. Data are the mean ± s.e.m., with dots indicating individual animals. n = 8 (control) and 6 (PVALB-VagalABLATE) mice. Two-way ANOVA (Bonferroni post hoc): condition × genotype F2,24 = 0.1435, P = 0.8671; pairwise comparisons: control versus PVALB-VagalABLATE: all NS. h, Representative low-magnification (left) and zoomed-in (right, yellow box) images of native tdTomato fluorescence in a iDisco-cleared lung from a Pvalb-t2a-cre;Vglut2-Flpo mouse containing a Cre-dependent and Flp-dependent tdTomato reporter (inter-Ai65). Red arrowheads indicate nerve terminals. i, Representative images of tdTomato (magenta) and NCAM1 (cyan) immunohistochemistry in lung from Pvalb-t2a-cre (left) and Crhr2-ires-cre (right) mice injected in vagal ganglia with AAV-flex-tdTomato. Red arrowheads indicate nerve terminals. Scale bars, 50 μm (i), 100 μm (e,h (right)) or 1 mm (h, left). Source data
Fig. 4
Fig. 4. NEBs mediate gasps.
a, Cartoon (left) and image of native thoracic reporter fluorescence (right). b, mCherry (cyan) and NCAM1 (magenta) immunochemistry in lung cryosections of NEBGαq-DREADD-mCherry mice. c, Cartoon of whole-body plethysmography. d, Pneumotachographs (left) and gasp quantification (right) in freely behaving NEBGαq-DREADD mice and Cre-negative control mice before and 10 min after CNO. Dots and lines indicate individual animals n = 8 (control) and 6 (NEBGαq-DREADD) mice. Two-way ANOVA (Bonferroni post hoc): condition (CNO) × genotype F1,12 = 88.38, P < 0.0001; adjusted P value (pre-CNO versus post-CNO): control, NS; NEBGαq-DREADD mice, P = 0.0001. e, Zoomed-in pneumotachographs (left) and peak inspiratory flow quantification (right) as in d. Same mice as d; two-way ANOVA (Bonferroni post hoc): condition (CNO) × genotype F1,12 = 11.43, P = 0.0055; adjusted P value (pre-CNO versus post-CNO): control, NS; NEBGαq-DREADD mice, P = 0.0022. f, NEBs visualized (left) and counted (right) in lung cryosections from NEBABLATE mice and control Cre-negative DT-injected littermates. Data are the mean ± s.e.m., with dots indicating the averages per animal across four sections. n = 4 mice per group. Unpaired t-test, P = 0.0014. g, Representative tracheal pressure traces. h, Gasp frequency. Data are the mean ± s.e.m., with dots indicating the average of 3–4 trials per animal. n = 7 mice per group. Two-way ANOVA (Bonferroni post hoc): condition × genotype F3,36 = 11.75, P < 0.0001; pairwise comparisons (control versus NEBABLATE, left to right): NS, P = 0.0028, P < 0.0001, P < 0.0001. i, Cartoon (left), representative tracheal pressure traces (middle) and gasp quantification (right) 5 min after methacholine exposure (orange bar). Data are the mean ± s.e.m., with dots indicating individual animals. n = 14 (control) and 12 (NEBABLATE) mice. Unpaired t-test, P = 0.003. j, Breathing rates following lung inflation to assess the Hering–Breuer inspiratory reflex. Data are the mean ± s.e.m. n = 9 (control), 7 (NEBABLATE) and 3 (Vagal-ΔPIEZO1/2) animals. Two-way ANOVA (Bonferroni post hoc): condition (normalized airway volume) × genotype F10,80 = 7.464, P < 0.0001; all pairwise comparisons after inflation (control versus NEBABLATE), NS; all pairwise comparisons (control versus Vagal-ΔPIEZO2), **P < 0.0031. Scale bars, 25 μm (f), 50 μm (b) or 5 mm (a). Source data
Fig. 5
Fig. 5. Airway closure responses require PIEZO2 in NEBs.
a, Cartoon depicting NEB isolation strategy. b, UMAP plot indicating cell types from single-cell RNA sequencing data. c, UMAP plot of Piezo2 expression (purple shading, natural log scale) in single-cell transcriptome data from b. d,e, Representative traces of tracheal pressure (d) and quantification (e) of compression-evoked gasps in the indicated mice. Data are the mean ± s.e.m., with dots indicating individual animals. n = 7 (control), 4 (NEB-ΔPIEZO2), 3 (Vagal-ΔPIEZO1/2) and 6 (Vagal-ΔPIEZO2) mice. One-way ANOVA with Bonferroni post hoc test: condition (compress) × genotype F3,16 = 9.424, P = 0.0008; control versus NEB-ΔPIEZO2, P = 0.0021; all other pairwise comparisons to control, NS. f, Quantification of suction-evoked gasps in the indicated mice. Data are the mean ± s.e.m., with dots indicating individual animals. n = 9 (control), 3 (NEB-ΔPIEZO2) and 6 (Vagal-ΔPIEZO2) mice. One-way ANOVA with Bonferroni post hoc test: condition (compress) × genotype F2,15 = 11.76, P = 0.0008; control versus NEB-ΔPIEZO2, P = 0.0063; all other pairwise comparisons to control, NS. g, Representative recordings (left) and quantification (right) of vagal nerve activity during airway suction (low) or inflation. Data are the mean ± s.e.m., with dots indicating individual trials. n = 5 suction trials, 3 inflation trials per mouse from 4 control, 4 NEBABLATE, and 3 NEB-ΔPIEZO2 mice. Two-way ANOVA with Bonferroni post hoc test (genotype): F2, 82 = 44.42, P < 0.0001; control versus NEBABLATE or NEB-ΔPIEZO2, P < 0.0001; all other pairwise comparisons, NS. Source data
Extended Data Fig. 1
Extended Data Fig. 1. Respiratory measurements of airway closure.
a, Representative physiological measurements before, during and after suction (grey shading) with magnifications (right) depicting data from magenta boxes, red: gasps. b, Quantification of physiological changes induced by airway suction (low), expressed as a percentage increase per breath from baseline (n = 12 trials from 3 animals), mean ± sem, dots: individual trials, one-way ANOVA with Bonferroni post hoc test: Treatment x Measure F(1.57,17.32) = 2.753, ns. c, Quantification of gasp frequency with or without thoracic compression, mean ± sem, dots: average per animal across at least three trials, n = 4 animals per group, two-way ANOVA with Bonferroni post hoc test: Anesthesia x Condition F(1,8) = 37.19, p = 0.0003; multiple comparisons (Isoflurane versus Urethane): (−), ns; (+), p < 0.0001. d, Raster plots indicating gasps (red stripe) before, during (beige shading), and after stimuli indicated, 1-4 trials per each of 5 mice. e, Respiratory measurements before, during and after thoracic compression (purple shading) measured in ventilated mice, black: mean, grey: individual animals, (n = 5 mice, one-way ANOVA with Bonferroni post hoc test: Inspiratory Capacity, F(1.2, 4.9) = 10.12, p = 0.0229; Airway Resistance, F(1.1, 4.5) = 1.21, p = 0.3377; Quasi-static Compliance, F(1.5, 6.0) = 31.02, p = 0.0009; Dynamic compliance, F(1.4, 5.6) = 35.01, p = 0.0009). f, Quantification of physiological measurements during (+) and 10 sec following thoracic compression (Post) under isoflurane (grey) or urethane (yellow) anesthesia in freely breathing mice, mean ± sem, dots: average per animal across at least three trials, n = 4 mice per group, two-way ANOVA with Bonferroni post hoc test (Isoflurane versus Urethane, pairwise comparisons non-significant). g, Representative physiological measurements before, during and after airway compression magnifications below depicting data from magenta boxes, red arrow: gasps. h, Pulse oximetry measurements before, during and after thoracic compression (purple shading) measured in freely-breathing urethane anesthetized mice, black: mean, grey: individual animals, n = 3 mice, one-way ANOVA with Bonferroni post hoc test: Condition F(1.01, 2.02) = 1.010, p = 0.4211, all pairwise comparisons non-significant; ns: non-significant. Source data
Extended Data Fig. 2
Extended Data Fig. 2. Imaging vagal responses to airway stimuli.
a, Quantification of neurons responsive to compression only, inflation only, or both, data from individual mice (dots, n = 7) are connected (dashed lines), bar: mean. b, Heat map depicting calcium responses in vagal sensory neurons (ΔF/F color coded) to airway compression (red bar) and airway inflation (black bar) across multiple trials; 152 neurons were imaged, all responsive and only some randomly selected non-responsive neurons are shown. c, Heat map (left) depicting vagal sensory neuron calcium responses (ΔF/F color coded) to airway compression (red bar), airway inflation (black bar), and nebulized methacholine (orange bar); 286 neurons were imaged, all responsive and only some randomly selected non-responsive neurons are shown. Average neuron response (right) of indicated type to stimuli depicted; dark line: mean, light line: SEM, dotted line: time of methacholine administration. d, Proportion of neurons responsive to nebulized methacholine (orange slice, 89/468 neurons, 2 mice) and distribution of methacholine-responsive neurons activated by compression and/or inflation. Source data
Extended Data Fig. 3
Extended Data Fig. 3. Physiological responses to optogenetic stimulation of various vagal sensory neuron types.
a, Representative physiological measurements before, during and after optogenetic stimulation (blue shading, ganglion illumination after cutting of vagal trunk) of vagal P2RY1, CRHR2, and PVALB neurons or, for comparison, after mechanically-evoked swallow (green shading), Exp: expiratory phase; Insp: inspiratory phase, red triangle: gasp, yellow triangle: swallow. b, Quantification of swallows evoked from optogenetic stimulation of indicated vagal neurons, mean ± sem, dots: average per animal across at least three trials, n = 5 mice per group; unpaired t test, p < 0.0001. c, Raster plots indicating gasps (red stripe) before, during (blue shading), and after optogenetic stimulation of vagal neurons indicated, 3 trials per each of 3-5 mice. d, Quantification of gasp frequency (right) to optogenetic stimulation of vagal ganglia and trunk as numbered in the cartoon (left), mean ± sem, dots: average per animal across at least three trials, n = 5 VGLUT2, 4 PVALB, 3 CRHR2, 3 NPY2R. e, (left) UMAP plot of Olfr78 expression in vagal sensory neurons based on published transcriptomic data; (center-left) Representative physiological measurements before, during and after optogenetic stimulation as described in a; (center-right) Quantification of gasps evoked in indicated animals, PVALB data reproduced from Fig. 3b, mean ± sem, dots: average per animal across at least three trials, n = 4 Control, 5 PVALB, 3 OLFR78 mice; (right) UMAP plot indicating subtypes of NP19 neurons that express Pvalb and mediate gasping (red dots) or do not (blue dots). f, Heat map (top) depicting vagal sensory neuron calcium responses (ΔF/F color coded) in Snap25-GCamp6s; lsl-TdTomato; Pvalb-t2a-cre mice to airway suction (high) and compression in tdTomato-positive (left) or tdTomato-negative neurons, 105 tdTomato-positive and 390 tdTomato-negative neurons were imaged, all responsive and only some randomly selected non-responsive neurons are shown; average ΔF/F traces of all responsive neurons (bottom, 57 PVALB-positive, 46 PVALB-negative neurons) to indicated stimuli, dark line: mean, light line: SEM, dotted line: stimulus onset. Source data
Extended Data Fig. 4
Extended Data Fig. 4. Manipulation and visualization of vagal neuron types.
a, Quantification of PVALB neurons in vagal ganglia of mice indicated, mean ± sem, dots: individual animals with cell counts averaged across at least 3 cryosections per animal, n = 5 Control, 3 PVALB-VagalABLATE mice; unpaired t test, p < 0.0001. b, Representative image (left) of DTR immunostaining in vagal ganglia of P2ry1-ires-Cre; lsl-DTR mice after vagal injection with PBS (Control) or DT (P2RY1-VagalABLATE), scale bar: 100 μm. Quantification of P2RY1 vagal neuron ablation (right), mean ± sem, dots: individual animals with cell counts averaged across at least 3 cryosections per animal, n = 4 Control, 6 P2RY1-VagalABLATE- mice; unpaired t test, p < 0.0001. c, Quantification of gasp frequency in response to thoracic compression in P2RY1-VagalABLATE mice or control littermate mice from b, n = 4 Control, 6 P2RY1-VagalABLATE- mice; mean ± sem, dots: average responses of individual animals across at least 3 trials per mouse, two-way ANOVA with Bonferroni post hoc test: Condition x Ablation F(1,8) = 6.319, p = 0.0362; Control versus P2RY1-VagalABLATE: (−), non-significant; Compress, p = 0.0054. d, Quantification of breathing measurements by whole body plethysmography in mice described in panel a; mean ± sem, dots: individual animals (n = 10 Control, 7 PVALB-VagalABLATE, unpaired t test: all ns). e, Quantification of gasps following nebulized methacholine delivery in urethane-anesthetized mice, mean ± sem, dots: individual animals, n = 6 Control, 5 PVALB-VagalABLATE; unpaired t-test: p = 0.0266. f, Quantification of quasi-tidal volume measured by esophageal pressure at baseline (-), low suction (-5 cmH2O) or high airway suction (-10 cmH2O) in urethane-anesthetized PVALB-VagalABLATE mice or control DT-injected littermates lacking Cre; mean ± sem, dots: average responses of individual animals across 4 trials per mouse, n: 5 Control, 3 PVALB-VagalABLATE mice; two way ANOVA with Bonferroni post hoc test; Condition x Genotype F(2, 12) = 2.088, p = 0.1667; pairwise comparison (−) versus High suction (Control), p = 0.0024; low suction versus high suction (Control), p = 0.0240; other pairwise comparisons, ns. g, Assessment of the Hering-Breuer inspiratory reflex by measuring breathing rate at increased lung volumes (air flow/g body weight); mean ± sem, n = 5 control, 3 PVALB-VagalABLATE, 3 Vagal-ΔPiezo2 (Phox2b-cre; loxP-Piezo2) animals; two-way ANOVA with Bonferroni post hoc test: Genotype, F(2,8) = 25.75, p = 0.0003,; pairwise comparisons (Baseline versus Inflation, left to right): p = 0.0001, 0.0005, ns. h, Quantification of NEBs (visualized by NCAM1 staining) co-localized with nerve fibers labeled by immunohistochemistry for tdTomato and GFP after injection of AAVs containing a Cre-dependent tdTomato allele and a Cre-independent Gfp allele into vagal ganglia of Cre lines indicated. NEBs analyzed (left-to-right): 27, 25, 22, 21, 27, 36, and 14 from at least 3 lung sections derived from at least 2 mice per group. i, Representative images of cryosections from h depicting immunohistochemistry for TdTomato (magenta) and anti-NCAM1 (cyan); CRHR2 depicts alternate wideview of Fig. 3i image and additional ROI (white box); red arrows: NEBs, scale bars: 50 μm. Source data
Extended Data Fig. 5
Extended Data Fig. 5. Validating intersectional genetic tools to access NEBs.
a, Representative widefield images of native reporter fluorescence (magenta) of wholemount tissue from Ascl1-CreER;; lsl-TdTomato mice (left), Ascl1-CreER; Nkx2.1-Flpo: inter-Gαq-DREADD-mCherry, mice (second from left), NEBGαq-DREADD-mCherry mice (third from left), and Vglut2-ires-cre; lsl-TdTomato mice (right), images representative of tissue collected from at least 4 animals per genotype, scale bars: 100 μm (vagal ganglia and larynx) and 500 μm (thyroid). b, Quantification of tracheal-laryngeal cells labeled by indicated mouse lines described in a; mean ± sem, dots: individual animal, n = 3 per indicated genotype, 4 NEBGαq-DREADD-mCherry; one-way ANOVA with Bonferroni post hoc test: F(3,9) = 23.63, p = 0.0001, pairwise comparisons (left to right versus Ascl1-CreER): p = 0.0003; ns, p = 0.0002.c, Representative widefield images of native reporter fluorescence (magenta) in indicated tissues from mice described in a. Dotted line indicates blood vessel, scale bar: 100 μm. d, Representative widefield images of native reporter fluorescence (magenta) in indicated tissues from mice described in a. In middle panels, the yellow box depicts site of image on right. In lower panels, the dotted line demarks the dorsal root ganglia (left), spinal cord (right), scale bars: 100 μm. Source data
Extended Data Fig. 6
Extended Data Fig. 6. Breathing changes following NEB activation.
a, (left) Calcium responses (ΔF/F0) of individual NEB cells in ex vivo lung slices from Ascl1-CreER; lsl-SALSA; lsl-Gαq-DREADD mice, dark line: mean, grey lines: individual cells, n = 12 cells from 3 mice; (right) Quantification of CNO-evoked calcium responses normalized to KCl (40 mM) responses, mean ± sem, dots: individual cells, n = 37 cells from 3 mice. b, Quantification of whole body plethysmography measurements in NEBGαq-DREADD mice and littermate controls lacking Cre before and for 10 min after CNO administration, dots: individual animals, lines: differences per animal across conditions, n = 8 control, 6 NEBGαq-DREADDmice; two-way ANOVA with Bonferroni post hoc test: Condition (CNO) x Genotype (Tidal Volume, BPM (breaths per minute), and Minute Volume, respectively) F(1,12) = 2.498, 0.010, 2.531; p value all non-significant (ns). c, Histogram of individual breath measurements before and after CNO administration; lines: distribution of per breath measurements across one animal, n = 7 Control, 6 NEBGαq-DREADD. d, Pneumotachographs of airflow in freely behaving Ascl1-CreER; Nkx2.1-Flpo; inter-Gαq-DREADD mice (left) before and 10 min after CNO administration (3 mg/kg, IP), red arrows: gasps. Quantification of gasp frequency (right) in Ascl1-CreER; Nkx2.1-Flpo; inter-Gαq-DREADD mice and littermate controls before and over 20 min after CNO administration, dots: individual animals, lines: differences per animal across conditions, n = 8 control, 11 Ascl1-CreER; Nkx2.1-Flpo; inter-Gαq-DREADD mice; two-way ANOVA with Bonferroni post hoc test: Condition x Genotype F(1,17 = 144.1, p < 0.0001; pairwise test (Pre-CNO versus Post-CNO): control, ns; Ascl1-CreER; Nkx2.1-Flpo; inter-Gαq-DREADD mice, p < 0.0001. e, Quantification of breathing parameters in mice from d, two-way ANOVA with Bonferroni post hoc test: Condition x Genotype (Tidal Volume, BPM, and Minute Volume, respectively) F(1,17) = 10.96, 3.066, 0.2292; p = 0.0041, ns, ns; pairwise comparisons for Tidal Volume: Control, ns; Ascl1-CreER; Nkx2.1-Flpo; inter-Gαq-DREADD mice, p = 0.0038. f, Mean pneumotachographs of gasps in NEBGαq-DREADD mice before CNO (left) and 10 min after CNO (right) during whole body plethysmography; dark trace: mean, grey trace: individual breaths (n = 36 breaths pre-CNO, 96 breaths post-CNO from 5 mice). g, Quantifying kinematics of spontaneous gasps and CNO-induced gasps in NEBGαq-DREADDmice, as well as the preceding and subsequent breaths; mean ± sem, dots: individual breaths (n = 9 paired breaths in each condition from 3 mice; two-way ANOVA with Bonferroni post hoc test: Time (Pre, Gasp, Post) x Treatment (CNO): F(2,16)=ns for all measures; significant pairwise tests (Baseline versus Post-CNO), left to right: p = 0.0020, 0.0259, 0.0001, 0.0058). Source data
Extended Data Fig. 7
Extended Data Fig. 7. Behavioral and physiological responses to NEB activation.
a, Quantification (right) of gasp frequency in urethane-anesthetized NEBGαq-DREADD mice and littermate controls before and after CNO (IP) and serial transection of nerve branches as numbered in the cartoon (left); mean ± sem, dots: individual animals, n = 6 Control, 5 NEBGαq-DREADD mice; one-way ANOVA with Bonferroni post hoc test: F(1.18,4.86) = 17.98; pairwise comparisons to NEBGαq-DREADD (+CNO): Control (baseline), p = 0.0058; Control (+CNO), p = 0.0072; NEBGαq-DREADD (baseline), p = 0.0069; Cut 4, p = 0.0069; all other comparisons, ns). b, (left) Cartoon of plethysmography with simultaneous video recording; (right) Ethograms from NEBGαq-DREADD mice and littermate controls before and after CNO administration, n = 14 control, 7 NEBGαq-DREADD mice; row: individual animal. c, Quantification of behavior from animals in b, dots: individual animals, bars: mean ± sem, two-way ANOVA: Treatment x Genotype (Active, Grooming, Sniffing, Hunching, respectively) F(1, 19) = ns, ns, ns, 20.61; pairwise comparisons (Control vs. NEBGαq-DREADD) for Grooming, p = 0.0392; Hunching, p < 0.0001. Source data
Extended Data Fig. 8
Extended Data Fig. 8. Physiological measurements after NEB ablation.
a, Quantification of body weight in NEBABLATE (red) and littermate control mice without Cre expression (gray); mean ± sem, dots: individual animals, n = 7 Control, 9 NEBABLATE; unpaired t test, ns. b, Quantification (right) of breathing measurements by whole body plethysmography (cartoon, left) in mice in NEBABLATE (red) and littermate controls (gray); mean ± sem, dots: individual animals, n = 8 Control, 9 NEBABLATE mean ± sem, unpaired t test (left-to-right): p = 0.002, ns, ns, ns. c, Quantification of respiratory mechanics (right) and pressure-volume loop test (middle) performed in ventilated (cartoon, left) control and NEBABLATE mice; n (left to right) = 7, 7, 6, 7, 7 (Control), all 8 (NEBABLATE) mice, (middle) thick line: mean, thin lines: individual animals, Mann-Whitney test: p < 0.0001; (right) mean ± sem, dots: individual animals, unpaired t test (left-to-right): p = 0.0218, 0.029, ns, 0.0073, 0.0182. d, Quantification of physiological measurements during and post (10 sec following) thoracic compression (cartoon, left) in freely breathing mice; n = 5 Control, 6 NEBABLATE mice; mean ± sem, dots: average of three trials per animal, unpaired t test, left-to-right: p = 0.0265, ns, 0.0057, 0.1029. Source data
Extended Data Fig. 9
Extended Data Fig. 9. Single-cell transcriptomes of NEBs.
a, Dot plots of lung cell type marker genes and neuroendocrine cell-enriched genes reported previously,,, or identified here by differential expression analysis. b, Heat map of top differentially expressed genes across cell types in Fig. 5b. c, UMAP of lung epithelial and NEB-enriched genes (scale: natural log). d, Gene ontology (GO) terms of top 50 genes enriched in NEBs; adjusted p-values are computed by the Benjamini-Hochberg method for correction for multiple hypothesis testing using Enrichr. Source data
Extended Data Fig. 10
Extended Data Fig. 10. Breathing changes in cell-specific PIEZO knockout mice.
a, Representative images of Piezo2 RNA in situ hybridization (magenta) in NEBs and vagal ganglia, NEBs visualized by NCAM immunochemistry (cyan), scale bar: 50 μm. b, Number of total NEB cells (NCAM1 immunoreactivity) and Piezo2-expressing NEB cells from mice in a, mean ± sem, dots: individual sections, n = 16 sections from 2 Control mice, 15 sections from 3 NEB-ΔPIEZO2 mice, one-way ANOVA with Bonferroni post hoc test: Piezo2 NEB-ΔPIEZO2 vs. all comparisons, p < 0.0001; all other comparisons, ns. c, Quantification of gasps following nebulized methacholine delivery in urethane-anesthetized mice, mean ± sem, dots: individual animals, n = 9 Control, 11 NEB-ΔPIEZO2, 3 Vagal-ΔPIEZO1/2, one-way ANOVA with Tukey post hoc test: F(2, 20) = 5.923, p = 0.0095; pairwise comparisons: Control versus NEB-ΔPIEZO2, p = 0.0198; Vagal-ΔPIEZO1/2 versus NEB-ΔPIEZO2, p = 0.0457; all other pairwise comparisons, ns. d, Quantification of gasps by whole body plethysmography during normoxia (21% O2), hypoxia (12% O2), and hypercapnia (5% CO2) (7 min), mean ± sem, dots: individual animals, n = 5 control, 9 NEB-ΔPIEZO2, two-way ANOVA with Bonferroni post hoc test: Condition x Genotype F(2, 24) = 0.02893, p = 0.9715; Control versus NEB-ΔPIEZO2, all pairwise comparisons, ns. e, Quantification (right) of breathing measurements made by whole body plethysmography (cartoon, left), mean ± sem, dots: individual animals, n = 14 Control, 11 NEB-ΔPIEZO2, 6 Vagal-ΔPIEZO1/2, one-way ANOVA with Bonferroni post hoc test: Gasps, F(2, 28) = 9.9558, p = 0.0007, Control versus NEB-ΔPIEZO2, p = 0.0104, Vagal-ΔPIEZO1/2 versus NEB-ΔPIEZO2, p = 0.0010; Tidal Volume, F(2, 28) = 7.263, p = 0.0029, Vagal-ΔPIEZO1/2 versus NEB-ΔPIEZO2, p = 0.002; all other ANOVA results and pairwise comparisons, ns. f, Quantification of respiratory mechanics performed in NEB-ΔPIEZO2 (top, orange, n = 6), Vagal-ΔPIEZO1/2 (bottom, blue, n = 3) mice and control littermates without Cre expression (grey, n = 4 left, 5 right), mean ± sem, dots: individual animals, unpaired t test, NEB-ΔPIEZO2 left-to-right: p = 0.0384, p = 0.0314, p = 0.0285, p = 0.0223; Vagal-ΔPIEZO1/2: p = 0.0040, p = 0.0106, p = 0.0022, p = 0.0010. Source data

Similar articles

Cited by

References

    1. Coleridge, H. M. & Coleridge, J. C. G. in Comprehensive Physiology (ed. Terjung, R.) 395–429 (Wiley, 2011).
    1. Mazzone SB, Undem BJ. Vagal afferent innervation of the airways in health and disease. Physiol. Rev. 2016;96:975–1024. doi: 10.1152/physrev.00039.2015. - DOI - PMC - PubMed
    1. Maksimovic S, et al. Epidermal Merkel cells are mechanosensory cells that tune mammalian touch receptors. Nature. 2014;509:617–621. doi: 10.1038/nature13250. - DOI - PMC - PubMed
    1. Woo SH, et al. Piezo2 is required for Merkel-cell mechanotransduction. Nature. 2014;509:622–626. doi: 10.1038/nature13251. - DOI - PMC - PubMed
    1. Prescott SL, Liberles SD. Internal senses of the vagus nerve. Neuron. 2022;110:579–599. doi: 10.1016/j.neuron.2021.12.020. - DOI - PMC - PubMed

LinkOut - more resources