. 2024 Mar;627(8005):905-914.
doi: 10.1038/s41586-024-07150-4. Epub 2024 Mar 6.

The structure and physical properties of a packaged bacteriophage particle

Affiliations

The structure and physical properties of a packaged bacteriophage particle

Kush Coshic et al. Nature. 2024 Mar.

Abstract

A string of nucleotides confined within a protein capsid contains all the instructions necessary to make a functional virus particle, a virion. Although the structure of the protein capsid is known for many virus species1,2, the three-dimensional organization of viral genomes has mostly eluded experimental probes3,4. Here we report all-atom structural models of an HK97 virion5, including its entire 39,732 base pair genome, obtained through multiresolution simulations. Mimicking the action of a packaging motor6, the genome was gradually loaded into the capsid. The structure of the packaged capsid was then refined through simulations of increasing resolution, which produced a 26 million atom model of the complete virion, including water and ions confined within the capsid. DNA packaging occurs through a loop extrusion mechanism7 that produces globally different configurations of the packaged genome and gives each viral particle individual traits. Multiple microsecond-long all-atom simulations characterized the effect of the packaged genome on capsid structure, internal pressure, electrostatics and diffusion of water, ions and DNA, and revealed the structural imprints of the capsid onto the genome. Our approach can be generalized to obtain complete all-atom structural models of other virus species, thereby potentially revealing new drug targets at the genome-capsid interface.


Conflict of interest statement

Competing interests

The authors declare no competing interests

Figures

Extended Data Figure 1 |
Extended Data Figure 1 |. Structure and fluctuations of empty HK97 capsid.
a, RMSD of the entire capsid from its initial coordinates during all-atom equilibration simulations. For the first 70 ns, parts of the system were subject to restraints, as detailed in Methods and Supplementary Table 2. The image on the right shows one of the 60 asymmetric subunits with residues resolved in the crystal structure shown in blue and modeled in red. b, Arrangement of the asymmetric subunits into an icosahedron capsid (left). Modeled residues are shown red. The right image details the subunit, consisting of seven proteins. c, Distribution of individual proteins’ average RMSD grouped according to the protein location in the asymmetric subunit. The distributions were computed over the last 38 ns of the equilibration trajectory. Colors are defined in panel (b). d, Average per-residue RMSD of an empty capsid from the crystallographic coordinates as a function of the residue number. RMSD of modeled residues is not shown. e, Cartoon representation of resolved regions of proteins 1 (representative for proteins 1 to 5), 6 and 7 colored according to their average RMSD. f, Average RMSF of individual proteins according to their location. The RMSF values were computed over the last 100 ns of the equilibration trajectory. Error bars depict SD over n = 60 copies of the protein. The capsid is shown (right), with individual residues of the proteins colored by their average RMSF. g, Cumulative variance of the principal components (PCs). PC analysis was performed using CoM coordinates of each of the 420 capsid proteins and a representative 150 ns fragment of the free equilibration trajectory. (Top) Fractional cumulative variance as a function of the number of PCs, ordered by eigenvalue from highest to lowest. (Bottom) Same, shown only for the top twenty principal components. h, Projections of the top three PC, shown as vectors drawn from an average structure. Images in (i), (ii) & (iii) show projections of the first, second and third PCs, ordered by eigenvalue from high to low, each shown from four different perspectives. The top three PCs account for about 23, 12 and 6% of the total variance, respectively. Vector magnitudes drawn are based on the normalized eigenvector multiplied by the corresponding eigenvalue and then multiplied by a factor of ten, to facilitate visualization.
Extended Data Figure 2 |
Extended Data Figure 2 |. Electrostatic properties of empty and packaged capsids.
a, Ion exchange rate during equilibration of the empty (left), “slow” (center) and “slow with twist” (right) packaged capsids. Ion exchange data were collected every ~10 ns. The lines shown were obtained from the data using a Savitzky-Golay filter with a ~110 ns window. b, Radial profiles of the electrostatic potential averaged over 50 ns (empty; left) or 100 ns (slow; center and right) windows. The electrostatic potential was computed using VMD PMEpot plugin. c, Image depicting the final result of an algorithm used to select the interior and exterior of the capsid, see Methods for details. d, Total charge inside the protein capsid in the units of proton charge. Traces are shown with (solid lines) and without (dotted lines) inclusion of the protein capsid in the analysis. Water molecules were neglected in the analysis. e, Charge inside a spherical volume centered at the center of the capsid as a function of the sphere’s radius. Data were averaged over the last 100 ns of each simulation. For reference, the density of C atoms is shown (blue histogram; right axis). f, Electrostatic dipole moment of an asymmetric subunit projected along the radial axis. At each frame, the moment was averaged over all sixty copies of the asymmetric subunit. For reference, the blue line shows the average dipole moment of the residues resolved in the X-ray structure. g, Theoretical model used to estimate the electrostatic potential across the capsid (see Methods). h, Average potential difference between solvent occupied regions inside and outside the capsid as computed using PMEpot (circles) and from a fit using the theoretical model (dashed lines). In contrast to analysis shown in Fig. 3i,j, the PMEpot averaging was restricted to the solvent region within the capsid. That was done by blurring the mass density of DNA nucleobases via convolution with a 1 nm wide gaussian kernel and then selecting regions where the blurred density was less than 0.05 Da Å −3. The fit was performed by minimizing the MSD between predicted and measured data points, yielding the following values for the parameters of the model: qextra, empty = 248.4 e, qextra, slow = 404.9 e, and εpro = 6.53.
Extended Data Figure 3 |
Extended Data Figure 3 |. Properties of packaged genome configurations.
a, Sixteen genome configurations obtained by independent coarse-grained packaging simulations performed under the same 55 pN packaging force in the absence of twist (left) and with a 14°-per-10-bp twist imposed by the packaging protocol (right). Each genome configuration has a unique interface between the early- (blue) and late-packaged (red) DNA domains. b, Statistical properties of the packaged DNA configurations. Each plot depicts the distributions of a locally-defined metric for beads assigned in five different radial ranges, each with a 5 nm width, except the innermost group, which includes all beads within 7.5 nm of the capsid center. The distributions are semi-transparent and are provided for each packaged capsid. The mean of each distribution is shown as a solid horizontal line segment. The first three columns of plots characterize the angle between the local tangent at each bead and the spherical basis vectors at the bead’s location. The last three columns depict local curvature, toroidal order and nematic order. The fast packaged capsids exhibited significant differences according to several of the metrics. For example, the fast packaged DNA located within 7.5 nm of the capsid center points away from the portal by ~5° on average, whereas the slow packaged DNA pointed towards and away from the portal with roughly equal likelihood. Compared to the slow packaged genomes, the fast packaged DNA had a slightly higher average curvature, lower nematic order, and, especially when twist was not imposed, greater toroidal order.
Extended Data Figure 4 |
Extended Data Figure 4 |. Structural features of packaged capsids.
a, Trajectory-average distance from the center of the capsid to the CoM of each capsid protein versus the corresponding crystal structure value. For each protein location, the symbol shows the value averaged over the 60 copies of the protein, whereas the histogram (top axis) shows the distribution among the protein copies. Data is shown from the last 50 ns of each trajectory, sampling coordinates every 0.192 ns. b, Average per-residue RMSD of the “slow” and “slow with twist” capsids from the crystallographic coordinates as a function of the residue number. RMSD of modeled residues is not shown. The averaging was done over the last 105 ns of each trajectory, sampling coordinates every 0.192 ns The proteins at locations 1 to 5 exhibit consistent patterns (left), and the average of these data is depicted on the right (black). c, Average per-residue displacement of the packaged capsid with respect to the empty capsid. Deviation of modeled residues is not shown. The averaging was done over the last 40 ns of each trajectory, sampling coordinates every 48 ps. The mean and standard deviation over protein locations 1 to 5 are shown in black.
Extended Data Figure 5 |
Extended Data Figure 5 |. Supplementary analysis of the all-atom MD trajectories.
a, Location of water passages (blue molecular surface) within the capsid visualized as an isosurface (5.26 molecules nm3) of water density, averaged over the 60 icosahedron subunits, for the empty (left) and packaged (right) capsids. The analysis was performed using the last 2 ns of the each MD trajectory. The data in the left image are the same as in Fig. 1i. The ratio of the volume occupied by water (slow to empty) is 0.68. Less prominent differences in the water passages are observed inside the region confined by the yellow semi-transparent curve. Prominent differences are observed outside that region, where adjacent asymmetric subunits meet. Thus, expansion of the capsid caused by the packaged DNA leads to reduction of the gaps between the adjacent protein subunits. b, Diffusivity of DNA helices plotted as a function of their radial distance from the capsid’s center. Error bars reflect standard deviation across points, contingent on helix count in radial bins. Data shown in the upper panels were obtained in the reference frame of the capsid whereas those in the lower panels were obtained in the local helical reference frame. The insets schematically illustrate the motion characterized by the corresponding diffusion coefficients. c, Radial distribution of ion diffusivity (left axis). Symbols correspond to the simulation models: empty circles for “empty”, yellow diamonds for “slow with twist” and green squares for “slow”, respectively. The radially averaged protein density (right axis) is shown for the packaged (filled distribution) and empty (dashed line) simulation trajectory.
Extended Data Figure 6 |
Extended Data Figure 6 |. TEM-like analysis of packaged HK97 genomes.
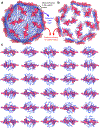
a, TEM images of HK97 viral particles reproduced from Ref. 17. b, TEM-like images of computationally packaged HK97 genomes. To make the TEM-like images, DNA mass density obtained from the coarse-grained packaging simulations was projected along several axes for several packaged genome configurations. The capsid density was not included in the analysis.
Extended Data Figure 7 |
Extended Data Figure 7 |. Properties of packaged genomes according to all-atom MD simulations.
a, Simulated profiles of DNA density for the four microsecond-long all-atom MD trajectories. The simulated profiles were computed by averaging 4 ⨉ 4 nm2 centered sections connecting the ten pairs of opposite faces (left) or the six pairs of opposite vertices (right) and by averaging over the last 500 ns of the respective trajectories. The conformations resulting from the slow packaging simulations show greater DNA ordering (more visible layers) compared to the conformations resulting from fast packaging simulations. Lower but persistent order is observed along the vertices’ symmetry axes. The configurations sampled by the simulations of the “slow” packaged particle show a higher ordering of the DNA near vertices compared to other simulations. The variations observed in individual structures may arise from the inherent stochasticity associated with the process of packaging. b, Fraction of base pairs broken in the DNA genome during the equilibration simulations of the six packaged particles. A base pair is considered intact if the H1 or N1 atom of a purine is within 2.5 Å of the N3 or H3 atoms of a pyrimidine, and the angle formed by the N1-H1-N3 or N1-H3-N3 atoms is greater than 115 degrees. c, Fraction of base pairs broken within three internal radial bins, analyzed every 0.96 ns of the “slow” (solid lines) and “slow with twist” (dotted lines) trajectories. d, Fraction of broken basepairs characterized according to their conformation (frayed, mis-stacked and over bent), analyzed over the last 50 ns of the “slow” trajectory. Exterior (Ext.) refers to DNA base pairs that have at least one non-hydrogen atom within 20 Å of the protein non-hydrogen atom, and interior (Int.) refers to all other base pairs. Error bars reflect standard deviation across points, contingent on broken basepairs in radial bins. e, Violin plots of the angle between the local axis of a 10 bp DNA fragment and a radial vector as a function of the radial distance to the capsid center. The CoM of each 10 bp fragment was recorded for the last 288 ns of the equilibration trajectory, sampled every 0.48 ns. As expected, helices tend to align transverse to the radial vector, as one moves from the capsid center to the outermost layer (blue). A relatively higher bimodality is observed when packaging is performed at higher force in the bins next to the outermost layer, i.e. the two bins shown in green.
Extended Data Figure 8 |
Extended Data Figure 8 |. Base pair-level characterization of the all-atom genome structures.
The analysis was performed by first writing down separate coordinate files for every 150 bp of the genome for the last 5 ns of each all-atom trajectory every 48 ps. Each individual coordinate file was then analyzed using the Curves+ package. The base-pair level properties were then average according to the base pairs’ radial distance from the capsid center and normalized with respect to the number of base pairs within each radial bin and error bars depict SEM over n = 104 consecutive segments of the trajectory. Schematics adapted from ref. with permission from Nat. Protoc. Colors indicate the different packaged models. Dashed line depicts mean deviation for two DNA duplexes having a random sequence of 28 bp in a 0.1 mol kg1 KCl solution, each simulated for 90 ns in the NPT ensemble. For both systems, base-pair parameters were averaged separately for last two 40 ns intervals, giving four independent samples for computing the standard error.
Extended Data Figure 9 |
Extended Data Figure 9 |. Topological defects in the structure of DNA genome near the edges of the capsid.
a, Arrangement of the DNA molecules (blue) in the outermost layer of the genome at the end of the all-atom MD equilibration of the packaged capsid (slow trajectory). Proteins forming the capsid edges are shown in pink; the rest of the assembly is not shown for clarity. b, Same as in the previous panel, showing only the DNA helices located within 20 Å of the capsid edges. c, For each capsid edge (pink) the DNA helices from the previous panel are separately shown, viewed from the inside to outside.
Extended Data Figure 10 |
Extended Data Figure 10 |. Multi-resolution model of DNA–DNA and DNA–protein interactions.
a, Explicit solvent all-atom MD simulations of internal pressure in a DNA array. Color indicates bulk electrolyte molarity: 20 mM Mg2+ /200 mM Na+ (cyan), 250 mM Na+ (orange), and 2 mM Sm4+/200 mM Na+ (red). Using CUFIX corrections to non-bonded interactions was essential to achieve quantitative agreement with experiment. b, CG simulations of DNA array pressure at multiple resolutions. The internal pressure matches experimental values regardless of the resolution of the model. The CG simulations were performed using the mrDNA model. c, Calibration of DNA–protein interactions. In each simulation, a DNA molecule was pushed against a flat cross-section of the viral capsid by an external force corresponding to a 20 bar pressure. The grid-based representation of the protein capsid was tuned to match the average DNA–protein distance seen in the all-atom simulation.
Figure 1:
Figure 1:. In situ structure of protein capsid in the absence of DNA.
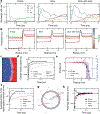
a, Solvated, 27.5 M-atom model of empty HK97 virion. One of the repeating subunits of the icosahedral capsid is highlighted in colors that represent the seven protein locations within the subunit. b, Interior volume (top), vertex-to-vertex (middle) and face-to-face (bottom) dimensions of the capsid versus simulation time. The dashed lines indicate the corresponding crystal structure values. Error bars show SD over n = 6 and n = 10 pairs of vertices and faces, respectively. c, Trajectory-average distance from the center of the capsid to the center of mass (CoM) of each capsid protein versus the corresponding crystal structure value. For each protein location, the symbol shows the value averaged over the 60 copies of the protein whereas the histogram (top axis) shows the value’s distribution among the copies. d, Root mean-squared fluctuation (RMSF) of each protein CoM coordinates over a representative 50 ns fragment of equilibration. e, Average CoM RMSF by protein location, error bars representing SD over 60 copies per protein. Edge, face and vertex parts of the capsid are defined in panel (d,e). f, CoM radial displacement of two neighboring faces with respect to the average value shown using a color bar (top) and as a 10 ns running average (bottom). g, Representative 1 ns trajectories of water molecules crossing into (green) and out of (yellow) the capsid. h,i, Location of water passages (blue) visualized as an isosurface (5.26 molecules / nm3) of water density. In panel (i), the density was averaged over the 60 icosahedron subunits. j, Trans-capsid water exchange rate versus simulation time. k, Equilibrium water exchange rate for each protein location. Error bars (black) represent SEM over 60 copies per protein. l, Equilibrium ion concentration versus distance from the capsid center.
Figure 2:
Figure 2:. Simulation of genome packaging.
a, Packaging HK97 genome at 4 bp / 2 bead resolution. The plots illustrate simulations of the packaging process (left) driven by the portal potential (inset) and of spontaneous ejection (right). Solid lines here and throughout the figure depict ensemble averages; shaded regions depict s.e.m. among eight independent simulated replicas for each curve. b, Internal pressure and energy during packaging and equilibration simulations. c, Switchback loop formation during packaging. Inset depicts a switchback loop having a highly curved center and two arms that remain within 6 nm. The three genome configurations depict the formation of two switchback loops (in cyan and green). The first switchback loop (cyan) is extruded by the packaging motor until the loop growth stalls and the nascently-packaged DNA buckles forming a second loop (green). The DNA is colored by the instantaneous bend energy. d, Quantification of switchback loops during packaging, including the absolute number of loops detected, the average loop length (note that loops may overlap), and the amount of the packaged DNA in at least one switchback loop. e, Global order in the packaged genome. The local nematic order (6 nm neighborhood), and the Frank–Oseen nematic energy calculated from the nematic director field. f, Toroidal order of the packaged genome. g, Example of a packaged genome featuring a baseball seam interface between early (blue) and late (red) packaged DNA. h, Streamlines of the nematic director field of select capsids reveal a unique pattern for each genome. Each streamline is colored by the local nematic order.
Figure 3:
Figure 3:. Properties of packaged capsid.
a, Solvated, 26 M-atom model of a packaged virion after 1μs of unrestrained simulation. To reveal the encapsulated DNA (red), one half of the protein capsid is not shown. b, Interior volume (top), vertex-to-vertex (middle) and face-to-face (bottom) dimensions of the capsid simulated with and without DNA. Error bars show SD over n = 6 and n = 10 pairs of vertices and faces, respectively. c, Average CoM displacement of the capsid proteins from their crystallographic coordinates. d, Average CoM RMSF of the protein capsid by the protein location within the asymmetric subunit. Error bars represent SD over 60 copies of the protein. e, Average per-residue RMSD of a fully packaged capsid (“slow” trajectory) depicted by coloring the outward (top left) and inward (top right) facing residues of the icosahedron unit and as a function of the residue number (bottom). Residues undergoing large deviations are marked with symbols colored according to the protein location. Residues not resolved in the crystal structure are shown in white. f, Average per-residue displacement of the packaged capsid with respect to the empty capsid. g, Equilibrium ion concentration versus distance from the capsid center. h, Equilibrium rate of water exchange across the capsid, inwards (open) and outwards (solid), for fully packaged and empty states of the capsid. Error bars show SD over n = 25 measurements. i, Electrostatic potential map of the packaged virion (slow) averaged over the first (left) and the last (right) 100 ns fragments of the free equilibration simulation. j, Average electrostatic potential of the volume enclosed by the capsid relative to that outside the capsid as a function of simulation time for empty and packaged capsid simulations.
Figure 4:
Figure 4:. Properties of packaged DNA.
a,b, Average density of packaged DNA determined by cryoEM microscopy (a) and cryoEM-like analysis of the all-atom MD trajectory (b). c, Simulated (left axis) and experimental (right axis) profiles of DNA density. d, CryoEM-like density analysis of DNA configurations sampled by CG simulations of packaged particles shown, from left to right, with increasing degree of symmetrization. Replicas refer to independent packaged configurations. e, SAXS profiles of the DNA (blue) and protein (green) components of the all-atom model and experimental profile of an empty capsid. Dashed line indicates the DNA diffraction peak. Right figure shows SAXS curves for DNA configurations along the “slow” trajectory. f, Box plots of the angle between the local axis of a ten-bp DNA fragment and a radial vector versus distance to the capsid center. g, Base pair-level characterization of the packaged genome, normalized by the number of base pairs within each radial bin. Error bars depict SEM over n = 104 consecutive segments (last 5 ns) of the trajectory. Schematics adapted from ref. with permission from Nat. Protoc. Colors indicates packaged models as defined in the next panel. h, Fraction of broken base pairs versus distance from the capsid center. Error bars depict SD in respective radial bins. i, Local diffusion constants of a ten-bp DNA fragment versus its distance from the capsid center (left) and the distribution of the constant (right). The colors bands indicate the widths of a double gaussian fit to the histogram. j, Local diffusion constant of water (left axis) versus radial distance for empty and packaged capsid. The inset shows the local diffusion constants near and inside the protein capsid. The radially averaged protein density (right axis) is shown for the packaged (filled distribution) and empty (dashed line) trajectory.
Figure 5:
Figure 5:. Protein–DNA interactions within a packaged capsid.
a, Outer layer of the DNA genome colored in red near the capsid edges and blue near the capsid faces or vertices. Proteins forming the edge of the capsid are shown in green, all other parts of the packaged assembly are not shown. b, Examples of DNA (blue) arrangement near specific capsid edges (pink). c, The outer layer of DNA genome colored by its radial distance from the capsid center. d, Example of a DNA loop protrusion into a capsid vertix (top). Orientation of the DNA loop relative to a vector connecting the CoMs of the two nearest capsid proteins (bottom left) and the distribution of the loop orientation (bottom right). e, Water density near the DNA-protein interface averaged along the faces (top) and vertices (bottom) symmetry axes. f, Trajectory-averaged contact map of the protein heptamer with the DNA. g, Fraction of time heptamer residues make contact with the DNA versus the radial coordinate of the residues. Arginines are shown in red, all other residue types in blue. Data for Arg131 and Arg142 are circled in teal. h, Schematics of the pressure calculation protocol. i, Simulated internal pressure for several values of the spring constant. Raw data (faded background) were sampled every 9.6 ps and running averaged with a 0.96 ns window. j, Pressure determination simulations performed starting from two instances from the same packaged equilibration trajectory. k, Pressure determination simulation for four packaged particle models. Thin lines denote replica simulations started from a different instance of the same trajectory. For clarity, only the running average of the pressure data are shown.

References

    1. Jiang W, Tang L. Atomic cryo-EM structures of viruses. Curr. Opin. Struct. Biol 46, 122–129 (2017). - PMC - PubMed
    1. Luque D, Castón JR. Cryo-electron microscopy for the study of virus assembly. Nat. Chem. Biol 16, 231–239 (2020). - PubMed
    1. Dai X, Li Z, Lai M, Shu S, Du Y, Zhou ZH, Sun R. In situ structures of the genome and genome-delivery apparatus in a single-stranded RNA virus. Nature 541, 112–116 (2017). - PMC - PubMed
    1. Ilca S, Sun X, El Omari K, Kotecha A, de Haas F, DiMaio F, Grimes JM, Stuart DI, Poranen MM, Huiskonen JT. Multiple liquid crystalline geometries of highly compacted nucleic acid in a dsRNA virus. Nature 570, 252–256 (2019). - PubMed
    1. Duda RL, Teschke CM. The amazing HK97 fold: versatile results of modest differences. Curr. Opin. Virol 36, 9–16 (2019). - PMC - PubMed

MeSH terms

LinkOut - more resources