. 2024 Mar;627(8004):620-627.
doi: 10.1038/s41586-024-07142-4. Epub 2024 Mar 6.

The hyphal-specific toxin candidalysin promotes fungal gut commensalism

Affiliations

The hyphal-specific toxin candidalysin promotes fungal gut commensalism

Shen-Huan Liang et al. Nature. 2024 Mar.

Abstract

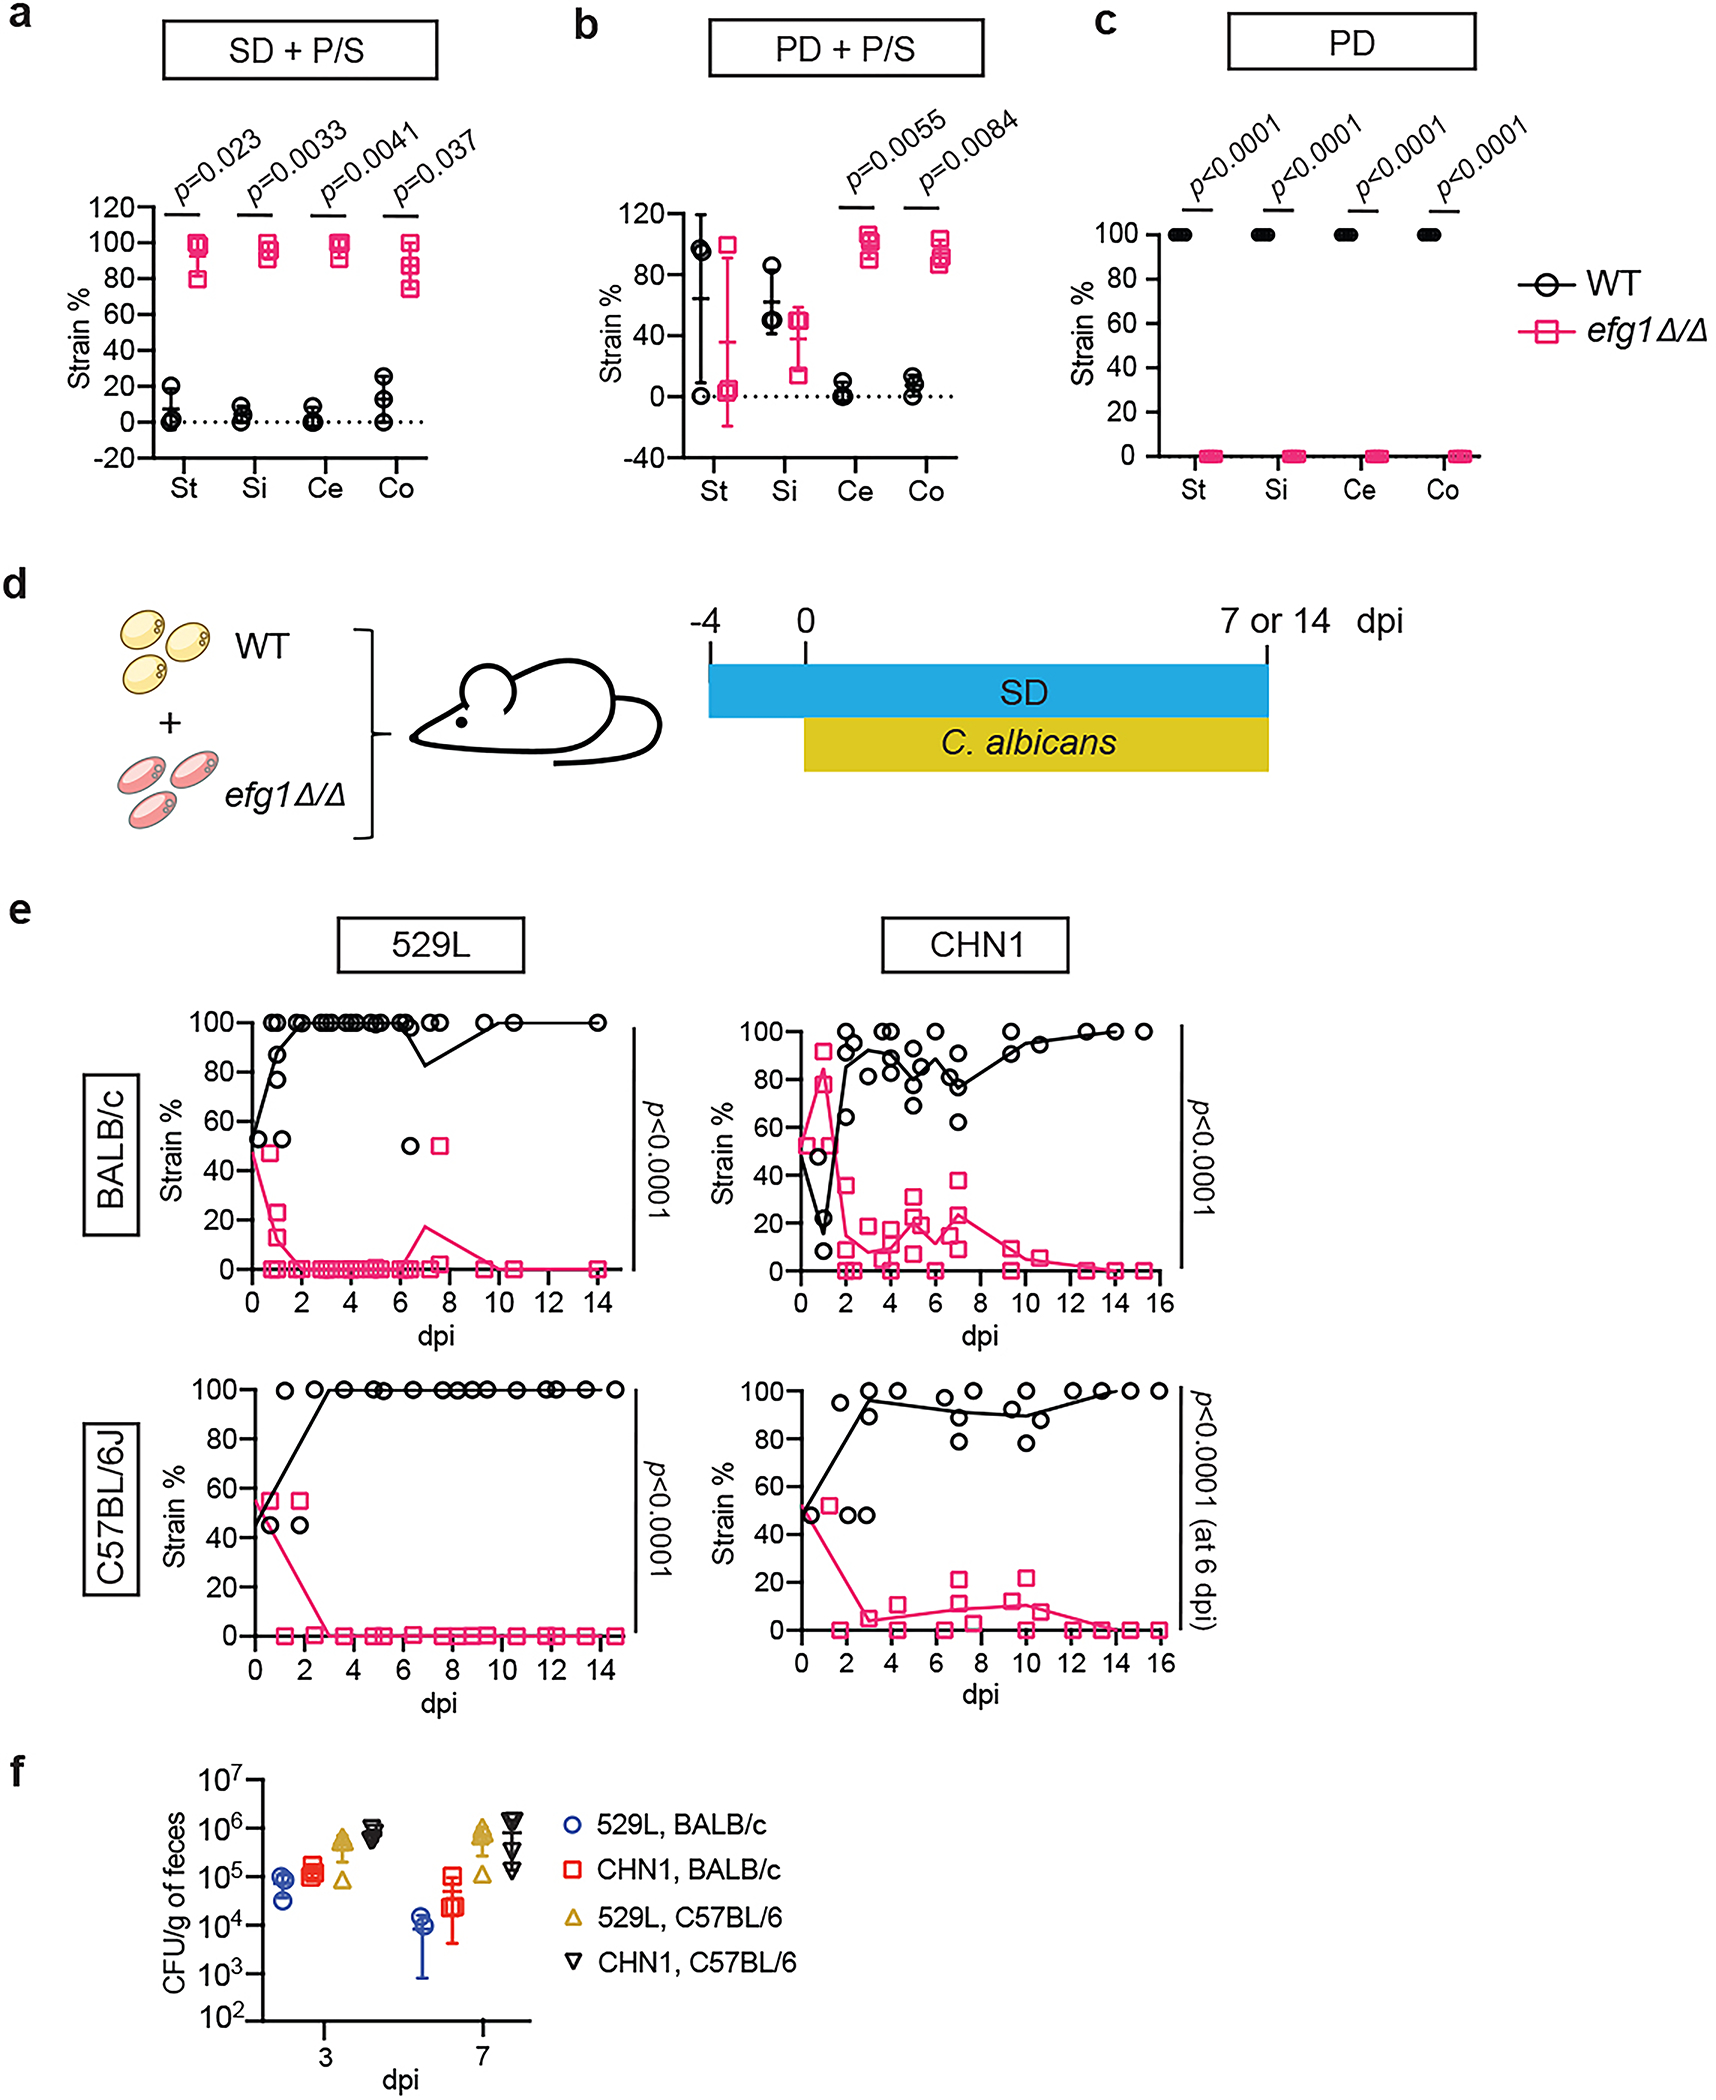
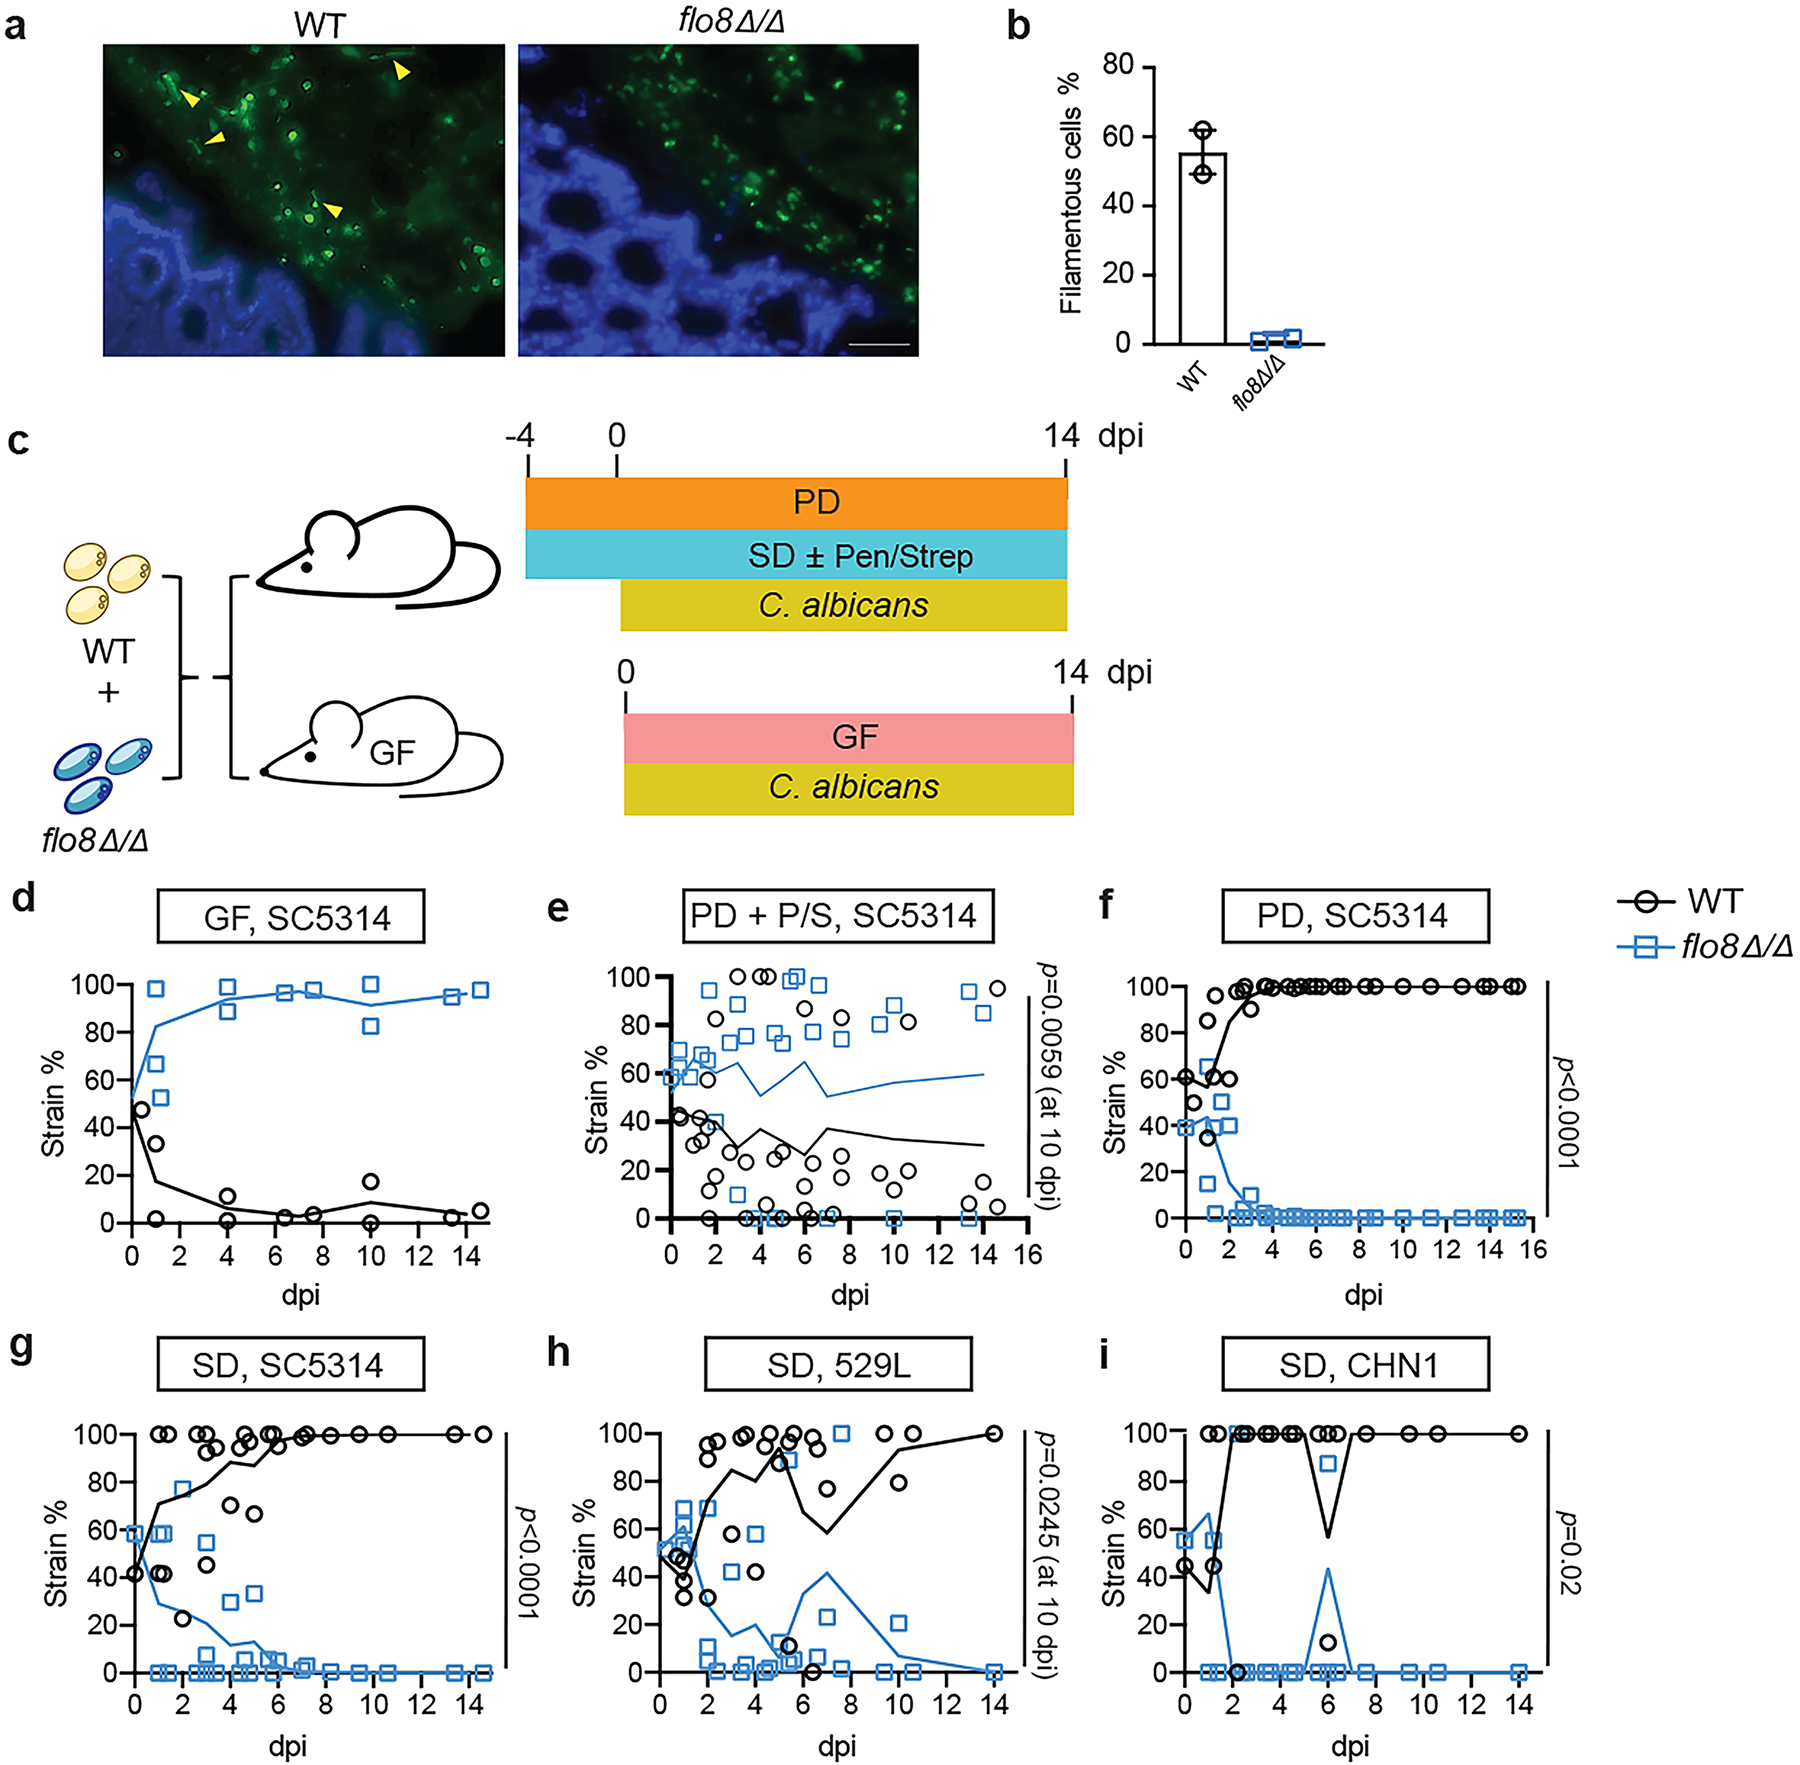
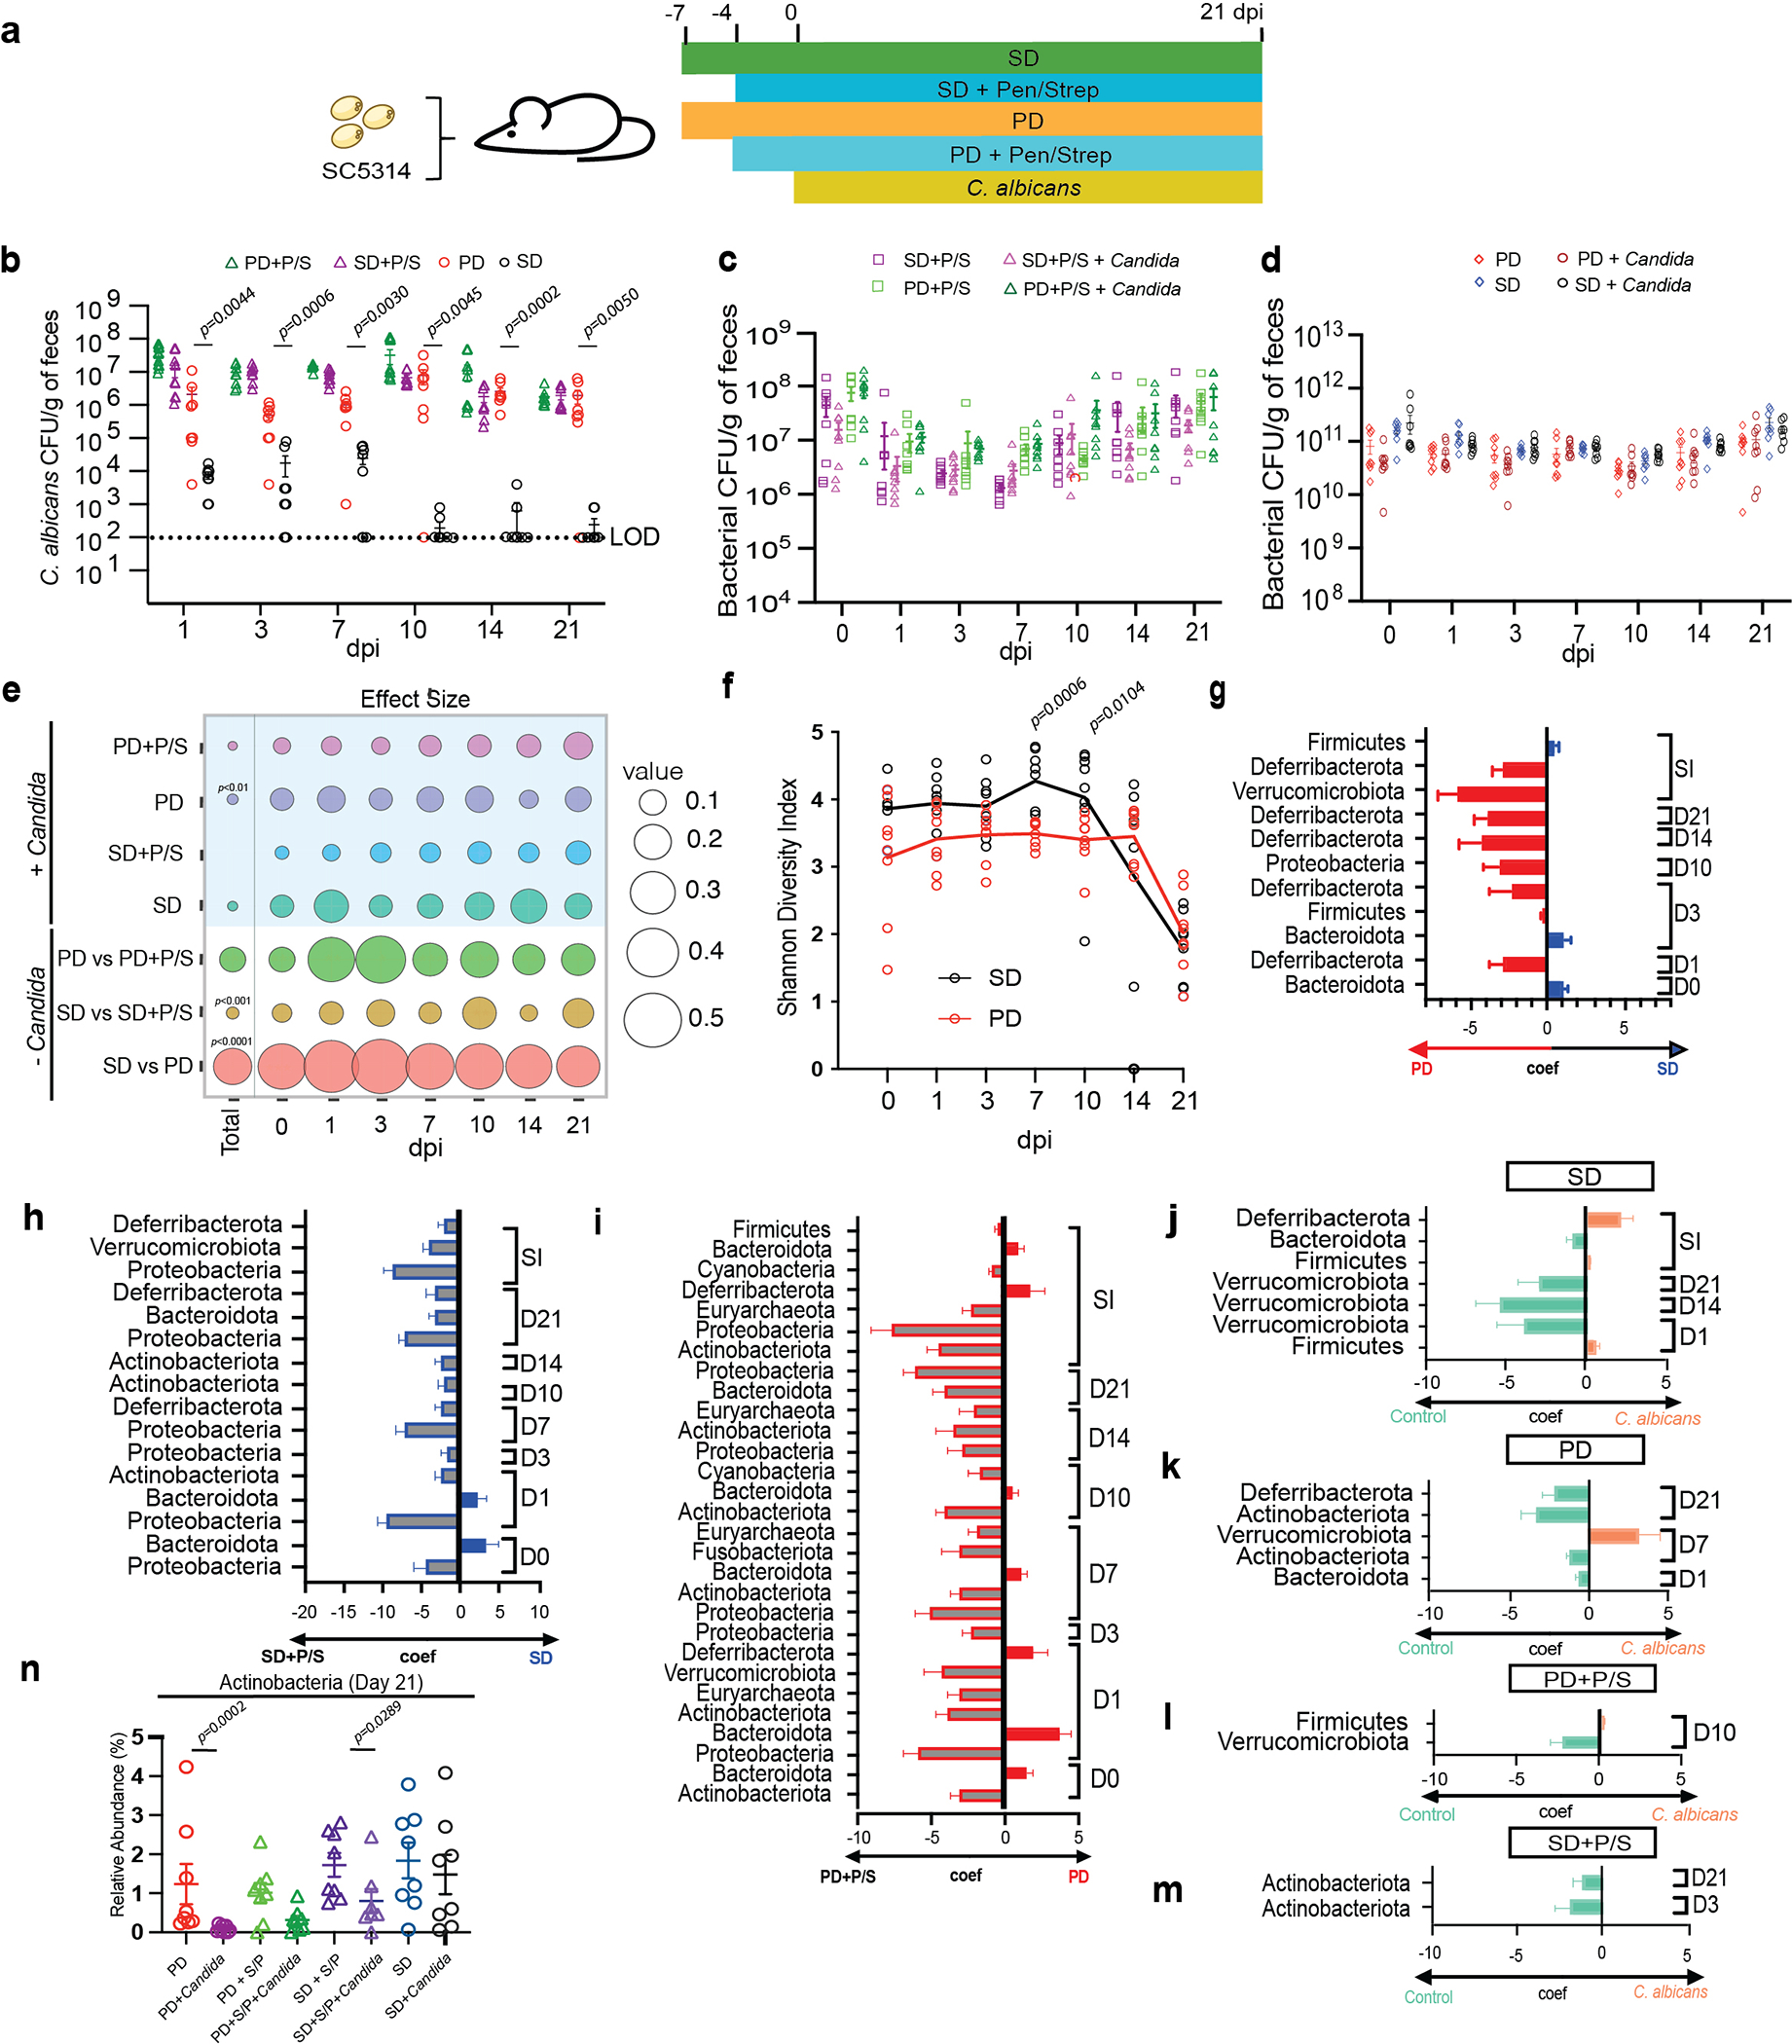
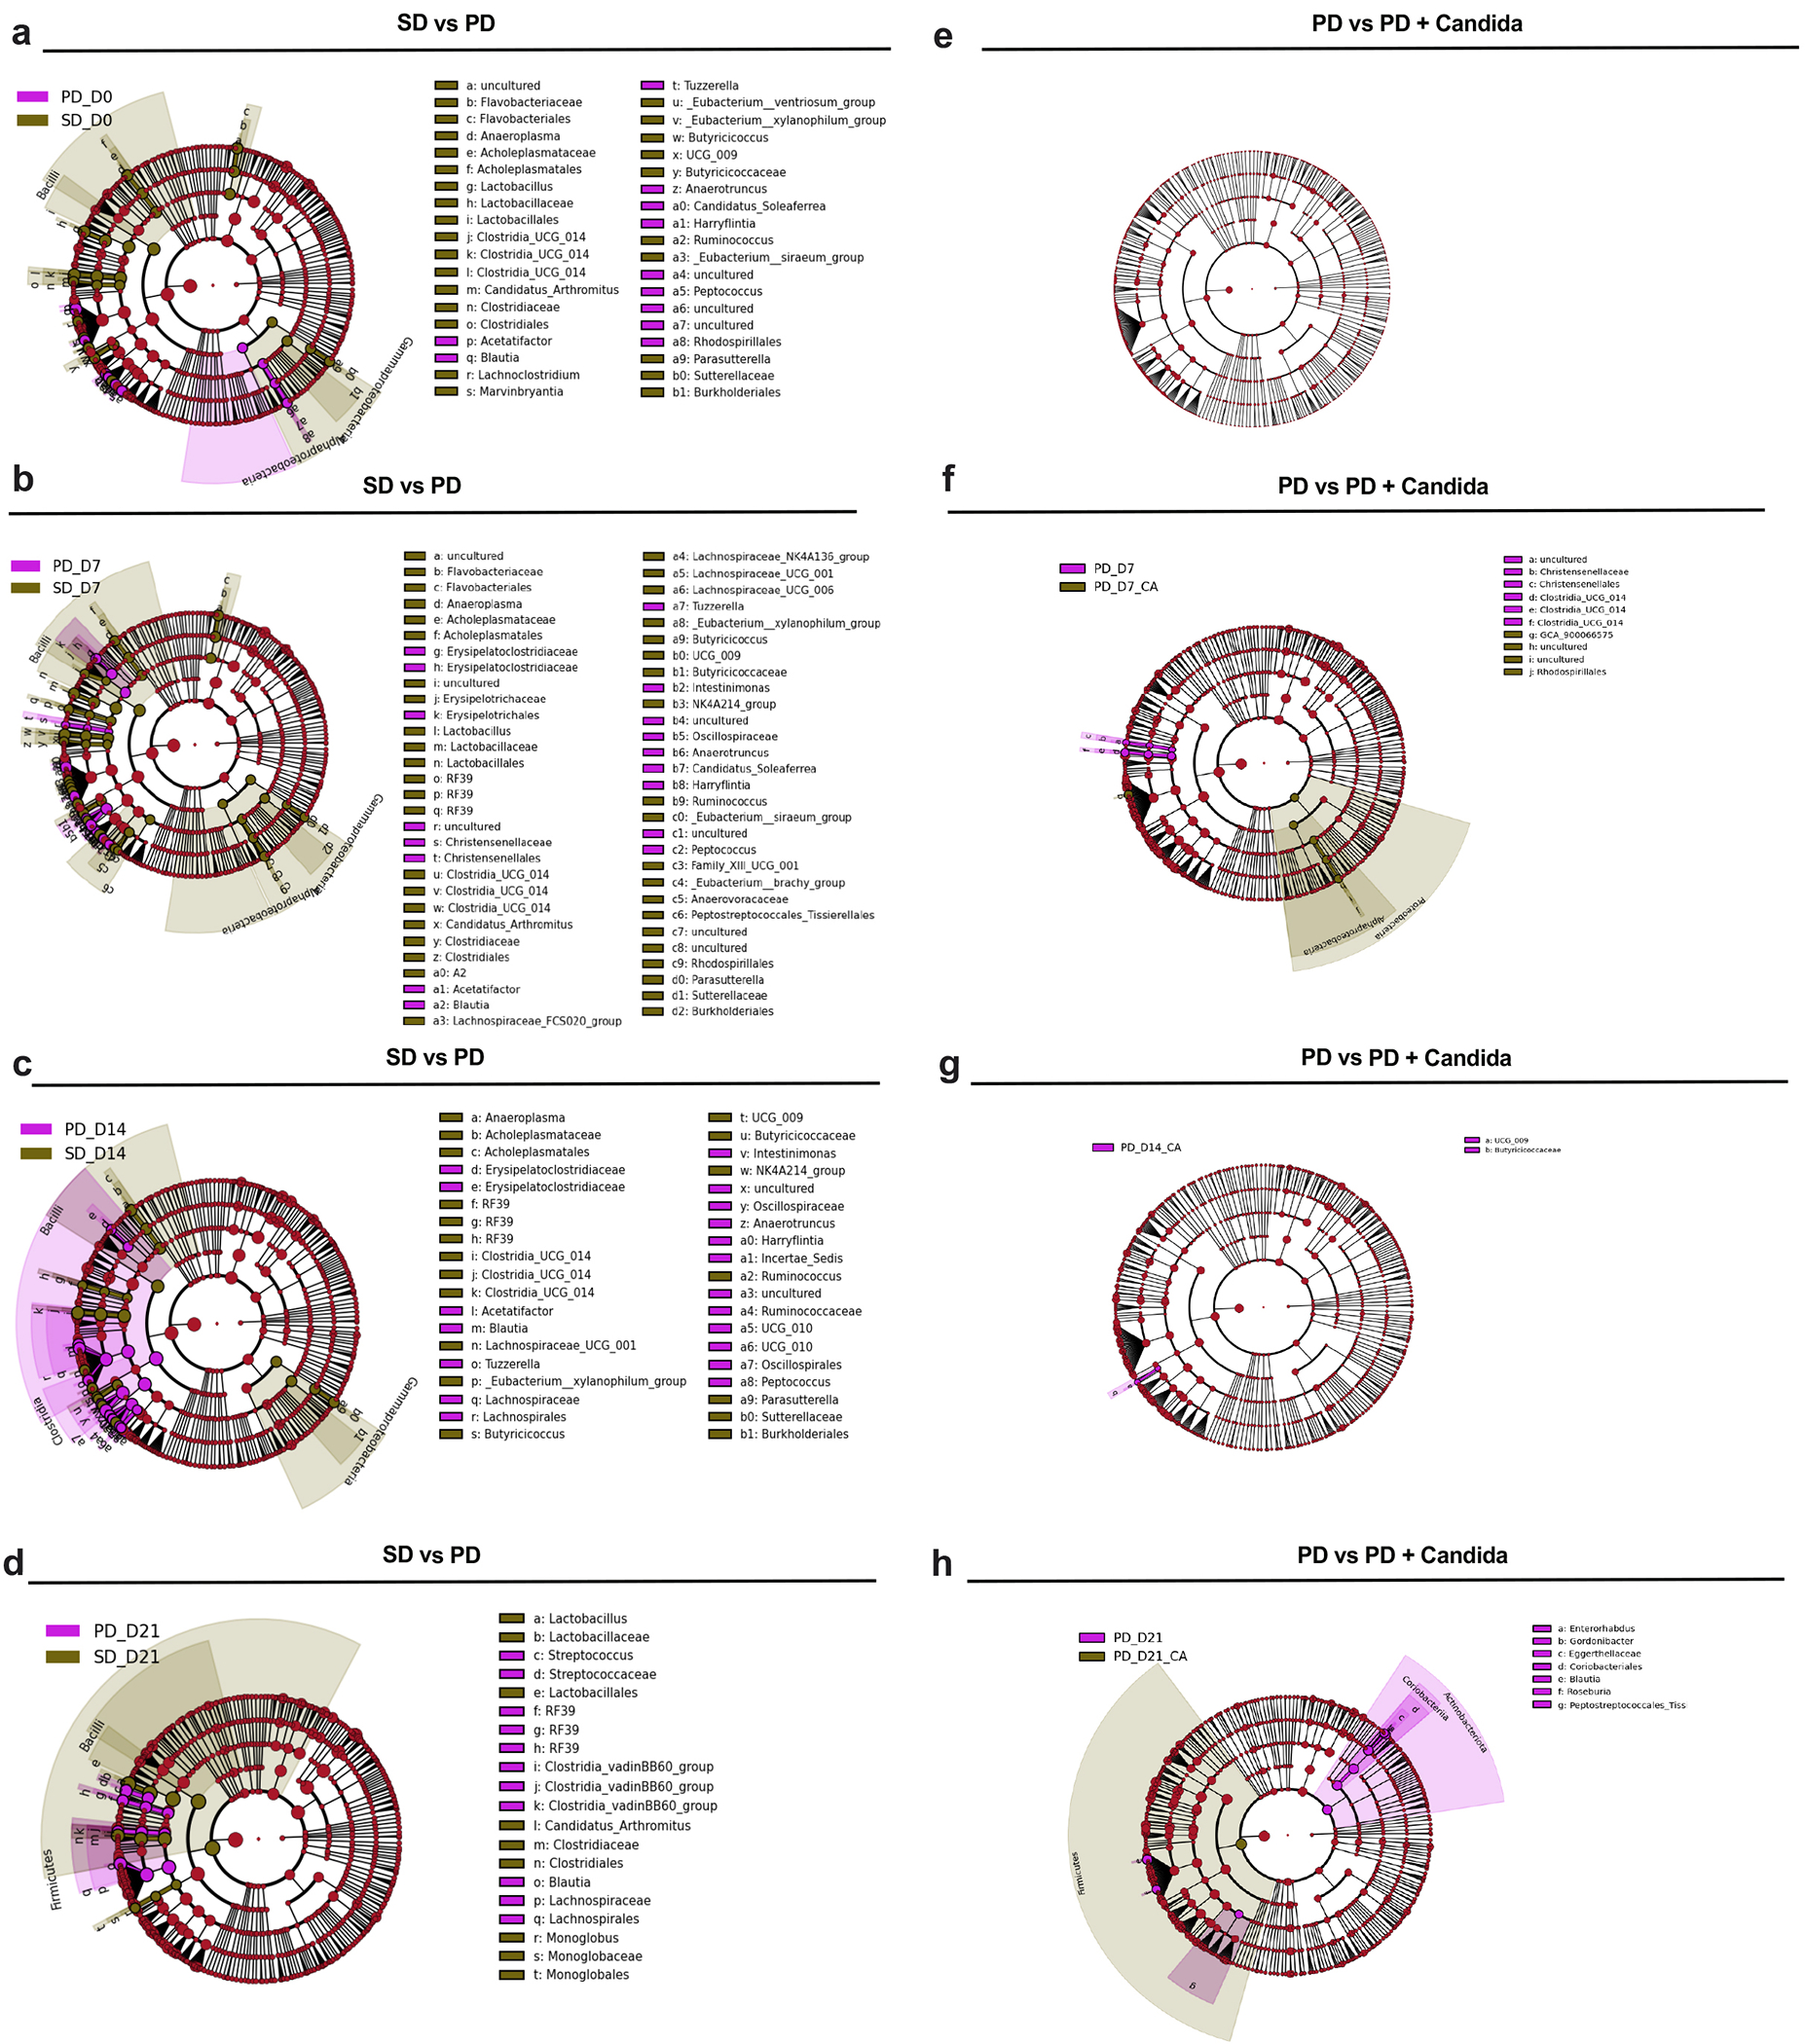
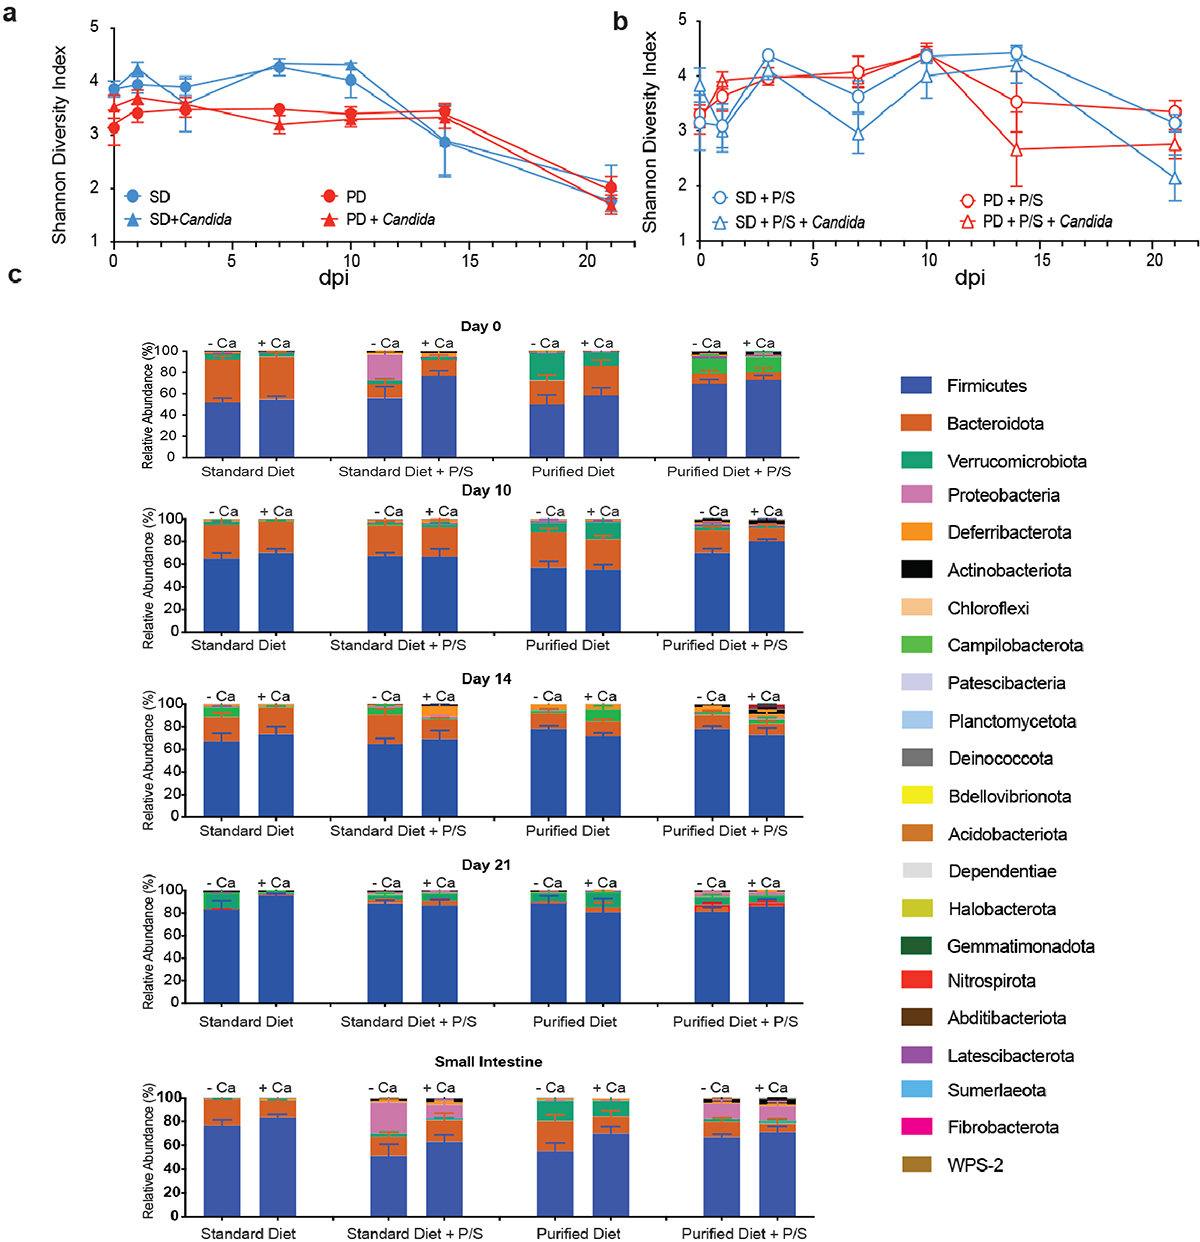
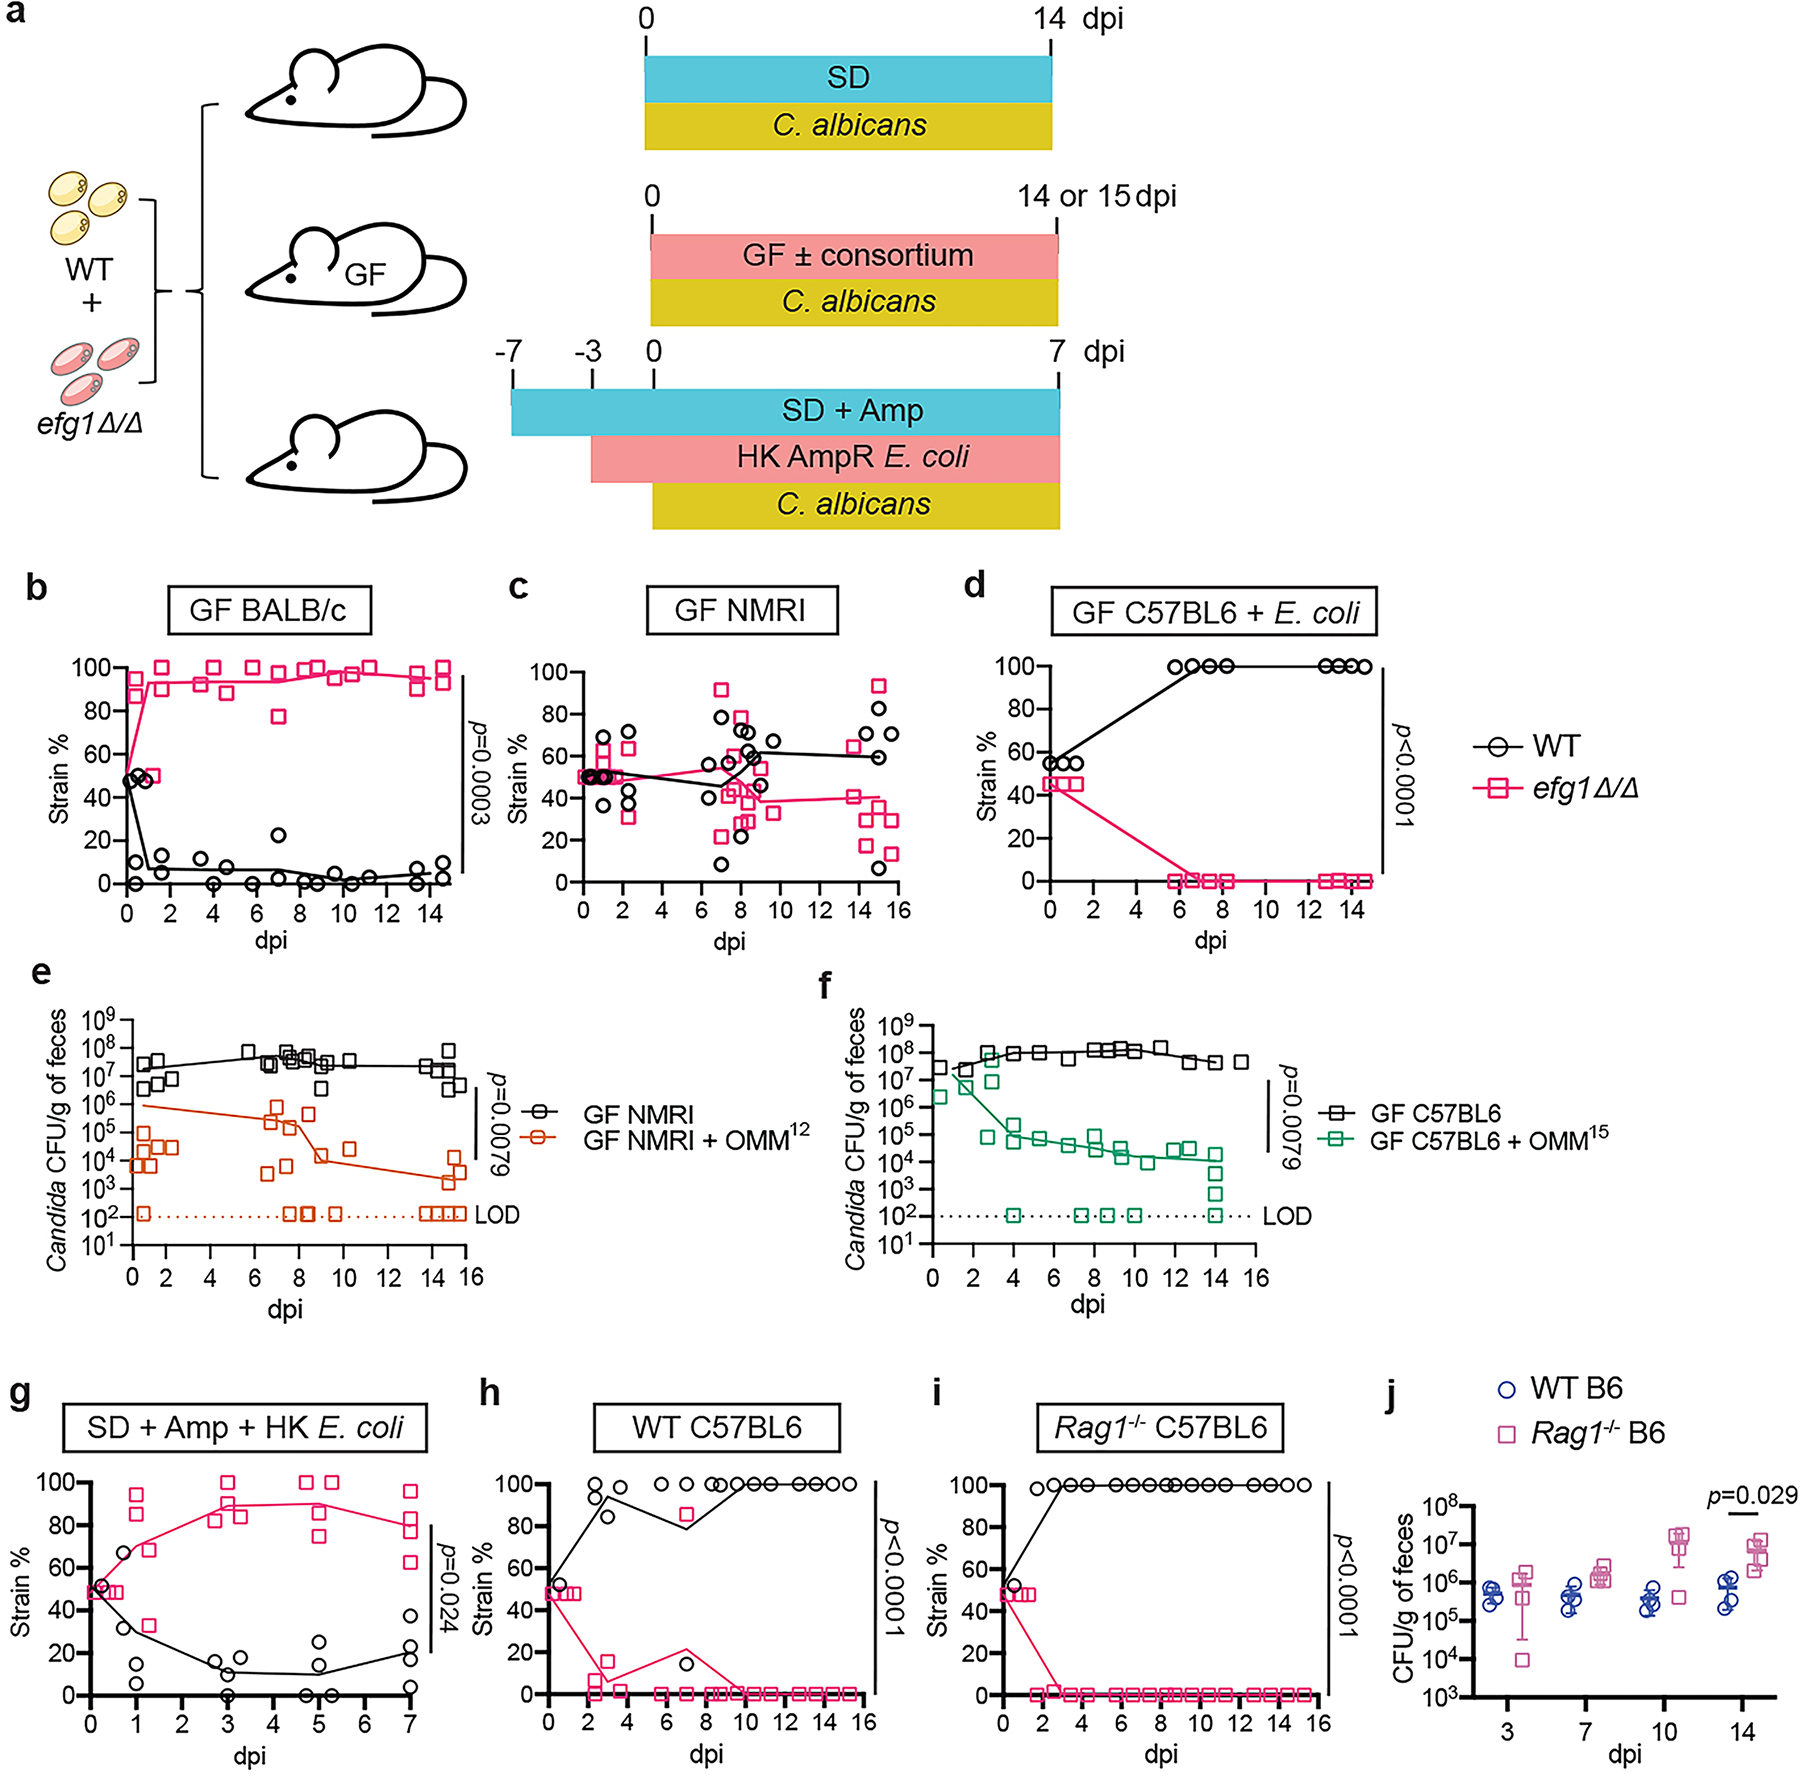
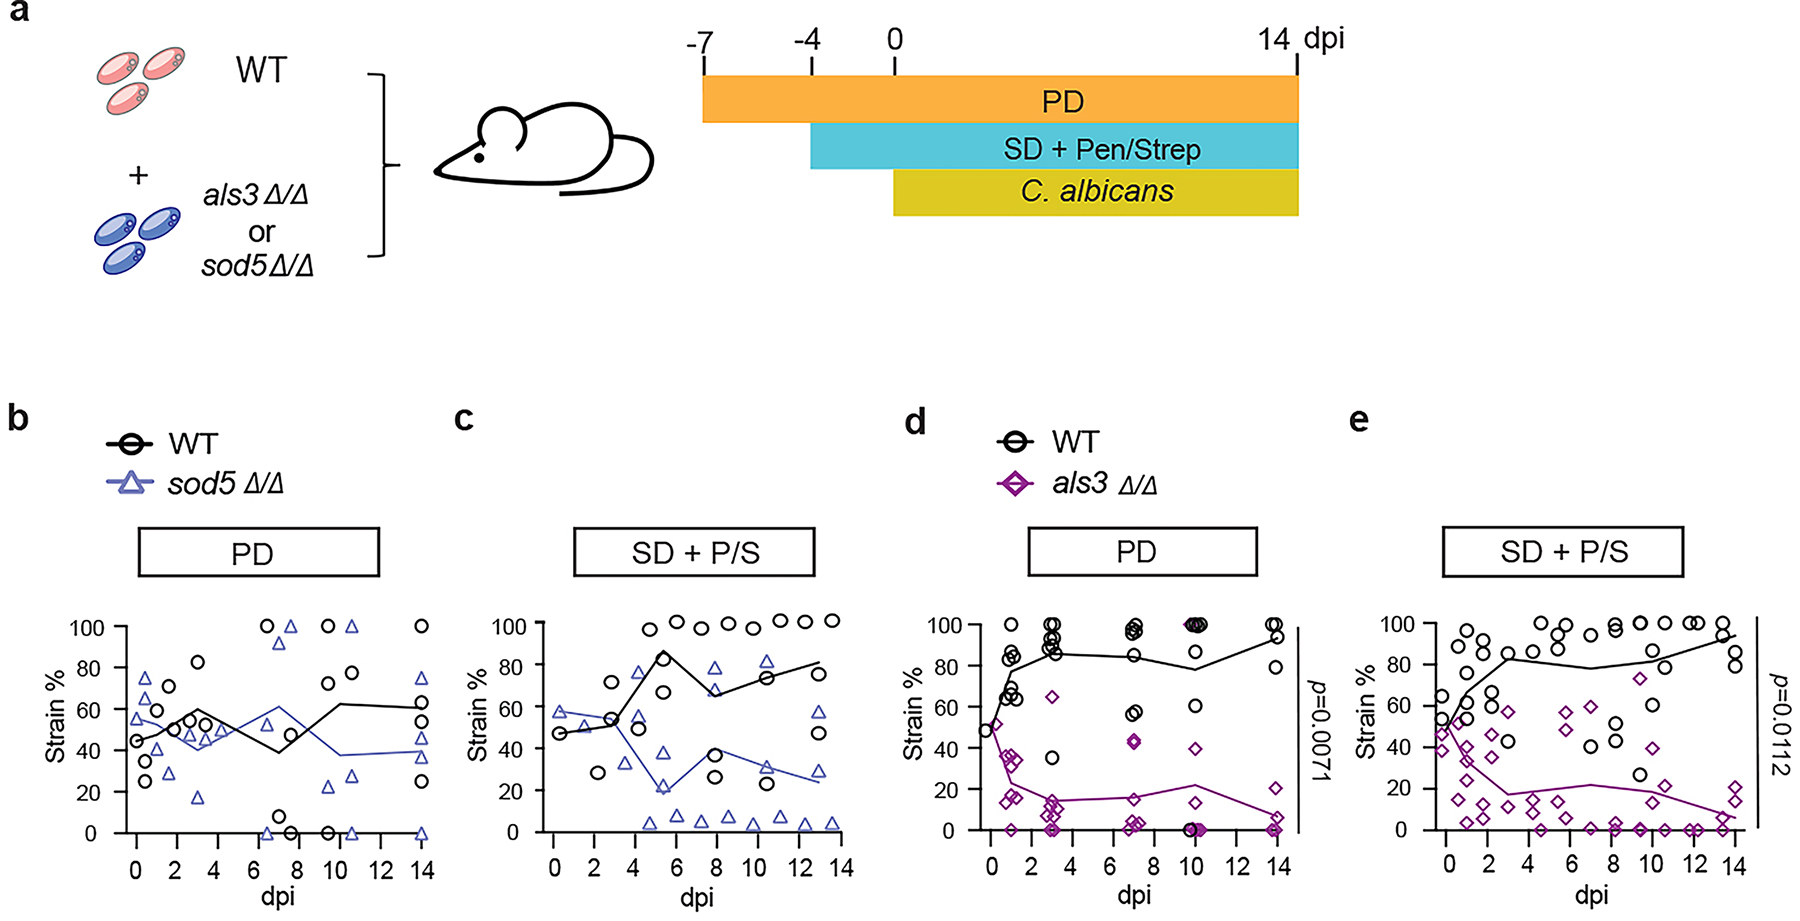
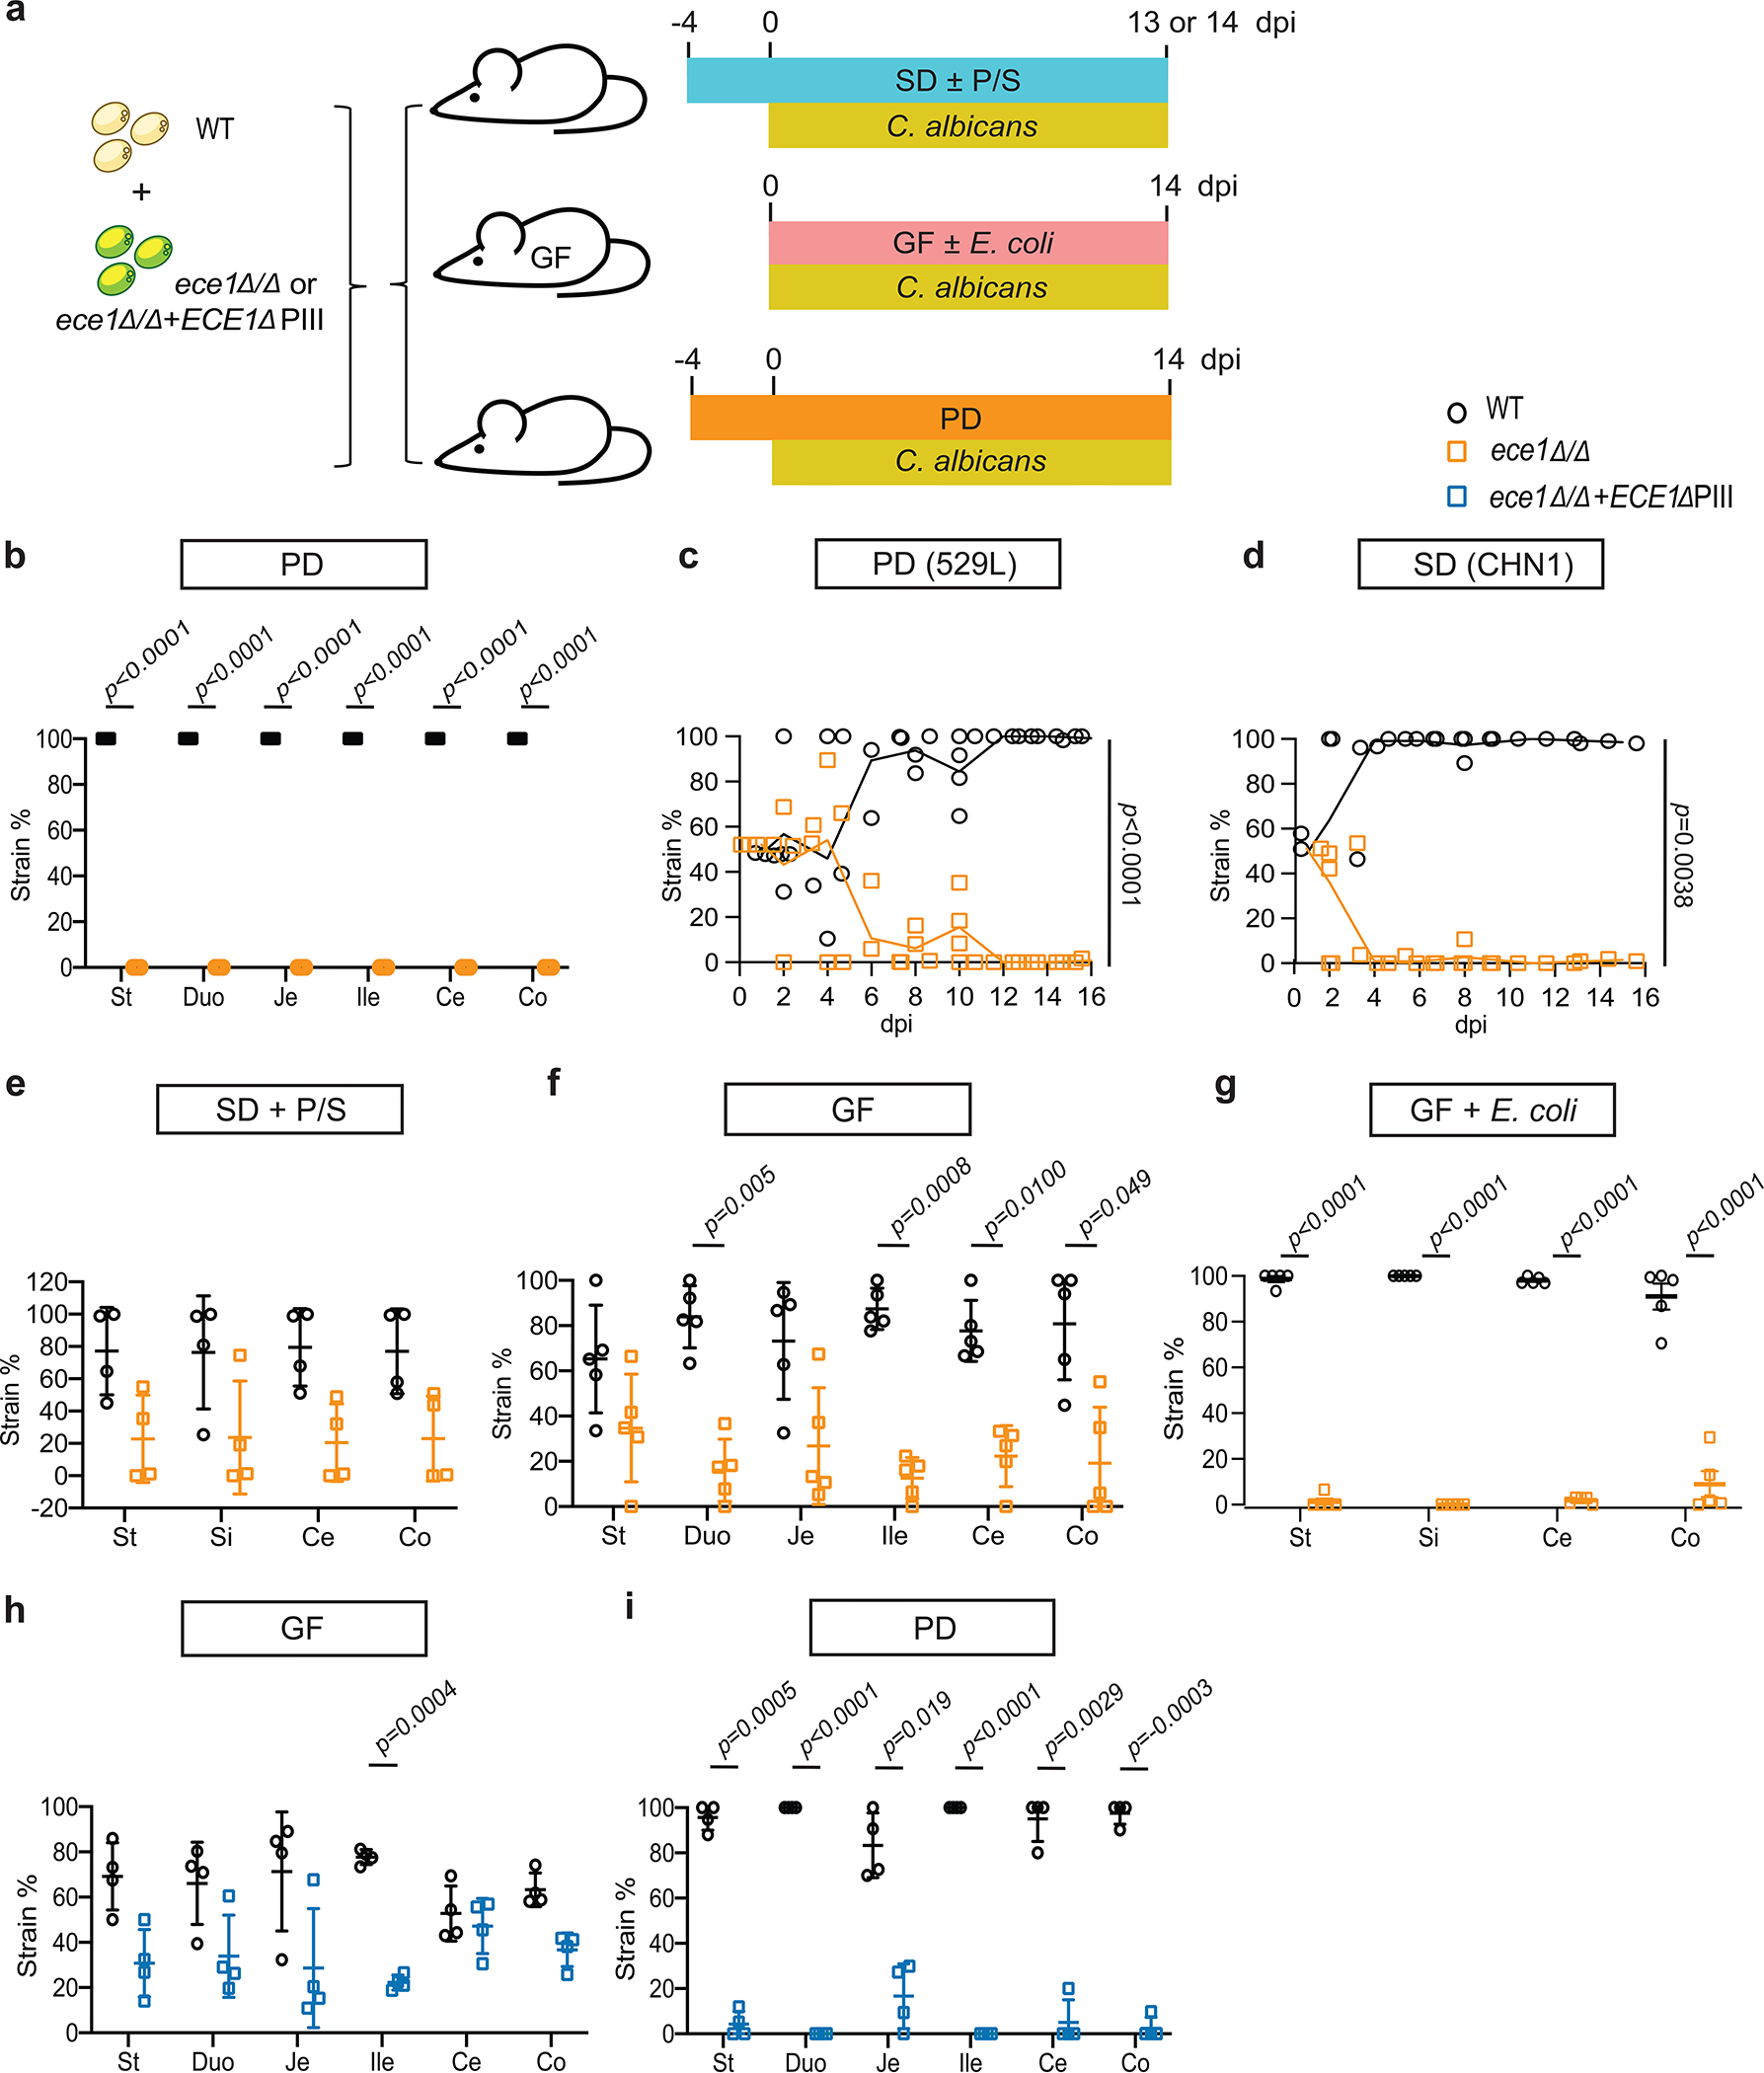
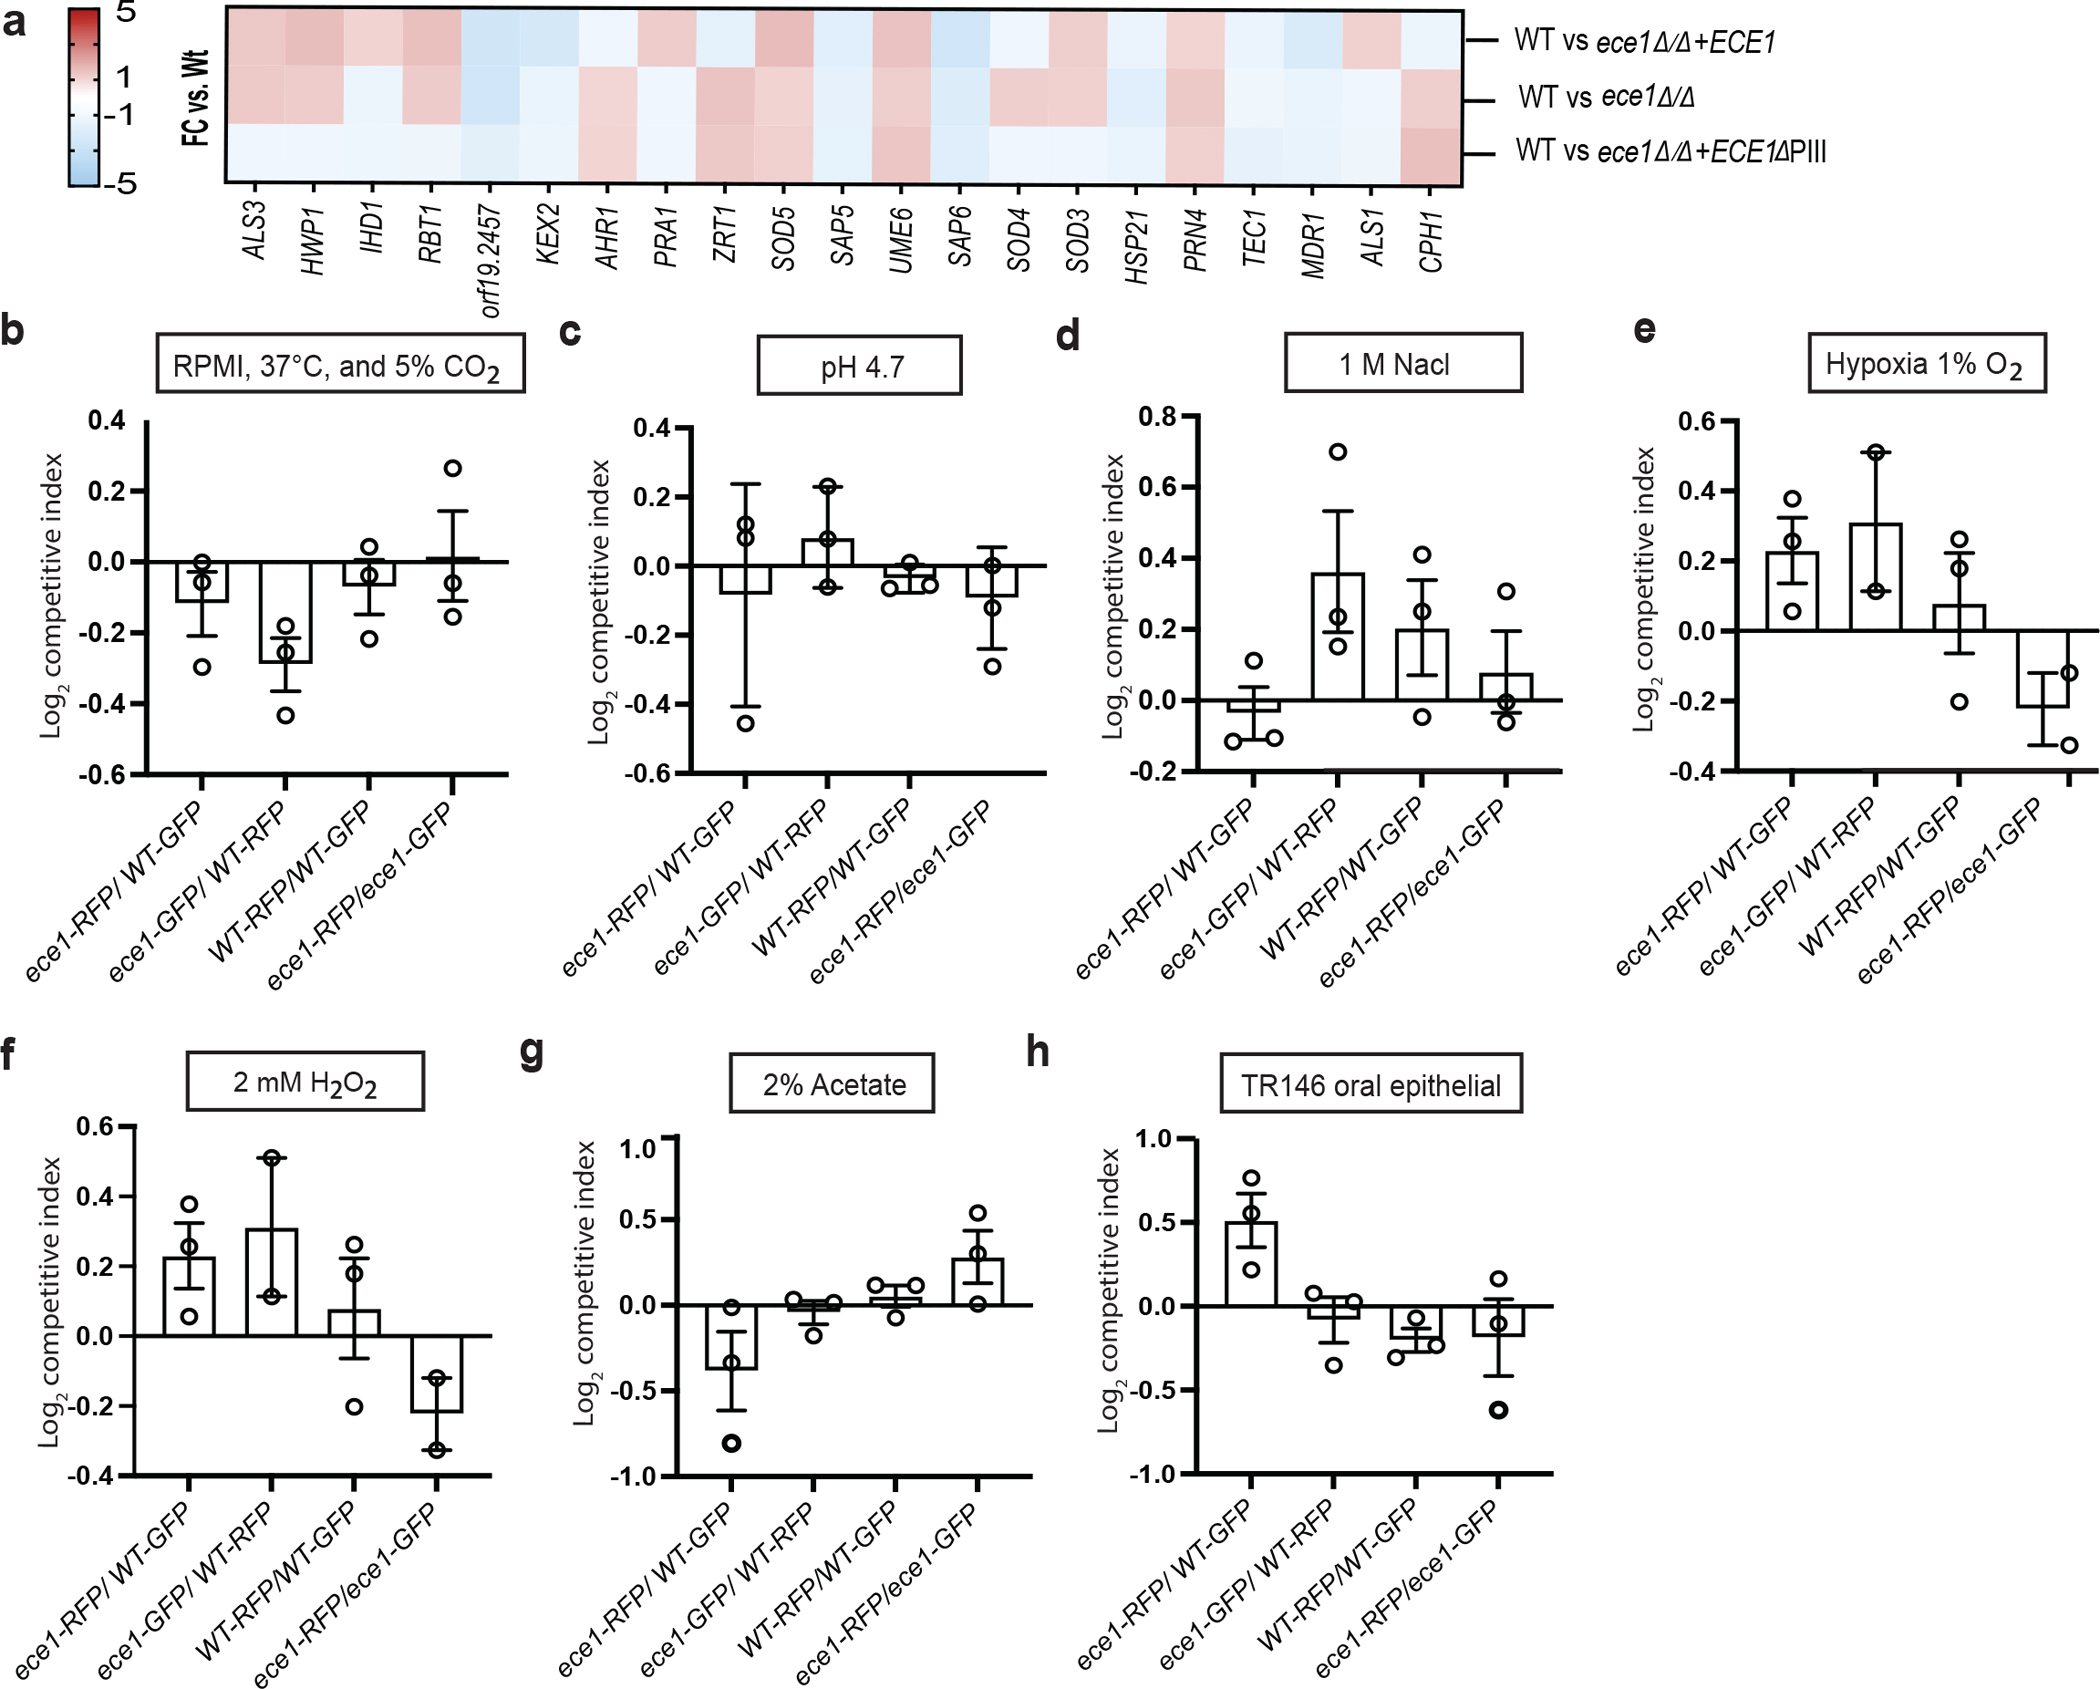
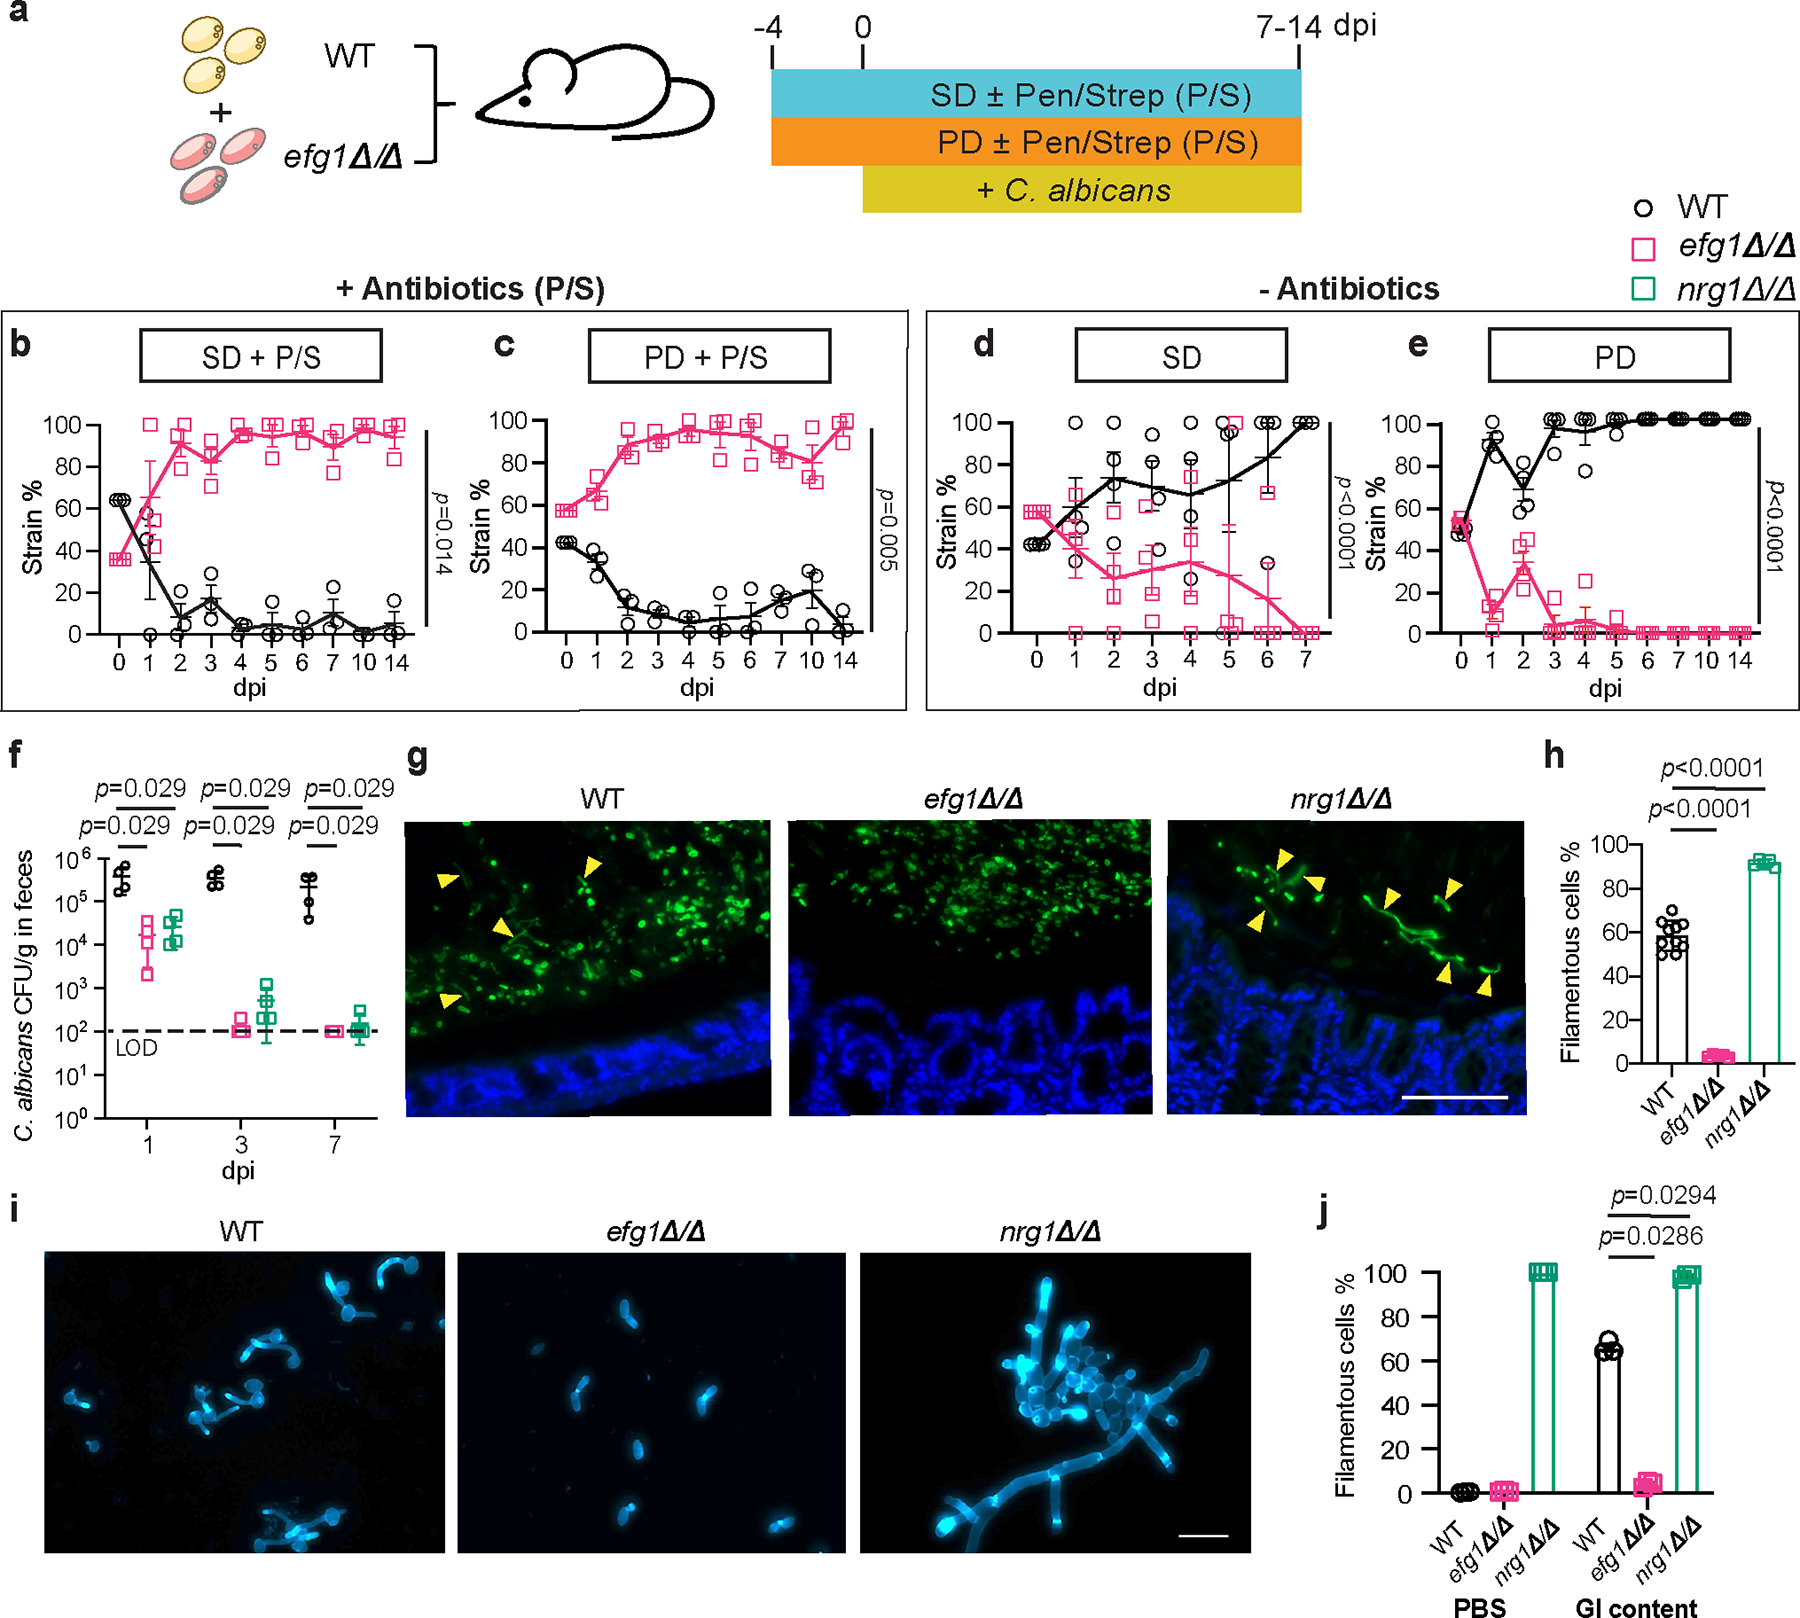
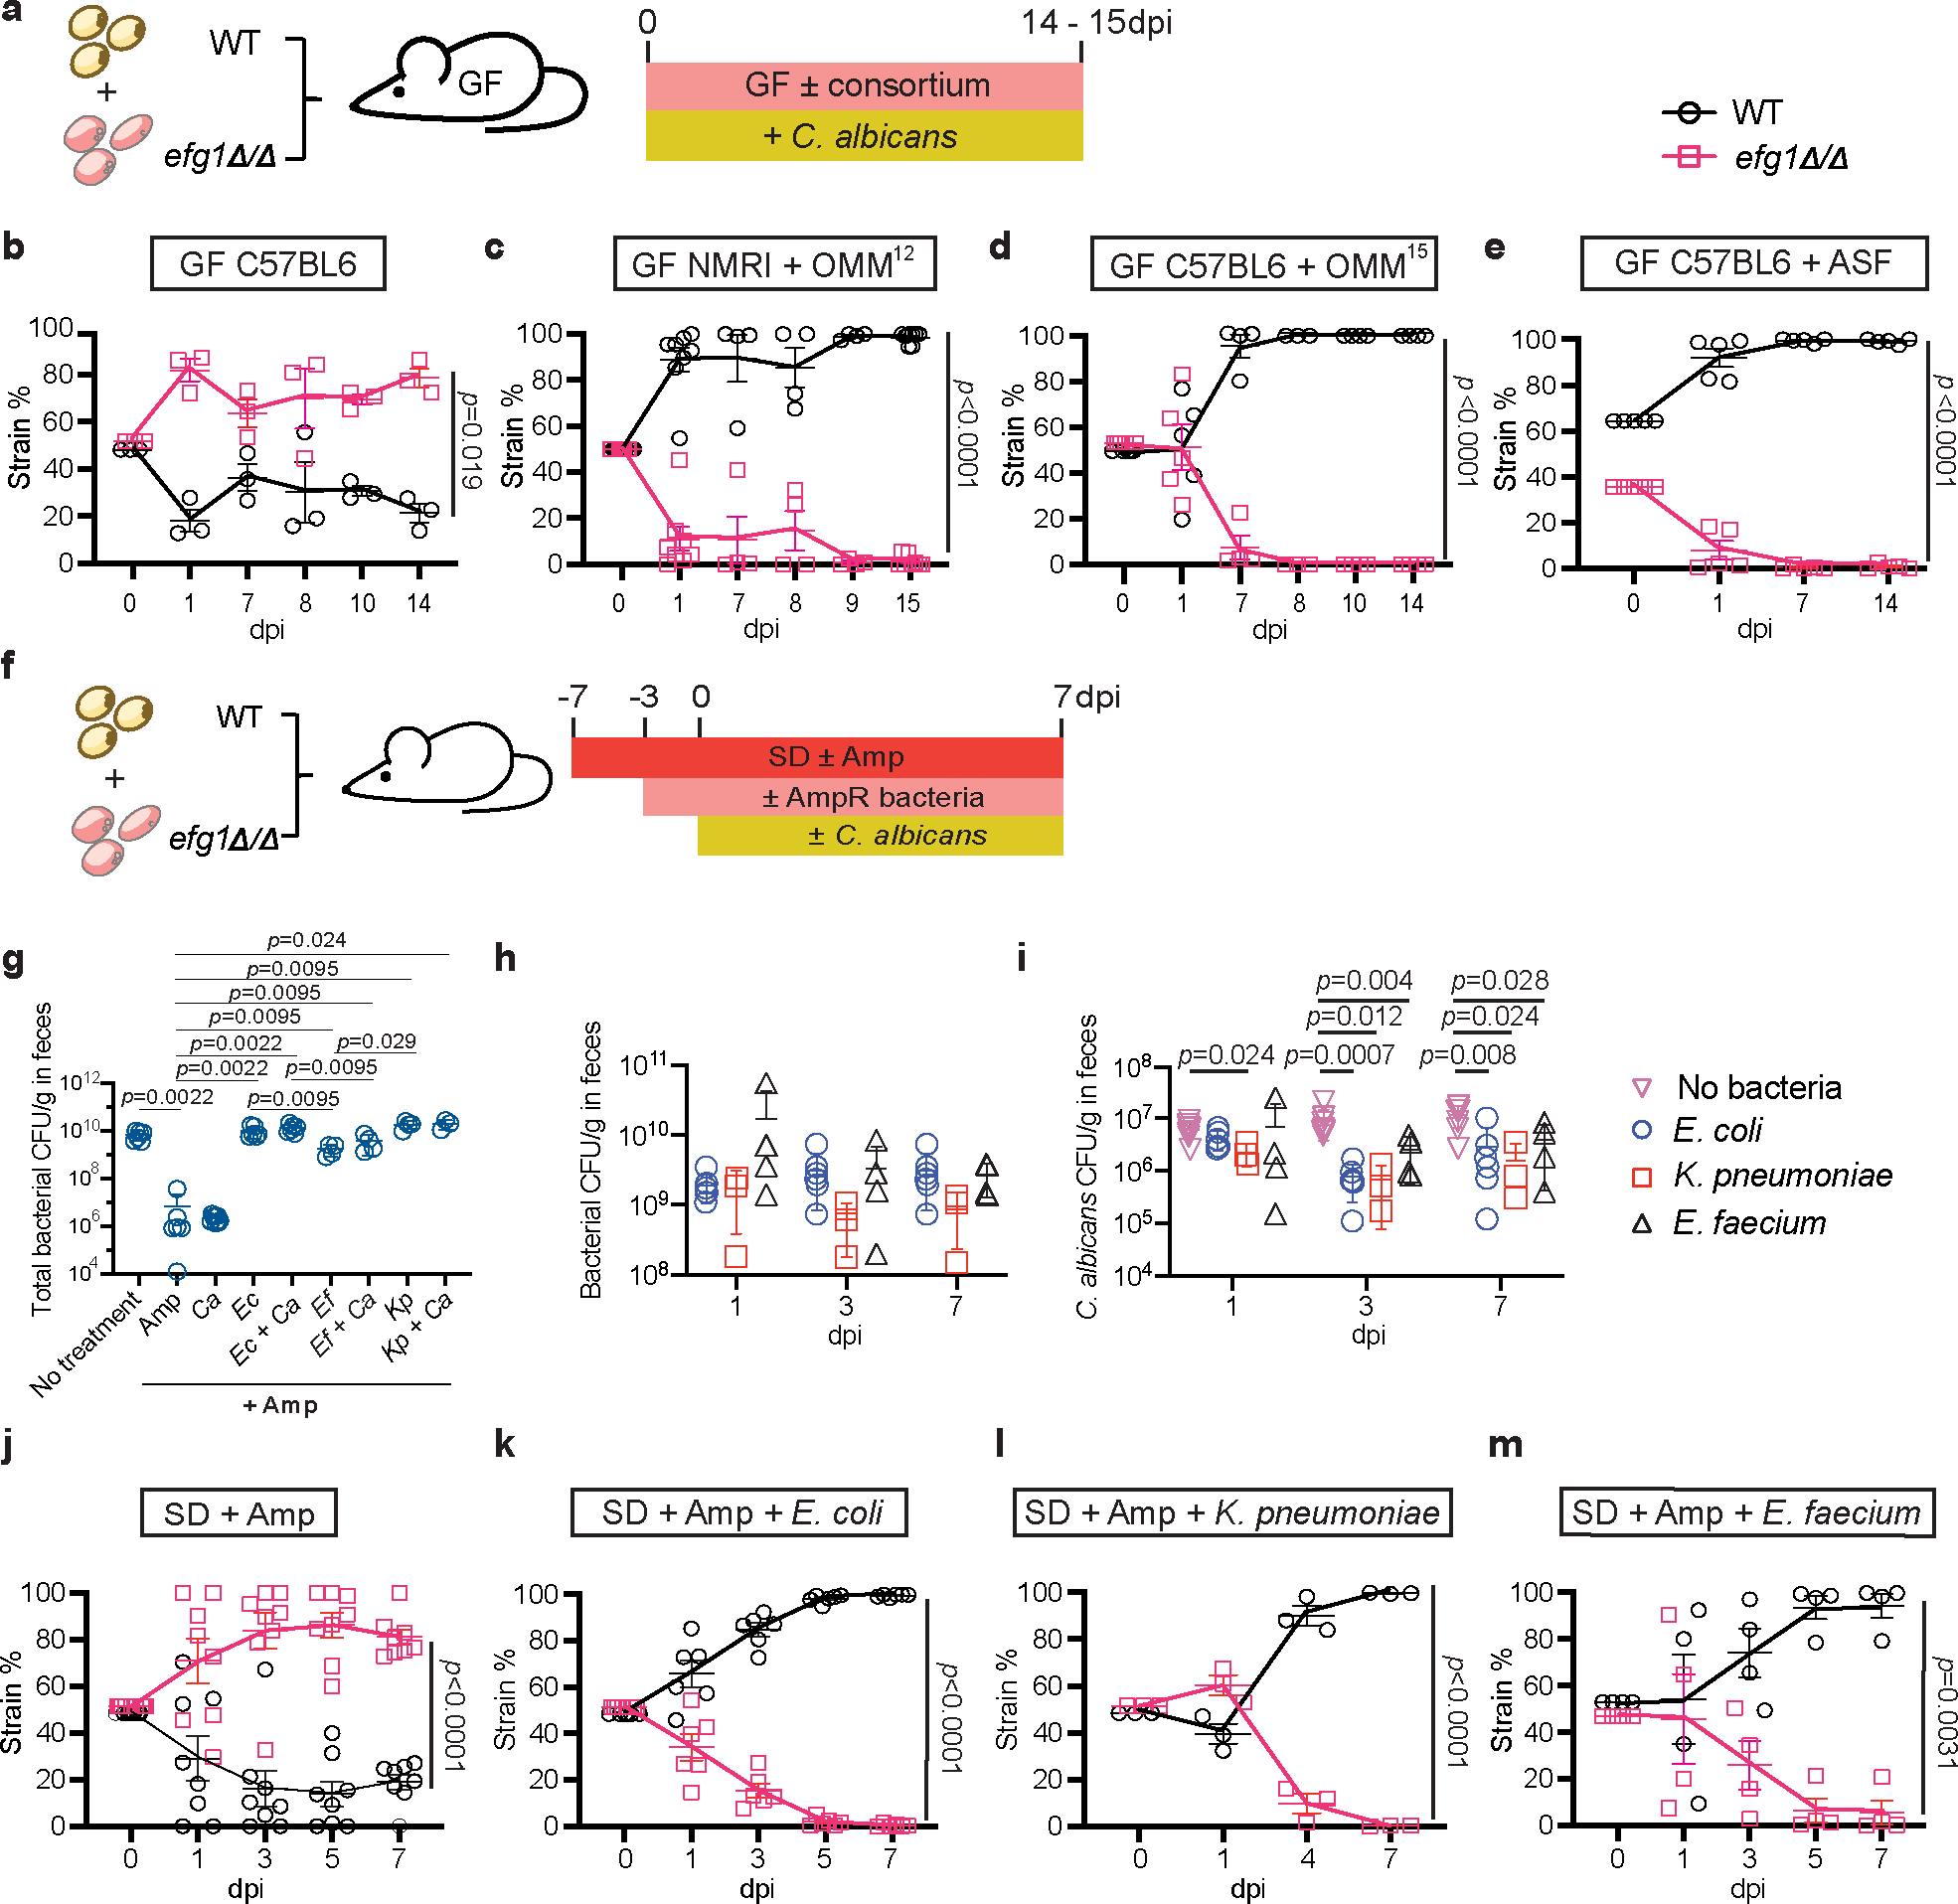
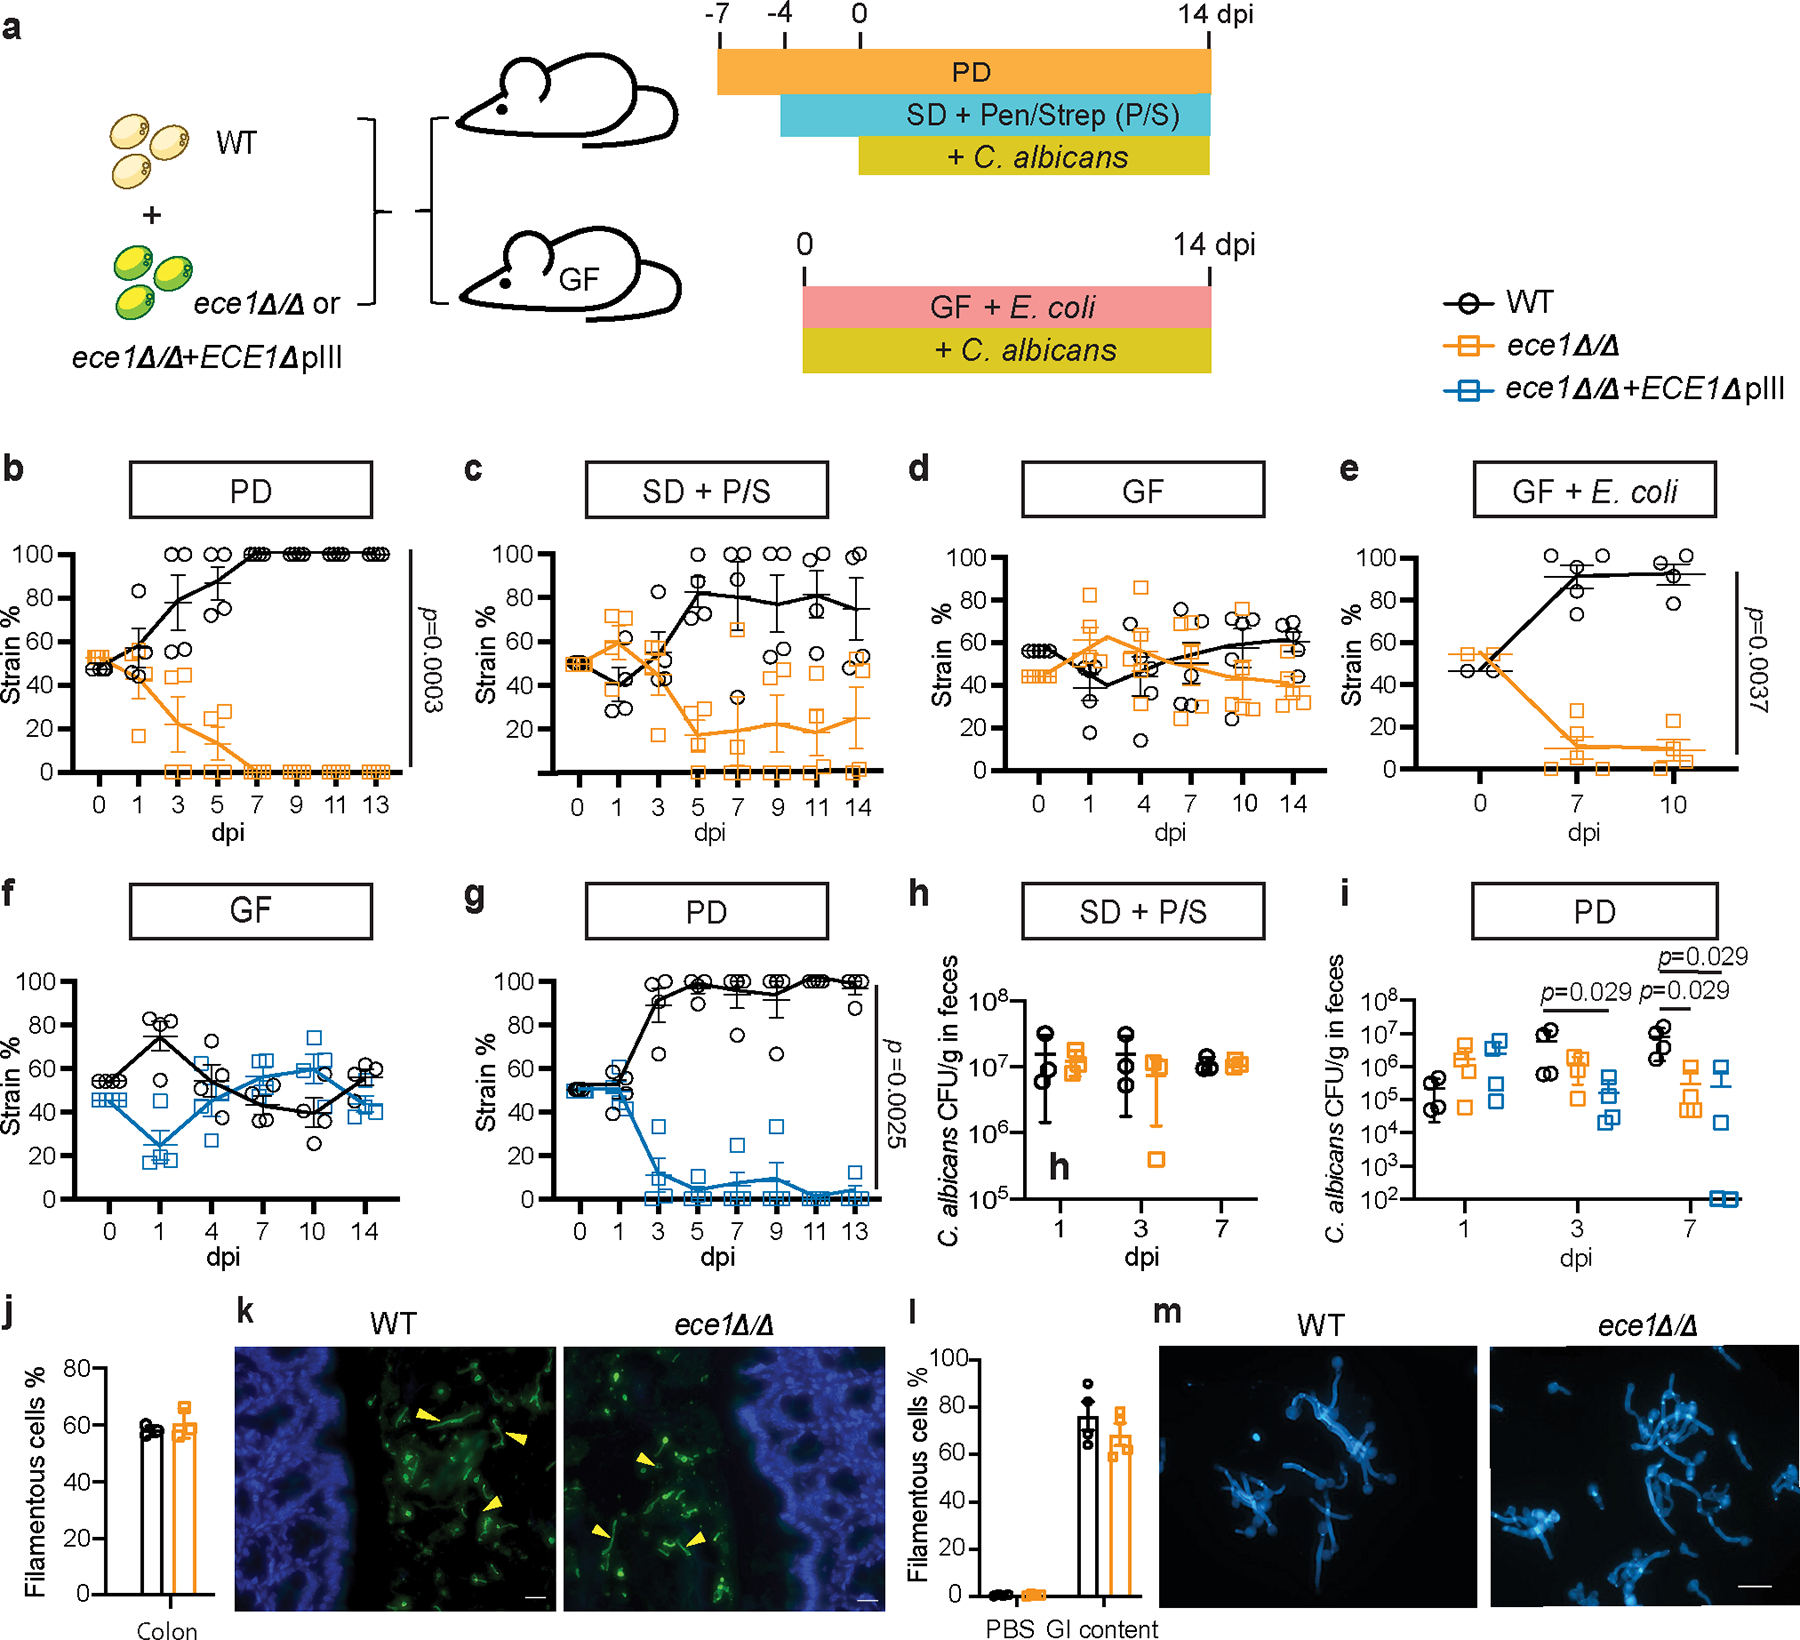
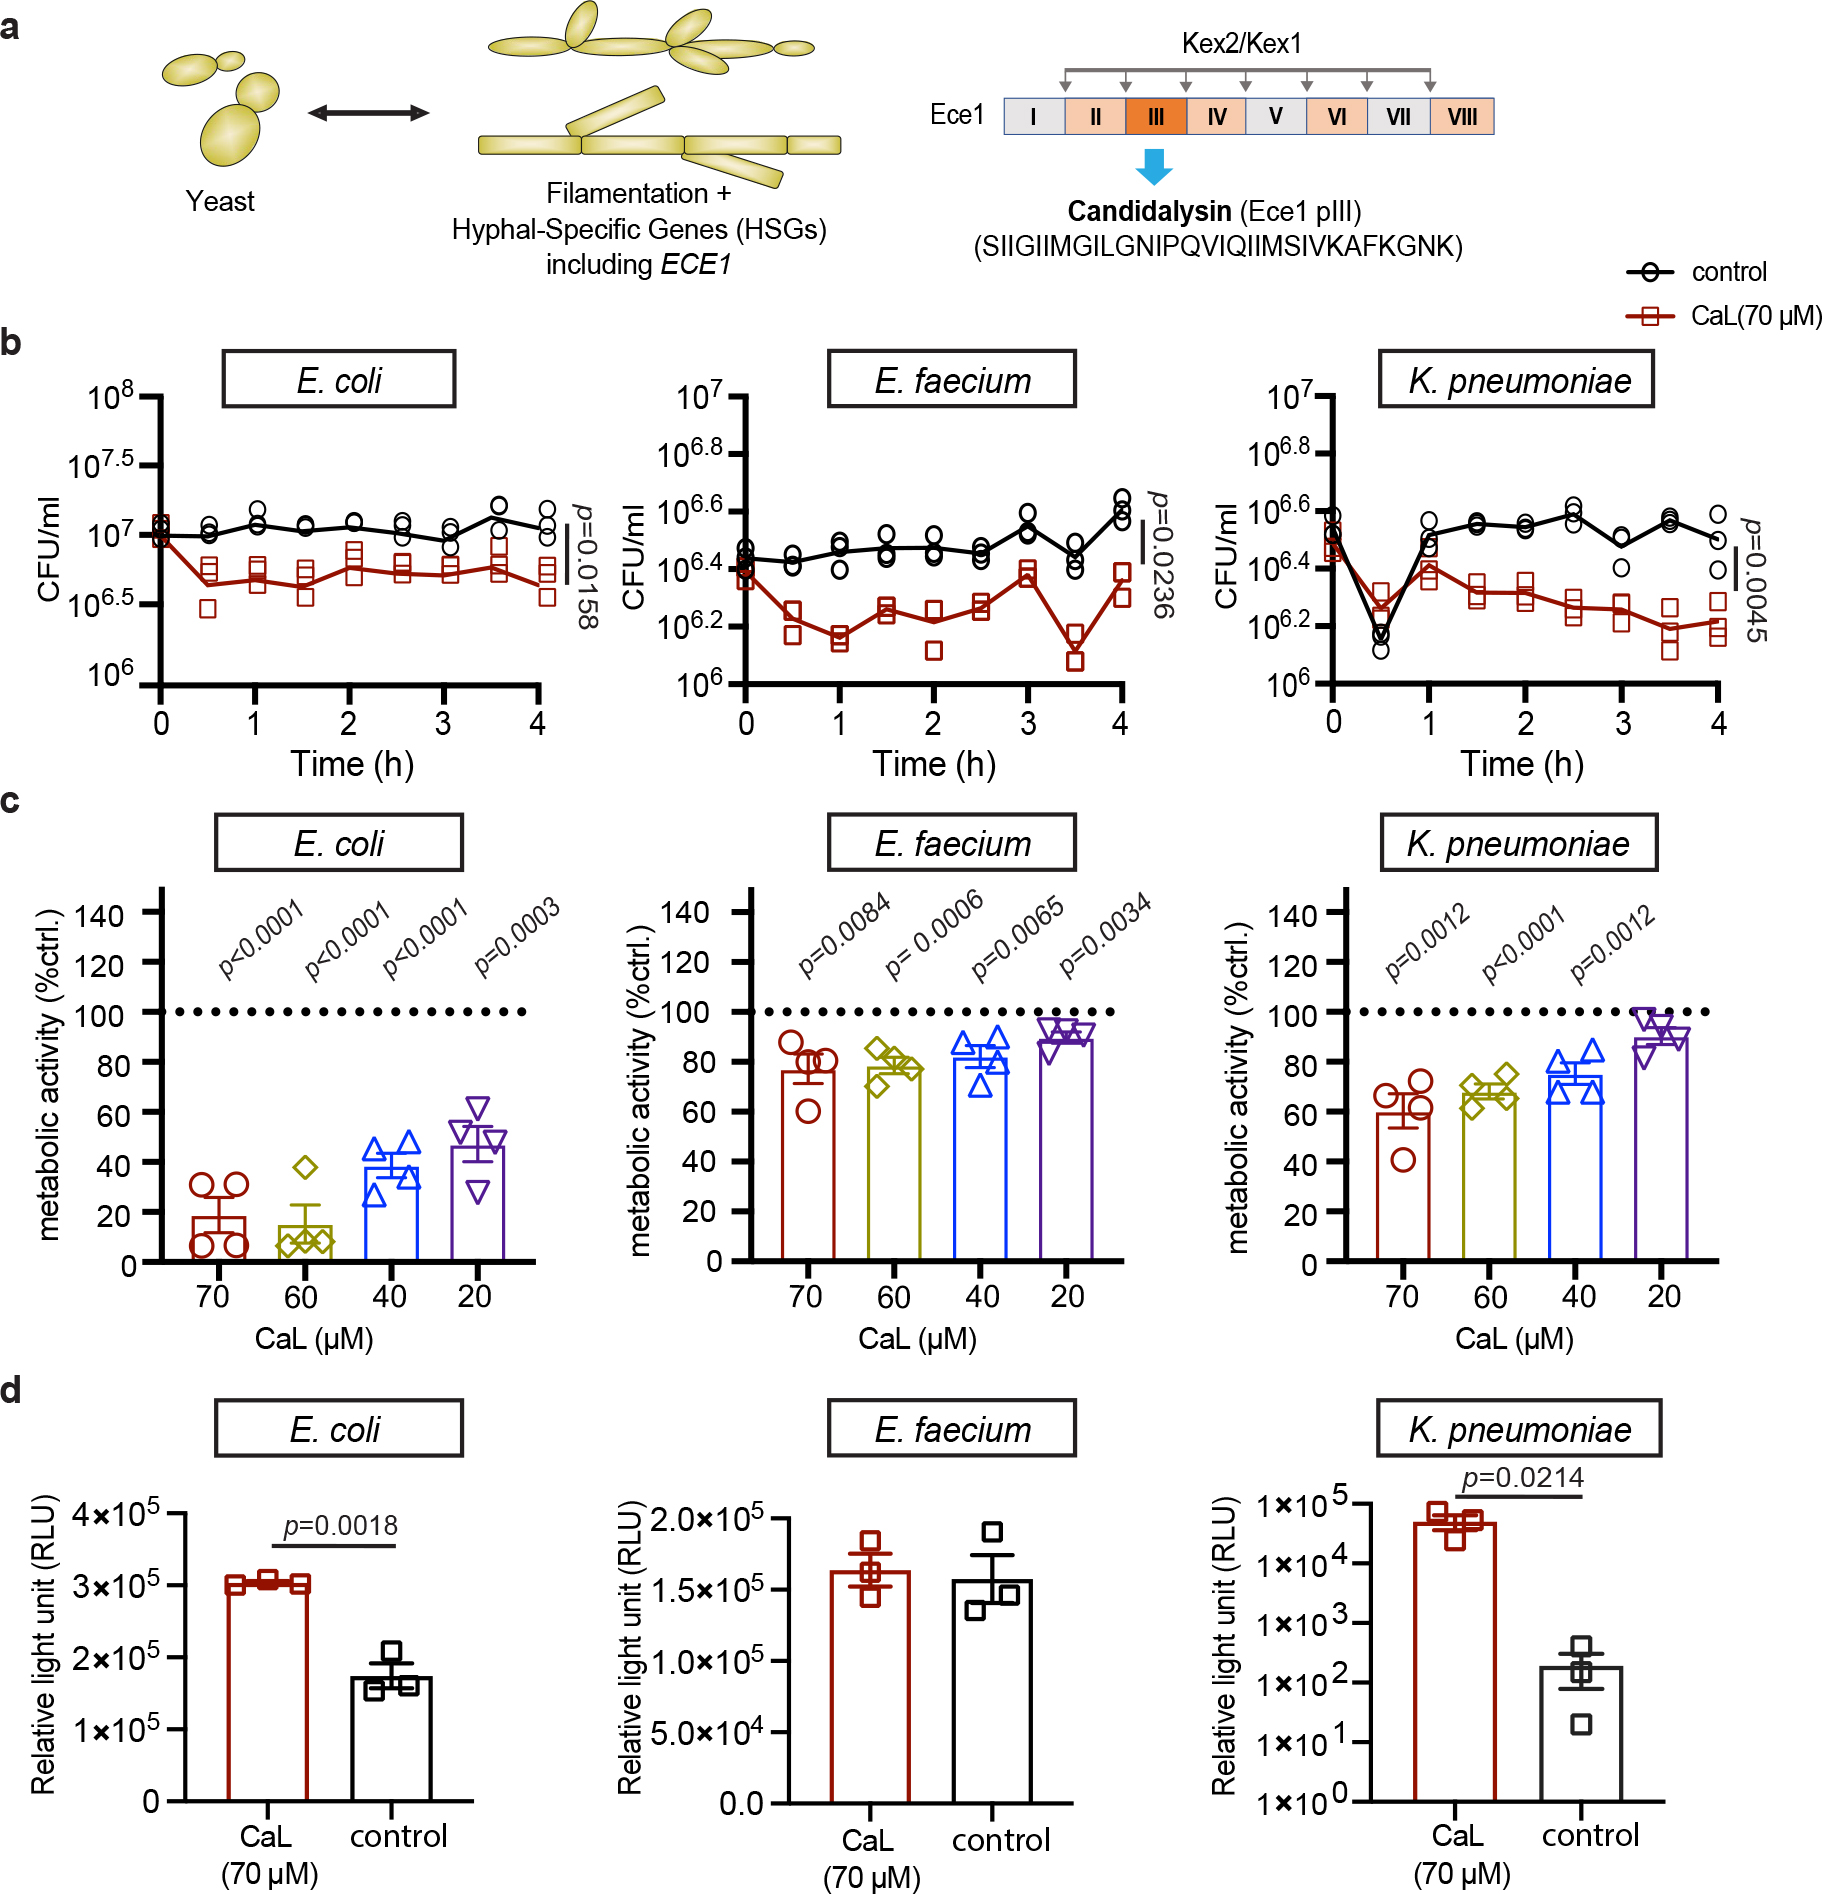
The fungus Candida albicans frequently colonizes the human gastrointestinal tract, from which it can disseminate to cause systemic disease. This polymorphic species can transition between growing as single-celled yeast and as multicellular hyphae to adapt to its environment. The current dogma of C. albicans commensalism is that the yeast form is optimal for gut colonization, whereas hyphal cells are detrimental to colonization but critical for virulence1-3. Here, we reveal that this paradigm does not apply to multi-kingdom communities in which a complex interplay between fungal morphology and bacteria dictates C. albicans fitness. Thus, whereas yeast-locked cells outcompete wild-type cells when gut bacteria are absent or depleted by antibiotics, hyphae-competent wild-type cells outcompete yeast-locked cells in hosts with replete bacterial populations. This increased fitness of wild-type cells involves the production of hyphal-specific factors including the toxin candidalysin4,5, which promotes the establishment of colonization. At later time points, adaptive immunity is engaged, and intestinal immunoglobulin A preferentially selects against hyphal cells1,6. Hyphal morphotypes are thus under both positive and negative selective pressures in the gut. Our study further shows that candidalysin has a direct inhibitory effect on bacterial species, including limiting their metabolic output. We therefore propose that C. albicans has evolved hyphal-specific factors, including candidalysin, to better compete with bacterial species in the intestinal niche.


Conflict of interest statement

Competing interests

No competing interests noted.

Figures

Extended Data Fig. 1|
Extended Data Fig. 1|. Comparison of the fitness of WT and yeast-locked efg1Δ/Δ cells from different C. albicans strain backgrounds.
a, Experiments were performed as described in Fig.1. Mouse GI organs (St; stomach, Si; small intestine, Duo; duodenum, Je; jejunum, Ile; ileum, Ce; cecum, Co; colon) were homogenized to identify WT and efg1Δ/Δ cells 14 days post-C. albicans inoculation. WT (CAY2698) versus efg1Δ/Δ (CAY11750) competitions in SD+P/S (P/S; penicillin/streptomycin) model (a), PD+P/S model (b) and PD model (c). dpi; days post-inoculation. d, Schematic of competition between WT and yeast-locked efg1Δ/Δ cells. Mice fed the SD without antibiotics were gavaged with a 1:1 mixture of WT and efg1Δ/Δ cells and C. albicans colonies were examined in fecal pellets at the indicated time points. e,f, Competition outcomes (e) and fecal CFUs (f) of WT versus efg1Δ/Δ in 529L (CAY5016 versus CAY11482) and CHN1 (CAY11170 versus CAY11184). Experiments were performed in BALB/c and C57BL/6J mice as indicated. Each data point represents an individual mouse, data are mean ± s.e.m in a, b, and f. n = 3 for competitions in BALB/c mice and n = 4 for competitions in C57BL/6J mice. A paired t-test (two-tailed) was used in e and a Mann-Whitney (two-tailed) test in f.
Extended Data Fig. 2|
Extended Data Fig. 2|. Comparison of the fitness of WT and flo8Δ/Δ cells in different colonization models.
a, Microscopic images of cells in the colon of BALB/c SD+P/S mice infected with WT (CAY2698) or flo8Δ/Δ (CAY9796) cells at 7 days post-infection. b, Quantitative analysis of yeast and filamentous morphotypes. n = 2. c, Schematic of competition between WT and flo8Δ/Δ cells. n = 2. Each data point represents an individual mouse. A 1:1 mix of WT and flo8Δ/Δ cells were inoculated by oral gavage and fecal samples were collected at the indicated time points. d-f, Results for SC5314 WT (CAY2698) versus flo8Δ/Δ (CAY9796) cells in GF BALB/c mice (d), conventional PD-fed BALB/c mice treated with antibiotics (P/S; penicillin/streptomycin) (e), and conventional PD-fed BALB/c mice (without antibiotics) (f). dpi; days post-inoculation. n = 3 in e and f. g-i, Competition of WT versus flo8Δ/Δ cells in BALB/c mice fed a SD (without antibiotics).. Experiments were performed using SC5314 (CAY2698 vs. CAY9796) (g), 529L (CAY11168 vs. CAY11180) (h), or CHN1 (CAY11170 vs. CAY11186) (i) strain backgrounds. n = 3. Each data point represents an individual mouse. Data are mean ± s.e.m in b. Significance was determined by a Mann-Whitney (two-tailed) test in b and a paired two-tailed t-test in d-i.
Extended Data Fig. 3|
Extended Data Fig. 3|. Analysis of microbiome composition upon changes in diet, antibiotic treatment, and C. albicans colonization.
a, Schematic of colonization experiments. BALB/c mice were fed the SD or PD, with or without antibiotics (P/S; penicillin/streptomycin). These groups were compared with and without colonization with C. albicans SC5314 cells. b, C. albicans CFUs in fecal pellets collected at the indicated time points. LOD, limit of detection. n = 8. c,d, Total bacterial levels in fecal pellets collected at the indicated time points by quantitative PCR in SD- or PD-fed mice with antibiotics (c) and without antibiotics (d). n = 8. e, Bubble plot depicting the amount of variation in gut microbial composition determined by Permutational Multivariate Analysis of Variance (PERMANOVA) analysis using the adonis function and Bray-Curtis distances of beta diversity. Effect size refers to the magnitude of the differences or dissimilarities between groups. f, Shannon diversity of control mice on SD or PD (n = 8). g-m, Distribution of bacterial phyla in different models as determined by MaAsLin2. PD vs. SD (g), SD vs. SD+P/S (h), PD vs. PD+P/S (i); (+/− C. albicans) SD (j), PD (k), PD+P/S (l) and SD+P/S (m). Coefficient with standard error shown on x-axis. adj p-val cutoff 0.05. n, Relative abundance of Actinobacteria across different diet fed mice (+/− Candida) groups on Day 21. n = 8. Each data point represents an individual mouse. Data are mean ± s.e.m in b-m. A Mann-Whitney test was used in b,f,and n.
Extended Data Fig. 4|
Extended Data Fig. 4|. Linear discriminant analysis Effect Size (LEfSe) analysis to compare the alterations in gut bacterial populations in mice on different diets.
Linear discriminant analysis (LDA) effect size for significant taxa in the microbiome of mice fed the SD vs. PD are plotted onto a cladogram for Day 0 (a), Day 7 (b), Day 14 (c), Day 21 (d). and for mice fed the PD (+/− C. albicans) for Day 0 (e), Day 7 (f), Day 14 (g) and Day 21 (h). Analysis was performed on mice as shown in Extended Data Fig. 3 (n=8 per group). Differentially abundant species with LDA score >2 are shown in nodes represented with red (PD) and green (SD) and non-significant species are represented with yellow. A Kruskal-Wallis test was used to compare features between diets (p<0.05) and the Pairwise Wilcoxon test was used to compare between taxa (p<0.05).
Extended Data Fig. 5|
Extended Data Fig. 5|. Analysis of gut bacterial populations in different murine models.
16S rRNA sequencing data was used to determine the relative abundance of bacterial phyla in BALB/c colonization experiments using mice fed the SD or PD, and supplemented or not supplemented with antibiotics (P/S; penicillin/streptomycin). Each group of mice were also compared +/− inoculation with C. albicans SC5314 cells, as shown in Extended Data Fig. 3. a,b, Shannon diversity for bacterial populations from fecal pellets for the shown experiments. n = 8. c, Relative abundance of bacteria shown for fecal pellets on days 0, 10, 14, and 21, and for the small intestine at day 21. n = 8. Data are mean ± s.e.m in a-c.
Extended Data Fig. 6|
Extended Data Fig. 6|. C. albicans WT cells outcompete efg1Δ/Δ cells in gnotobiotic mice harboring different bacterial populations.
a, Schematic of competition between WT and yeast-locked efg1Δ/Δ cells in gnotobiotic colonization models. Mice were gavaged with a 1:1 mixture of WT SC5314 (CAY2698) and efg1Δ/Δ (CAY11750) cells. b-d, C. albicans cells were tested in GF BALB/c mice (b), GF NMRI mice (c), or GF C57BL/6 mice colonized with E. coli prior to inoculation with C. albicans (d). n = 4 in b, 8 in c, and 5 in d. e, C. albicans CFUs in fecal pellets collected at the indicated time points in GF NMRI mice (e) and GF C57BL/6 mice (f). n = 8 in e, n = 3–5 in f. LOD, limit of detection. g, WT v. efg1Δ/Δ competition in Amp-treated mice gavaged with heat-killed AmpR E. coli. n = 4. h,i, Competition between CHN1 WT (CAY11170) and efg1Δ/Δ (CAY11184) cells in WT mice (h) or Rag1−/− mice (i) on the SD (no antibiotics). n = 4. j, C. albicans CFU levels in the fecal pellets from WT and Rag1−/− mice. n = 4. Each data point represents an individual mouse. Data are mean ± s.e.m in j. A paired t-test (two-tailed) was used in b-d and g-i, and a Mann-Whitney (two-tailed) test in e,f and j.
Extended Data Fig.7|
Extended Data Fig.7|. Examining the role of ALS3 and SOD5 in GI colonization fitness.
a, Schematic of competition between WT C. albicans and sod5Δ/Δ or als3Δ/Δ cells (SC5314 background). b-e, BALB/c mice fed a PD without antibiotics or a SD with antibiotics (P/S; penicillin/streptomycin). Experiments used WT (CAY8785) and sod5Δ/Δ (CAY14738) in b and c. n = 4. WT (CAY8785) and als3Δ/Δ (CAY14696) in d and e. n = 8. Each data point represents an individual mouse. A paired t-test (two-tailed) was used for statistical significance.
Extended Data Fig. 8|
Extended Data Fig. 8|. Colonization fitness of WT and ece1Δ/Δ mutants.
Experiments were performed as described in Fig. 4. Mouse GI organs (St; stomach, Si; small intestine, Duo; duodenum, Je; jejunum, Ile; ileum, Ce; cecum, Co; colon) were homogenized to identify the ratio of WT and ece1Δ/Δ cells 14 days post C. albicans infection. b, Competition between CAY11533 (WT) versus CAY11507 (ece1Δ/Δ) cells in BALB/c fed a PD. n = 5. c, Competition between WT (CAY11168) and ece1Δ/Δ cells (CAY12441) in the 529L background BALB/c mice fed a PD. n = 4. d, Competition between WT (CAY11170) and ece1Δ/Δ cells (CAY12446) in the CHN1 background in SD-fed BALB/c mice. n = 4. e-g, Competition between CAY12202 (WT) versus CAY8578 (ece1Δ/Δ) BALB/c mice fed a SD plus antibiotics (P/S; penicillin/streptomycin) (e), GF C57BL/6 mice (f), and GF C57BL/6 mice colonized with E. coli prior to C. albicans inoculation (g). n = 4 in e, and 5 in f and g. Competition outcomes of WT (CAY12202) versus ece1Δ/Δ+ECE1ΔpIII (CAY8580) in GF C57BL/6 mice (h) and in BALB/c mice fed a PD (i). n = 4 in h and i. Each data point represents an individual mouse. Data are mean ± s.e.m in ce, h, i. A paired t-test (two-tailed) was used to determine the significance between two populations (b-h).
Extended Data Fig. 9|
Extended Data Fig. 9|. Comparison of C. albicans WT and ece1Δ/Δ cells in vitro.
a, Heat map of transcriptome analysis representing the fold change (FC) in expression of fungal genes when strains were grown under hyphal-inducing conditions (3 h, 37°C, 5% CO2). b-h, Competitive fitness of SC5314 WT and ece1Δ/Δ cells in RPMI (37°C, 5% CO2) (b), acidic pH (pH 4.7) (c), high salt (1 M NaCl) (d), hypoxia (1% O2) (e), oxidative stress (2 mM H2O2) (f), in the presence of 1% acetate (g), and during incubation with TR146 epithelial cells (h). Competitive index was calculated using the formula: log2 [(MUTcompetition/WTcompetition)/ (MUTsingle/WTsingle)]. Fitness of the ece1Δ/Δ relative to the WT is represented as log2 competitive index. Data are representative of three biological replicates (n = 3). Graphs show the mean ± SEM in b - h. Statistical analysis was performed using 1-way ANOVA with Bonferroni post hoc test to detect significance.
Fig. 1|
Fig. 1|. The colonization fitness of C. albicans WT and yeast-locked cells is dependent on the murine model.
a, Schematic of C. albicans colonization models. BALB/c mice were gavaged with a 1:1 mixture of WT and efg1Δ/Δ cells (or EFG1/efg1Δ and efg1Δ/Δ cells) while fed a standard diet (SD) or a purified diet (PD). Drinking water was supplemented with antibiotics (P/S; penicillin/streptomycin) as indicated. C. albicans colonies were examined in fecal pellets at the indicated time points (dpi; days post inoculation). b-e, WT (CAY2698) versus efg1Δ/Δ (CAY11750) competition in SD+P/S model (b), PD+P/S model (c), or SD model (d). EFG1/efg1Δ (CAY7064) and efg1Δ/Δ (CAY7769) were competed in the PD model (e). f, PD-fed mice were colonized with C. albicans and colony forming units (CFUs)/g in fecal pellets were determined. LOD, limit of detection. n = 4. g, Analysis of cell morphology of WT SC5314, efg1Δ/Δ and nrg1Δ/Δ cells. C. albicans cells were stained with anti-Candida antibody (green), while epithelial cells were stained with DAPI (blue) in the SD+P/S model. Scale bar, 100 μm. h, Quantitative analysis of yeast and filamentous morphotypes from colonic sections (C57BL6 mice), SD+P/S model. For WT, n = 10; efg1Δ/Δ, n = 5; nrg1Δ/Δ, n = 5. WT, CAY2698; efg1 Δ/Δ, CAY10965; nrg1Δ/Δ, CAY1398. i, Analysis of cell morphology of WT SC5314, efg1Δ/Δ and nrg1Δ/Δ cells cultured at 37°C in cecal contents from PD-fed BALB/c mice. Scale bar, 20 μm. j, Quantitative analysis of yeast and filamentous morphotypes in cecal contents in (i). n = 3. Data are presented as mean ± s.e.m, each data point represents an individual mouse. For j, each data point represents individual experiments. Paired t-test (two-tailed) in b-e; Mann-Whitney (two-tailed) test in f,h and j.
Fig. 2|
Fig. 2|. Colonization fitness of WT and yeast-locked C. albicans cells in hosts harboring different bacterial populations.
a, Schematic of gut colonization assays in gnotobiotic hosts that are germ-free (GF) or harbor different bacterial consortia. Mice were inoculated with a 1:1 mixture of WT and yeast-locked efg1Δ/Δ (CAY11750) cells (SC5314 background). b-d, Competition outcomes in GF C57BL/6 mice (b), NMRI mice harboring the Oligo-OMM12 consortium (c), C57BL/6 mice harboring the Oligo-OMM15 consortium (d), or those harboring the ASF consortium (e). f, Schematic of competition experiments using SD-fed mice supplemented with ampicillin (Amp). Mice were colonized with ampicillin-resistant (AmpR) bacteria prior to gavage with C. albicans or given C. albicans without bacteria. g, Total bacterial levels in fecal pellets were determined by quantitative PCR. No treatment; samples collected prior to Amp supplementation. Ec; E. coli, Ef; E. faecium, Kp; K. pneumoniae. h,i, Bacterial (h) and C. albicans (i) CFUs were examined in fecal pellets at 1, 3, and 7 dpi. n = 8 in Amp-treated mice without bacteria, n = 6 in mice with E. coli, n = 3 in mice with K. pneumoniae, n = 4 in mice with E. faecium, and n = 6 in mice with no treatment. j, WT v. efg1Δ/Δ competition in Amp-treated mice. n = 8. k-m, Competitions performed in Amp-treated mice pre-colonized with AmpR E. coli (k), K. pneumoniae (l), or E. faecium (m). n = 6 in k, n = 3 in l, n = 4 in m. Each data point represents an individual mouse. Data are presented as mean ± s.e.m in b-e and g-m. A paired t-test (two-tailed) was used in b-e and j-m and Mann-Whitney (two-tailed) test in g-i.
Fig. 3|
Fig. 3|. Candidalysin promotes C. albicans colonization in mice harboring intact (antibiotic-naïve) bacterial microbiomes.
a, Experimental design of C. albicans WT versus ece1Δ/Δ or ece1Δ/Δ+ECE1ΔpIII in conventional or gnotobiotic hosts. b-e, Competition between WT and ece1Δ/Δ cells in PD-fed BALB/c mice (b), SD-fed BALB/c mice on penicillin/streptomycin (P/S) antibiotics (c), GF C57BL/6 mice (d), and GF C57BL/6 mice pre-colonized with E. coli (e). WT (CAY12202) versus ece1Δ/Δ (CAY8578) in b, CAY11533 (WT) versus CAY11507 (ece1Δ/Δ) in b. n = 4 in b, n = 5 in c-e. f,g, Competitions between WT (CAY12202) and ece1Δ/Δ+ECE1ΔpIII (CAY8580) in GF C57BL/6 mice (f) and PD-fed BALB/c mice (g). n = 4. h, Colonization levels of WT (CAY2698) and ece1Δ/Δ (CAY8785) strains individually colonizing SD+P/S mice. n = 3. i, Colonization levels of WT (CAY2698), ece1Δ/Δ (CAY8785) and ece1Δ/Δ+ECE1ΔpIII (CAY8580) strains individually colonizing PD-fed mice. n = 4. j, k, Analysis of cells in the colon of BALB/c SD+P/S mice infected with WT (CAY2698) or ece1Δ/Δ (CAY8785) cells at 7 days post-infection. Percentage of filamentous cells (j). n = 3. Microscopic images (k). Hyphal cells indicated by arrows. Scale bar, 20 μm. l, m, Analysis of cell morphology of WT (CAY2698) and ece1Δ/Δ (CAY8785) cells cultured at 37°C in cecal contents from PD-fed BALB/c mice, n = 4. Quantitative analysis of yeast and filamentous morphotypes (l). Microscopic images (m). Scale bar, 50 μm. Each data point represents an individual mouse. Data are presented as mean ± s.e.m for b-j and l. For l, each data point represents individual experiments. A paired t-test (two-tailed) was used in b-g, a Mann-Whitney (two-tailed) test in h, i, j and an unpaired t-test (two-tailed) in l.
Fig. 4|
Fig. 4|. Candidalysin peptide exhibits direct antibacterial activity.
a, C. albicans can grow as yeast or filamentous forms including pseudophyphae or true hyphae. Hyphal cells express a set of hyphal-specific genes (HSGs) that include ECE1 encoding the candidalysin toxin. The Ece1 proprotein is proteolytically processed by Kex2 and Kex1 to produce mature candidalysin peptide (CaL). b, Analysis of E. coli, E. faecium, and K. pneumoniae colony forming units (CFUs) when challenged with 70 μM CaL in PBS at 37°C for the indicated times. n = 3. c, Effect of candidalysin on bacterial metabolism as determined by XTT assays. Activity is shown as a ratio of the no candidalysin control (dotted line), n = 4. d, Effect of different concentrations of candidalysin on glucose uptake, n = 3. Data are presented as mean ± s.e.m, each data point represents individual independent experiments. An unpaired t-test (two-tailed) was used to determine significance (b-d).

Similar articles

Cited by

References

    1. Ost KS et al. Adaptive immunity induces mutualism between commensal eukaryotes. Nature 596, 114–118, doi: 10.1038/s41586-021-03722-w (2021). - DOI - PMC - PubMed
    1. Tso GHW et al. Experimental evolution of a fungal pathogen into a gut symbiont. Science 362, 589–595, doi: 10.1126/science.aat0537 (2018). - DOI - PubMed
    1. Witchley JN et al. Candida albicans morphogenesis programs control the balance between gut commensalism and invasive infection. Cell Host Microbe 25, 432–443 e436, doi: 10.1016/j.chom.2019.02.008 (2019). - DOI - PMC - PubMed
    1. Moyes DL et al. Candidalysin is a fungal peptide toxin critical for mucosal infection. Nature 532, 64–68, doi: 10.1038/nature17625 (2016). - DOI - PMC - PubMed
    1. Li XV et al. Immune regulation by fungal strain diversity in inflammatory bowel disease. Nature, doi: 10.1038/s41586-022-04502-w (2022). - DOI - PMC - PubMed

Additional references

    1. Dewhirst FE et al. Phylogeny of the defined murine microbiota: altered Schaedler flora. Appl Environ Microbiol 65, 3287–3292, doi: 10.1128/AEM.65.8.3287-3292.1999 (1999). - DOI - PMC - PubMed
    1. Guthrie C & Fink GR Guide to Yeast Genetics and Molecular Biology. (Academic Press, 1991).
    1. Liu H, Kohler J & Fink GR Suppression of hyphal formation in Candida albicans by mutation of a STE12 homolog. Science 266, 1723–1726 (1994). - PubMed
    1. Park SO, Frazer C & Bennett RJ An adjuvant-based approach enables the use of dominant HYG and KAN selectable markers in Candida albicans. mSphere 7, e0034722, doi: 10.1128/msphere.00347-22 (2022). - DOI - PMC - PubMed
    1. Reuss O, Vik A, Kolter R & Morschhauser J The SAT1 flipper, an optimized tool for gene disruption in Candida albicans. Gene 341, 119–127 (2004). - PubMed

MeSH terms

LinkOut - more resources