. 2024 Mar 6;7(1):276.
doi: 10.1038/s42003-024-05924-0.

ST3 beta-galactoside alpha-2,3-sialyltransferase 1 (ST3Gal1) synthesis of Siglec ligands mediates anti-tumour immunity in prostate cancer

Affiliations

ST3 beta-galactoside alpha-2,3-sialyltransferase 1 (ST3Gal1) synthesis of Siglec ligands mediates anti-tumour immunity in prostate cancer

Rebecca Garnham et al. Commun Biol. .

Abstract

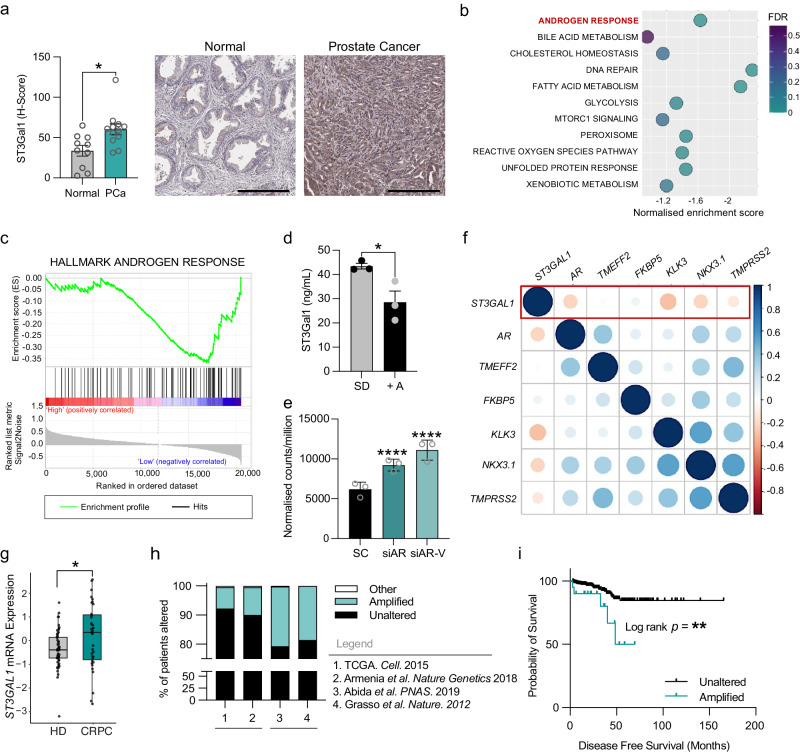
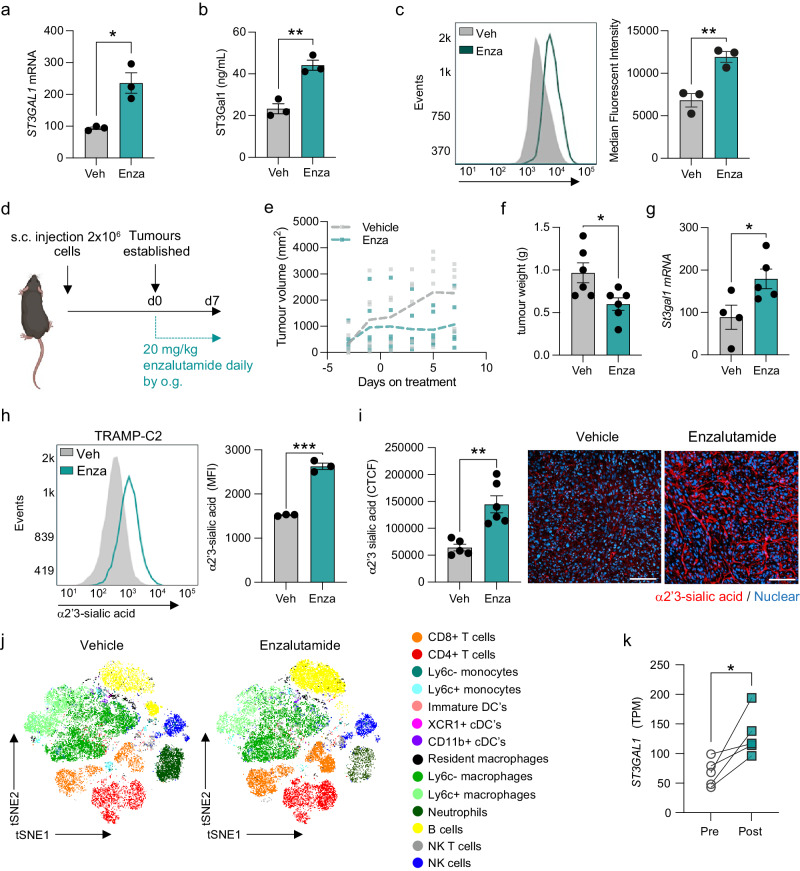
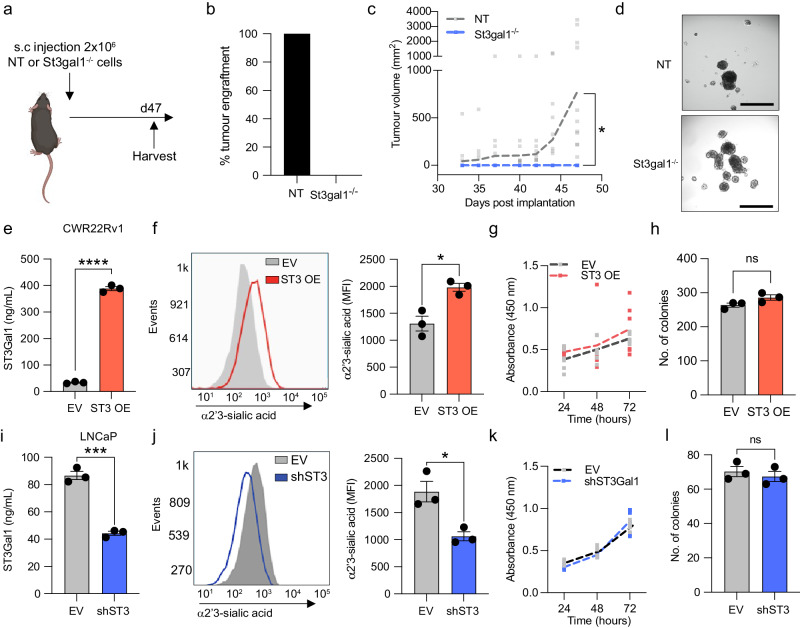
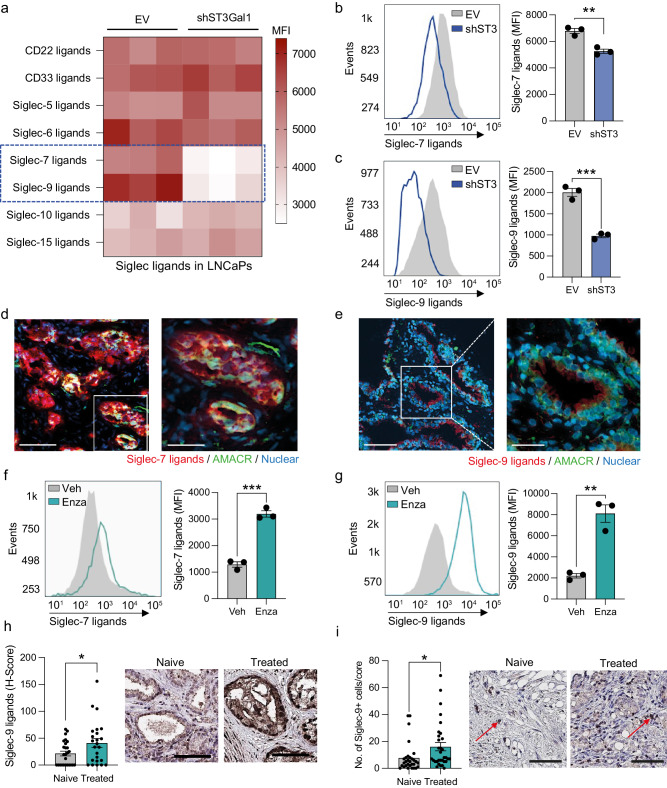
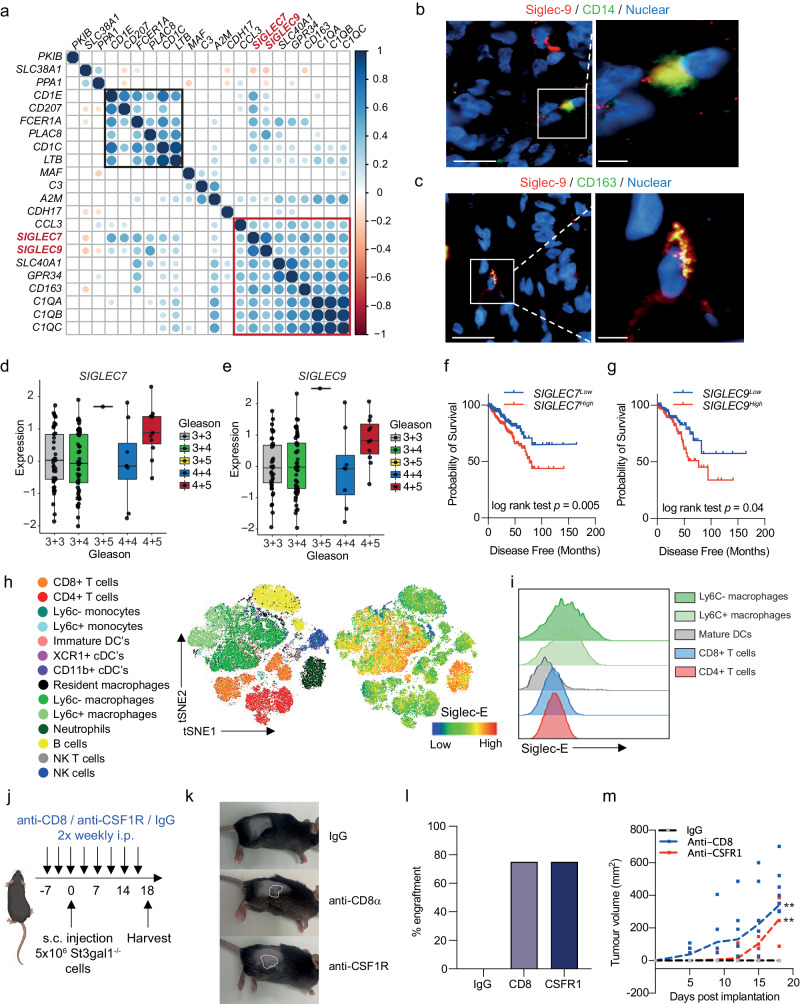
Immune checkpoint blockade has yet to produce robust anti-cancer responses for prostate cancer. Sialyltransferases have been shown across several solid tumours, including breast, melanoma, colorectal and prostate to promote immune suppression by synthesising sialoglycans, which act as ligands for Siglec receptors. We report that ST3 beta-galactoside alpha-2,3-sialyltransferase 1 (ST3Gal1) levels negatively correlate with androgen signalling in prostate tumours. We demonstrate that ST3Gal1 plays an important role in modulating tumour immune evasion through the synthesises of sialoglycans with the capacity to engage the Siglec-7 and Siglec-9 immunoreceptors preventing immune clearance of cancer cells. Here, we provide evidence of the expression of Siglec-7/9 ligands and their respective immunoreceptors in prostate tumours. These interactions can be modulated by enzalutamide and may maintain immune suppression in enzalutamide treated tumours. We conclude that the activity of ST3Gal1 is critical to prostate cancer anti-tumour immunity and provide rationale for the use of glyco-immune checkpoint targeting therapies in advanced prostate cancer.


Conflict of interest statement

The authors declare the following competing interest: JM & ES are shareholders of GlycoScoreDx Ltd. All other authors declare no competing interests where relevant.

Figures

Fig. 1
Fig. 1. ST3Gal1 expression inversely correlates with androgen signalling in prostate cancer (a) Immunohistochemical detection of ST3Gal1 protein expression in normal prostate (N = 10) and prostate cancer (N = 12) tissue samples. Scale bar = 300 µm.
b Gene set enrichment analysis (GSEA) of The Cancer Genome Atlas (TCGA) Prostate Adenocarcinoma (PRAD) cohort. Patients were stratified based on ST3GAL1 and the top and bottom quartiles compared (N = 250). Pathways negatively enriched in ST3GAL1high patients are shown. FDR = False discovery rate. c GSEA for HALLMARK ANDROGEN RESPONSE in TCGA PRAD cohort. d Protein level quantification of ST3Gal1 expression in LNCaP cells cultured with or without 10 nm R1881 synthetic androgens (A+) for 24 hours. Protein quantified using a pre-validated ST3Gal1 sandwich ELISA. N = 3 biologically independent samples. e Quantification of ST3GAL1 mRNA by RNA sequencing in CWR22Rv1 cells following siRNA knockdown of full-length AR or AR-variants. Statistics shown are adjusted p value. N = 3 biologically independent samples. f Correlation matrix correlogram showing ST3GAL1 gene CRPC patients (N=138). Pearson’s correlation coefficient is shown with −1 (red) to 1 (blue). Only correlations with statistical significance of p < 0.05 are shown. The size of the circle is proportional to the correlation coefficients. g Normalised ST3GAL1 mRNA levels in publicly available RNA sequencing in patients with CRPC compared to hormone-dependent prostate cancer. h Meta-analysis of the percentage of patients with ST3GAL1 genomic alternations across four independent prostate cancer patient cohorts. (TCGA N = 498, Armenia et al. N=1013, Abida et al. N 444, Grasso et al. N=61). Cohort one and two are representative of hormone-dependent (HD) cancers. Cohorts 3 and 4 represent CRPC patients. i Kaplan-Meier plot showing disease-free survival for prostate cancer patients based on unaltered (N = 314) and amplified (N = 20) ST3GAL1 genomic alterations. Significance tested using: Two-way t-test (a and d) and Log rank test (i). Statistical significance is shown as * p < 0.05, ** p < 0.01, *** p < 0.001 and **** p < 0.0001. Error bars show standard error of the mean.
Fig. 2
Fig. 2. Androgen receptor antagonism increases ST3Gal1 and α2-3-linked sialoglycans (a) ST3GAL1 mRNA expression in LNCaP cells following 10 µM enzalutamide treatment measured by RT-qPCR.
N = 3 biologically independent samples. b ST3Gal1 protein expression in LNCaP cells following 10 µM enzalutamide treatment quantified using a pre-validated ELISA. N = 3 biologically independent samples. c MAL-II lectin detection of α2-3-sialylation in LNCaP cells following 10 µM enzalutamide treatment measured by flow cytometry. Representative histogram shown and bar chart of median fluorescent intensities. Histogram representative of N = 3 biologically independent samples. d Experimental design for TRAMP-C2 subcutaneous allografts in C57BL/6 mice treated with enzalutamide 20 mg/kg daily by oral gavage. Schematic created with BioRender.com e Tumour growth curves for subcutaneous allografts with 20 mg/kg enzalutamide treatment or vehicle control (N = 6 mice/group). f Tumour weights when tumours were harvested following 7 days enzalutamide treatment or vehicle control (N = 6 mice/group). g RT-qPCR analysis of St3gal1 mRNA expression in TRAMP-C2 subcutaneous tumours following 7 days vehicle or enzalutamide treatment. h MAL-II lectin flow cytometry for cell surface α2-3-sialylation following 10 µM enzalutamide treatment for TRAMP-C2 cells. Representative histogram of N = 3 biologically independent samples and bar chart with median fluorescent intensities shown. (i) MAL-II lectin immunofluorescence detection of α2-3- linked sialic acid (red) expression in FFPE subcutaneous TRAMP-C2 tumours treated with vehicle or enzalutamide. Data are corrected total cell fluorescence (CTFC). Representative images shown. For each tumour 3 images were taken and quantified. Scale bar = 100 µm. j (t-distributed stochastic neighbourhood embedding) tSNE maps of flow cytometric analysis of immune populations in subcutaneous allografts from vehicle and enzalutamide-treated mice (N = 4). k ST3Gal1 gene expression levels determined by RNA sequencing of match biopsies pre and post enzalutamide treatment (N = 5). Significance tested using two-way t-tests. Statistical significance is shown as * p < 0.05, ** p < 0.01, *** p < 0.001 and **** p < 0.0001. Error bars show standard error of the mean.
Fig. 3
Fig. 3. St3gal1-null cells fail to grow in C57BL/6 mice (a) Schematic of St3gal1-/- TRAMP-C2 allograft experimental design.
Schematic created with BioRender.com b Percentage tumour engraftment rate for non-targeting (NT) sgRNA control and St3gal1-/-TRAMP-C2 cells. N = 16 mice/group. c Tumour growth curves for NT and St3gal1-/- TRAMP-C2 allografts. d Representative images of NT and St3gal1-/- TRAMP-C2 spheroid formation in vitro. Images were taken of 9 spheroids per group and quantified. Scale bar = 200 µm. e Protein expression of ST3GAL1 in empty vector (EV) and ST3GAL1 overexpression (OE) lentiviral transduced CWR22Rv1 cells. Levels quantified by ELISA. N = 3 biologically independent samples. f Quantification of α2-3-sialylation in CWR22Rv1 EV and ST3GAL1 OE cells using the MAL-II by flow cytometry. Representative histogram of N = 3 biologically independent samples and bar chart of median fluorescent intensities. g Cellular proliferation of EV and ST3GAL1 overexpression lentiviral transduced CWR22Rv1 cells quantified by WST1 assay. Absorbance was read at 450 nm and normalised to background absorbance. N = 6 biologically independent samples. h Colony forming ability of EV and ST3GAL1 overexpression lentiviral transduced CWR22Rv1 cells measured using a colony forming assay. Graph shows the number of colonies formed. N = 3 biologically independent samples. i Protein expression of ST3GAL1 in EV and shST3Gal1 knockdown lentiviral transduced LNCaP cells. Levels quantified by ELISA. N = 3 biologically independent samples. j Quantification of α2-3-sialylation in LNCaP EV and shST3GAL1 cells using the MAL-II by flow cytometry. Representative histogram of N = 3 biologically independent samples and bar chart of median fluorescent intensities. k Cellular proliferation of EV and shST3GAL1 lentiviral transduced LNCaP cells quantified by WST-1 assay. Absorbance was read at 450 nm and normalised to background absorbance. N = 6 biologically independent samples. l Colony-forming ability of EV and shST3GAL1 lentiviral transduced LNCaP cells measured using a colony-forming assay. Graph shows number of colonies formed. N = 3 biologically independent samples. Significance tested using two-way t-tests. Statistical significance is shown as * p < 0.05, ** p < 0.01, *** p < 0.001 and **** p < 0.0001. Error bars show standard error of the mean.
Fig. 4
Fig. 4. Siglec-7 and Siglec-9 ligands are synthesised by ST3Gal1 and upregulated by AR targeting therapies (a) Heatmap showing siglec binding capabilities in LNCaP empty vector (EV) and shST3GAL1 knockdown cells as determined by flow cytometry using Siglec-Fc reagents.
Significant changes in Siglec-7 and Siglec-9 binding capacity are highlighted in the blue dashed box. N = 3 biologically independent samples. Data are median fluorescent intensities. b–c Quantification of Siglec-7 and Siglec-9 binding capacity in CWR22Rv1 EV and shST3GAL1 cells using Siglec-Fc reagents. Representative histogram of N = 3 biologically independent samples and bar chart with median fluorescent intensities shown. d Siglec-7 ligands (red) colocalized with AMACR (green) in prostate cancer patient biopsies using dual immunofluorescence. Images prepared using a ZEISS Axio Imager2 microscope with a x20 and x40 objective. Scale bar = 150 µm. e Siglec-9 ligands (red) colocalized with Alpha-methylacyl-CoA racemase (AMACR) (green) in prostate cancer patient biopsies using dual immunofluorescence. Images prepared using a ZEISS Axio Imager2 microscope with a x20 and x40 objective. Scale bar = 150 µm. f Quantification of Siglec-7 ligands using Siglec-Fc reagents in LNCaP cells treated with vehicle or 10 µM enzalutamide. Representative histogram of N = 3 biologically independent samples and bar chart with median fluorescent intensities shown. g Quantification of Siglec-9 ligands using Siglec-Fc reagents in LNCaP cells treated with vehicle or 10 µM enzalutamide. Representative histogram of N = 3 biologically independent samples and bar chart with median fluorescent intensities shown. h Immunohistochemistry detection of Siglec-9 ligands using Siglec-Fc reagents in a tissue microarray (TMA). Patients include those who are treatment naïve (N = 26) and those who have been exposed to androgen deprivation therapy (N = 24). H-scores were generated to quantify staining in epithelial cells using a Leica Aperio slide scanner. Representative images shown. Scale bar = 300 µm. i Immunohistochemistry detection of Siglec-9 in a tissue microarray (TMA). Patients include those who are treatment naïve (N = 30) and those who have been exposed to androgen deprivation therapy (N = 32). The number of positive Siglec-9+ cells were quantified per tissue core. Representative images shown. Examples of Siglec-9+ ells highlighted with red arrows. Scale bar = 200 µm. Significance tested two-way t-tests. Statistical significance is shown as * p < 0.05, ** p < 0.01, *** p < 0.001 and **** p < 0.0001. Error bars show standard error of the mea.
Fig. 5
Fig. 5. ST3Gal1 bio-synthesised siglec ligands are critical glyco-immune checkpoints in prostate cancer.
a Correlation matrix correlogram correlating mRNA levels of SIGLEC7 and SIGLEC9 with a 19- gene prognostic macrophage signature in 208 CRPC patients in the SU2C dataset. Pearson’s correlation coefficient is shown with −1 (red) to 1 (blue). Only correlations with statistical significance of p < 0.05 are shown. Circle size is proportional to the correlation coefficients. A pro-proliferative cluster is highlighted in the black box and anti-inflammatory cluster highlighted in the red box. (bc) Dual immunofluorescence staining of Siglec-9 positive (red) myeloid cells with (b) the myeloid marker CD14 (green) and (c) alternatively activated macrophage marker CD163 (green) in prostate cancer patient biopsies. Images prepared using a ZEISS Axio Imager2 microscope with a X20 and X63 objective. Scale bars = 20 µm. d–e mRNA expression levels of SIGLEC7 (d) and SIGLEC9 (e) from RNA-sequencing of the MSKCC prostate cancer publicly available dataset. Data was accessed through camcAPP. (fg) Kaplan-Meier plot showing disease-free survival for prostate cancer patients stratified based on low (bottom 50%) or high (top 50%) SIGLEC7 (f) and SIGLEC9 (g) gene expression. Analysis includes 498 prostate cancer patients from the TCGA PRAD cohort, accessed via CBioPortal. h t-distributed stochastic neighborhood embedding) tSNE maps of flow cytometric analysis of immune populations in TRAMP-C2 subcutaneous allografts. Siglec-E protein expression on immune cell subsets is shown. i Representative stacked histogram of four individual mouse tumours showing Siglec-E expression levels on immune subsets as determined by flow cytometry j Schematic of study design for T cell and macrophage depletion studies in St3gal1-/- subcutaneous allografts. Schematic created with BioRender.com k Representative photographs taken from mice at the end of the study. Tumours are highlighted with dashed white lines. (l Bar chart showing percentage engraftment of St3gal1-/- TRAMP-C2 cells in mice following IgG, anti-CD8α or anti-CSFR1 treatment. m Tumour growth curves for St3gal-/- TRAMP-C2 allografts in IgG control, anti-CD8α and anti-CSFR1 treated mice. Significance tested using: One-way ANOVA (d,e,l and m) and log rank (f and g). Statistical significance is shown as * p < 0.05, ** p < 0.01, *** p < 0.001 and **** p < 0.0001. Error bars show standard error of the mean.

References

    1. Sung H, et al. Global Cancer Statistics 2020: GLOBOCAN Estimates of Incidence and Mortality Worldwide for 36 Cancers in 185 Countries. CA Cancer J. Clin. 2021;71:209–249. doi: 10.3322/caac.21660. - DOI - PubMed
    1. Nuhn P, et al. Update on Systemic Prostate Cancer Therapies: Management of Metastatic Castration-resistant Prostate Cancer in the Era of Precision Oncology. Eur. Urol. 2019;75:88–99. doi: 10.1016/j.eururo.2018.03.028. - DOI - PubMed
    1. Mateo J, et al. Managing Nonmetastatic Castration-resistant Prostate Cancer. Eur. Urol. 2019;75:285–293. doi: 10.1016/j.eururo.2018.07.035. - DOI - PubMed
    1. Library WO, et al. The molecular underpinnings of prostate cancer: impacts on management and pathology practice. Wiley Online Library. 2017;241:173–182. - PubMed
    1. Marcus L, Lemery SJ, Keegan P, Pazdur R. FDA Approval Summary: Pembrolizumab for the Treatment of Microsatellite Instability-High Solid Tumors. Clin. Cancer Res. 2019;25:3753–3758. doi: 10.1158/1078-0432.CCR-18-4070. - DOI - PubMed

Publication types