. 2024 Mar 6;25(1):250.
doi: 10.1186/s12864-024-10174-9.

Integrated analysis reveals FLI1 regulates the tumor immune microenvironment via its cell-type-specific expression and transcriptional regulation of distinct target genes of immune cells in breast cancer

Affiliations

Integrated analysis reveals FLI1 regulates the tumor immune microenvironment via its cell-type-specific expression and transcriptional regulation of distinct target genes of immune cells in breast cancer

Jianying Pei et al. BMC Genomics. .

Abstract

Background: Immunotherapy is a practical therapeutic approach in breast cancer (BRCA), and the role of FLI1 in immune regulation has gradually been unveiled. However, the specific role of FLI1 in BRCA was conflicted; thus, additional convincing evidence is needed.

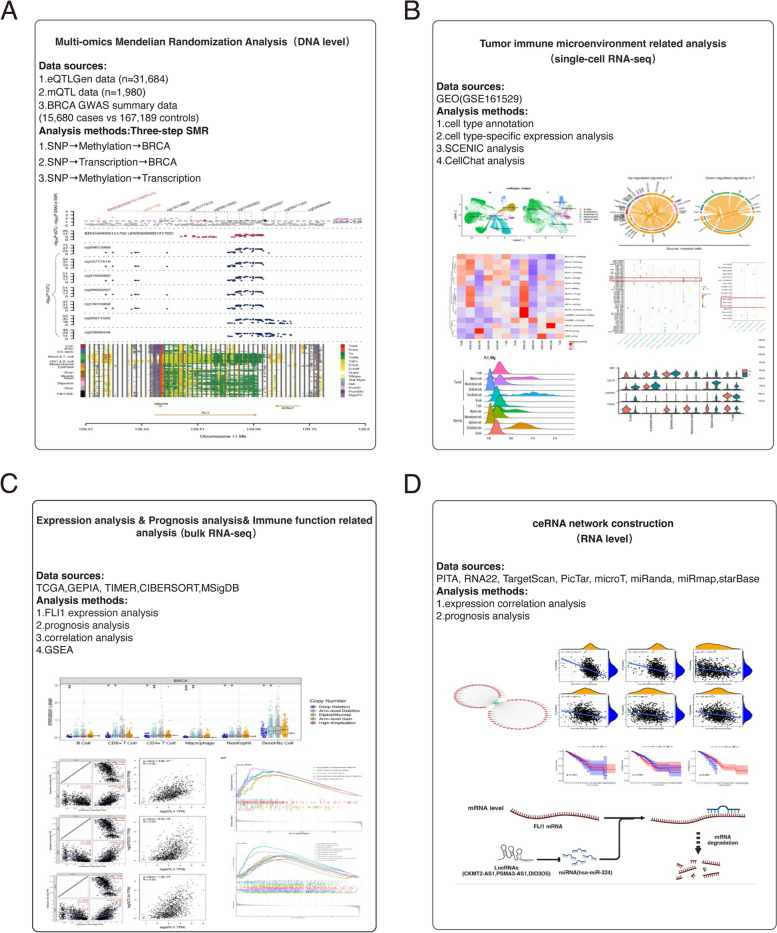
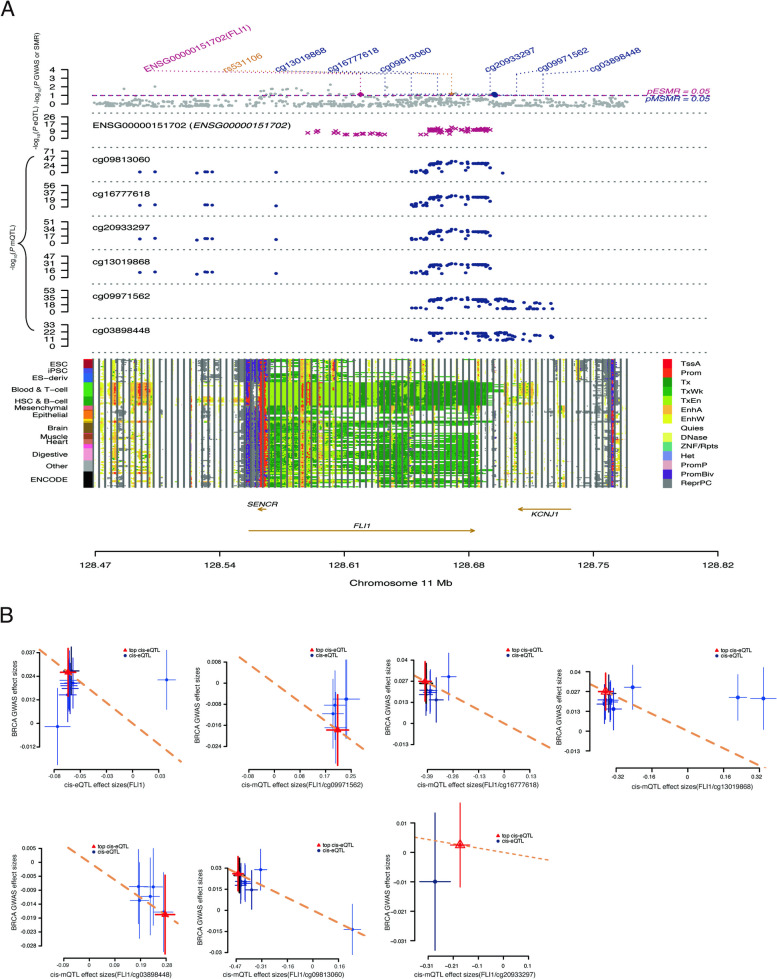
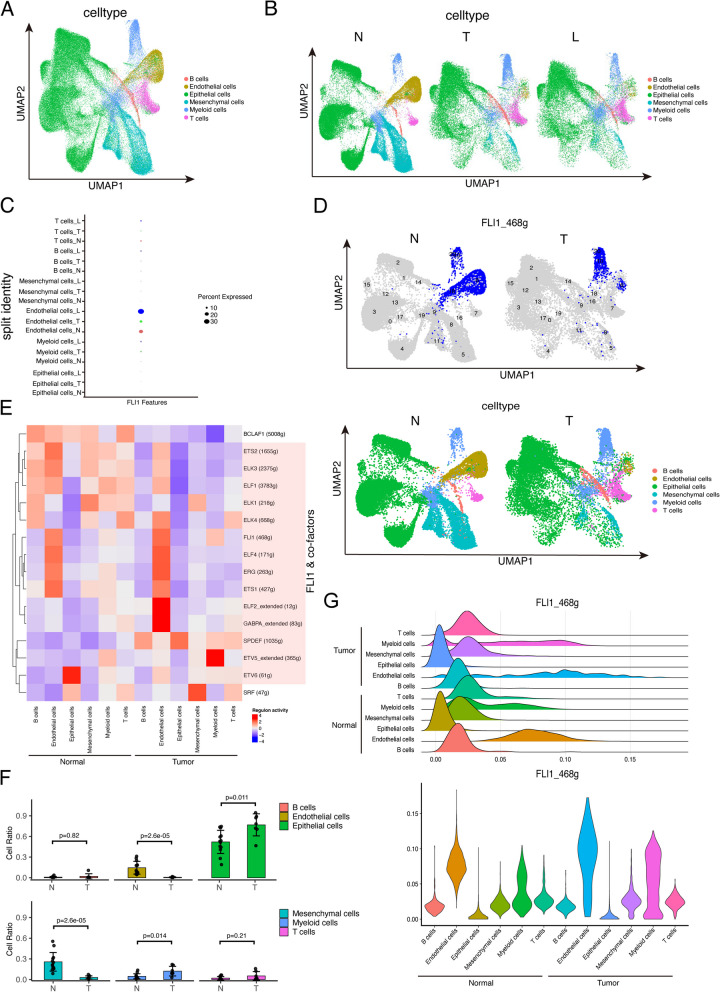
Methods: We explored the upstream regulation of FLI1 expression via summary data-based Mendelian randomization (SMR) analysis and ncRNA network construction centering on FLI1 using BRCA genome-wide association study (GWAS) summary data with expression quantitative trait loci (eQTLs) and DNA methylation quantitative trait loci (mQTLs) from the blood and a series of in silico analyses, respectively. We illuminated the downstream function of FLI1 in immune regulation by integrating a series of analyses of single-cell RNA sequence data (scRNA-seq).

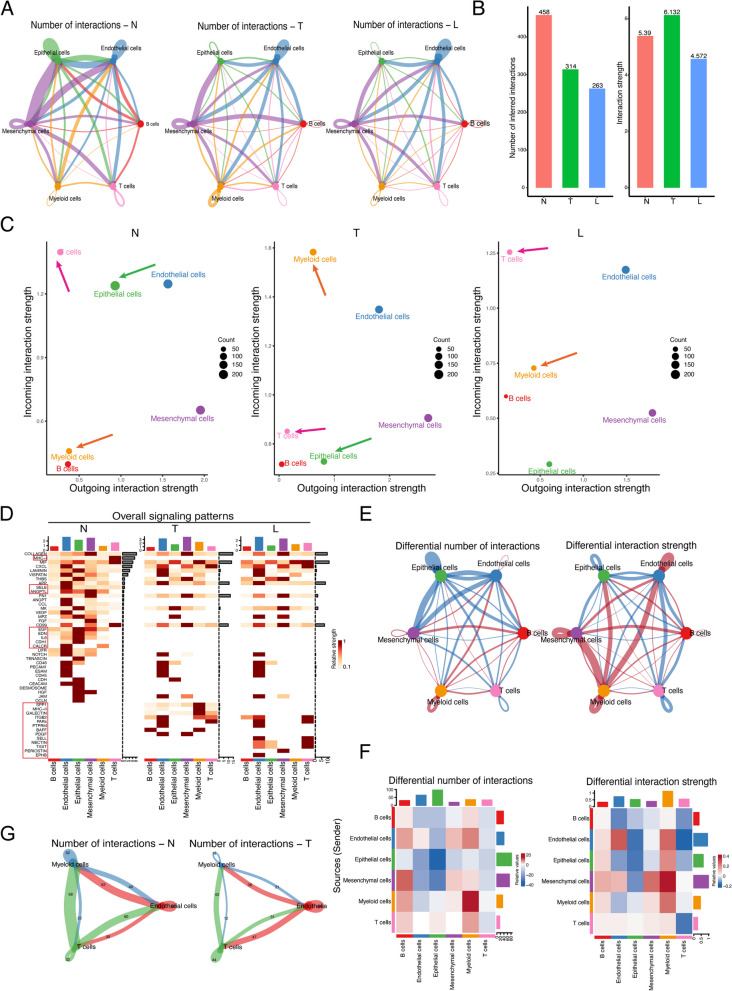
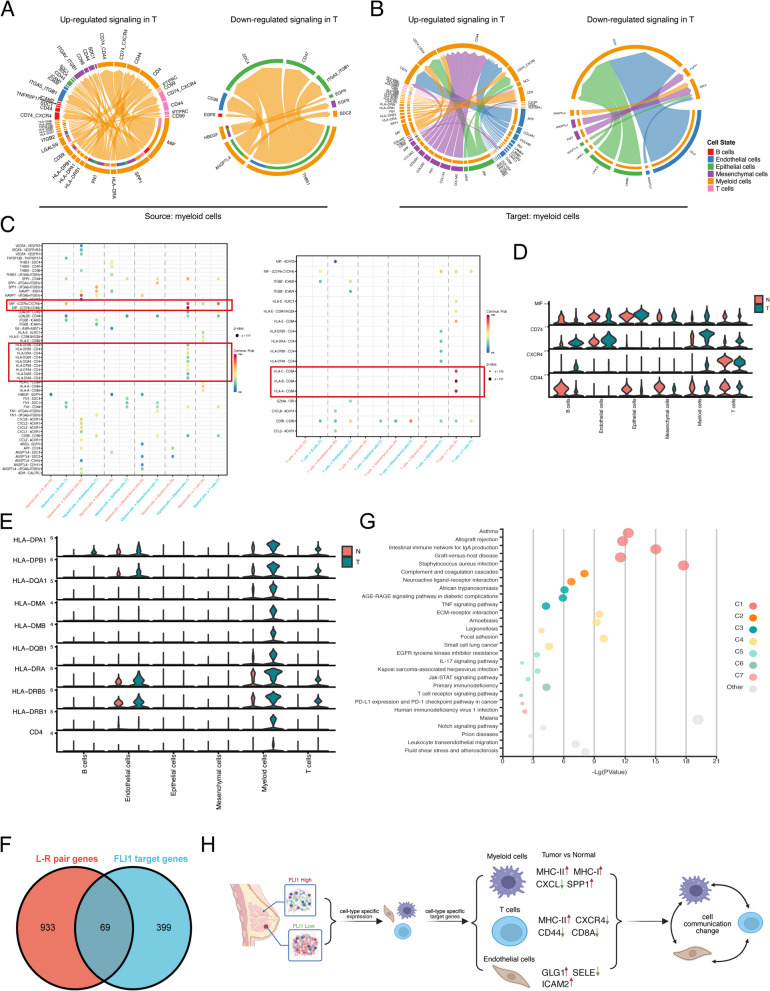
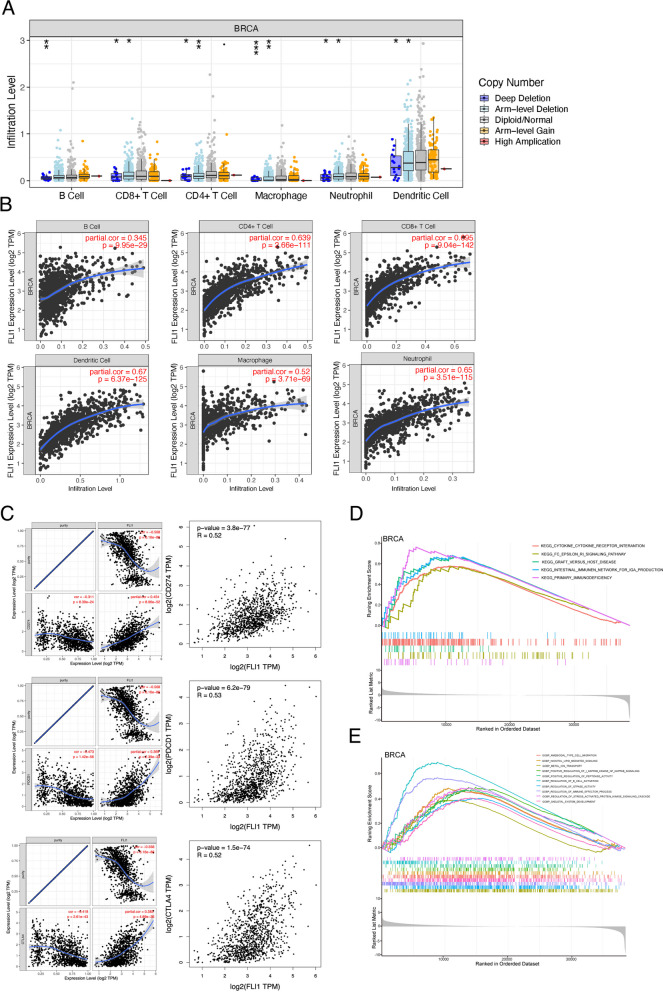
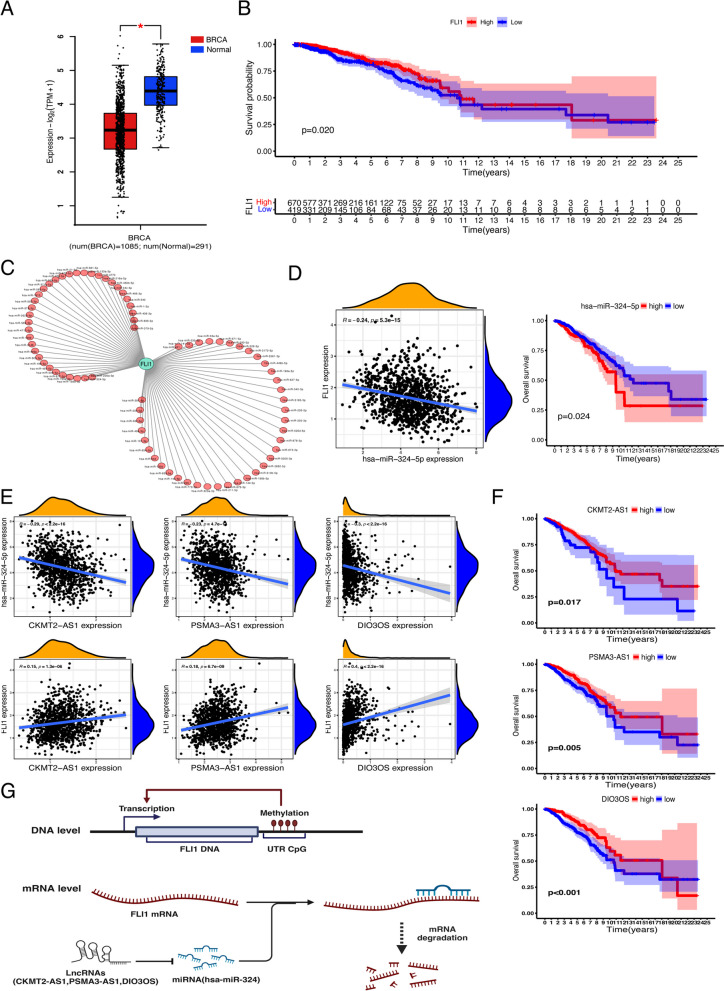
Results: We verified a causal pathway from FLI1 methylation to FLI1 gene expression to BRCA onset and demonstrated that FLI1 was downregulated in BRCA. FLI1, a transcription factor, served as myeloid and T cells' communication regulator by targeting immune-related ligands and receptor transcription in BRCA tissues. We constructed a ceRNA network centering on FLI1 that consisted of three LncRNAs (CKMT2-AS1, PSMA3-AS1, and DIO3OS) and a miRNA (hsa-miR-324-5p), and the expression of FLI1 was positively related to a series of immune-related markers, including immune cell infiltration, biomarkers of immune cells, and immune checkpoints.

Conclusion: Low-methylation-induced or ncRNA-mediated downregulation of FLI1 is associated with poor prognosis, and FLI1 might regulate the tumor immune microenvironment via a cell-type-specific target genes manner in BRCA.

Keywords: Breast cancer; Cell communication; FLI1; Immune cells; Transcription factor; scRNA-seq.


Conflict of interest statement

The authors declare no competing interests.

Figures

Fig. 1
Fig. 1
The workflow shows the strategy of this study
Fig. 2
Fig. 2
Three-step SMR analysis prioritized FLI1 and mechanisms in BRCA using blood tissue. A Locus zoom plots show the consistent genetic effects from the BRCA GWAS, cis-mQTLs, and cis-eQTLs near FLI1. The plot shows 14 chromatin state annotations (indicated by colors) of 127 samples from REMC for different primary cells and tissue types (rows). B SMR between FLI1 expression and BRCA GWAS (the first graph), SMR between FLI1 methylation (six methylation sites) and BRCA GWAS (the second to seventh graphs). REMC, Roadmap Epigenomics Mapping Consortium
Fig. 3
Fig. 3
Single-cell transcription analysis and regulatory network centered on FLI1 in BRCA. A UMAP visualization of 99,532 cells analyzed by scRNA-seq and integrated across thirteen normal breast tissues, seven pairs of breast tumors, and corresponding lymph node samples, categorized into six major cell types. B UMAP visualization of all cells split by sample group. C The dot plot shows the expression of FLI1 in each cell type split by sample group. D UMAP visualization of the activity of FLI1 regulons in each cell type. E The heatmap shows the activities of the regulons of FLI1 and other cofactors in each cell type split by sample group. Colors from blue to red indicate low to high regulon activity (F). The ratio of each cell type in the normal and tumor groups. G Ridgeline plots and violin plots show the AUC values of the FLI1 regulatory network in each normal and tumor group cell type. N, normal. T, tumor. L, lymph node
Fig. 4
Fig. 4
Global intercellular communication in BRCA. A Circle plots show the interaction numbers among all six cell types across different groups. B Bar plots show the total interaction number and interaction strength in different groups. C Scatter plots show the interaction strength of the incoming and outgoing of each cell type across different groups. D Heatmaps summarize the overall signal pathways of each cell group among all samples. E Differential number or strength of interactions in the tumor and normal groups. The red and blue lines indicate a signal increase and decrease in the tumor compared to the normal group. F Heatmaps show the differential number or strength of tumor interactions compared with the normal group. G The specific interaction numbers among myeloid cells, T cells, and endothelial cells in normal and tumor groups. N, normal. T, tumor. L, lymph node
Fig. 5
Fig. 5
Crosstalk between myeloid cells or T cells and other cells in BRCA. A, B Circle plots show the up- or downregulated pathway of myeloid cells (A) or T cells (B) as source cells in communication with other cells in the tumor group compared with those in the normal group. C Bubble plots display the main signaling pathways mediating the cellular interaction from myeloid cells (left) or T cells (right) to other cells. D, E Violin plots show the detailed expression of the genes related to the MIF pathway (D) and the MHC II pathway (E) in each cell type in the different groups. F Venn plot of the intersection genes of FLI1 target genes and ligand-receptor genes in cellular communication. G Bubble plots presenting the KEGG analysis results of the intersection genes of FLI1 target genes and ligand-receptor genes. H A graph shows the potential mechanism by which FLI1 regulates immune cell interactions in BRCA
Fig. 6
Fig. 6
Correlation of FLI1 expression with immune-related markers in BRCA. A The infiltration levels of various immune cells with different copy numbers of FLI1 in BRCA. B The correlation of FLI1 expression level with B cell, CD4 + T cell, CD8 + T cell, dendritic cell, macrophage, or neutrophil infiltration levels in BRCA. C Spearman's correlation of FLI1 expression with PD-L1, PD1, and CTLA-4 expression in BRCA adjusted by purity using TIMER (left) and validated using the GEPIA database (right). D, E GSEA pathways (G) and GO biological process (E) enrichment analyses were performed using the single-gene method for FLI1in BRCA, and the top ten items were displayed
Fig. 7
Fig. 7
Establishment of the ceRNA network of FLI1 in BRCA. A FLI1 expression in BRCA tissues compared with corresponding TCGA and GTEx normal tissues. B Correlations between patients’ survival probability and FLI1 expression levels in BRCA. C The visible network of predicted miRNAs and FLI1 in BRCA constructed using Cytoscape. D Negative correlations between hsa-miR-324-5p and FLI1 and the prognostic value of hsa-miR-324-5p in BRCA. E Negative correlations between hsa-miR-324-5p and the predicted LncRNAs expression (upper panel), the positive correlations between FLI1 and predicted LncRNAs expression (lower panel) (F) The prognostic value of the candidate LncRNAs in BRCA. G The ceRNA network model of FLI1 in BRCA. *p value < 0.05; **p value < 0.01; ***p value < 0.001

Similar articles

Cited by

References

    1. Siegel RL, Miller KD, Wagle NS, Jemal A. Cancer statistics, 2023. CA Cancer J Clin. 2023;73:17–48. doi: 10.3322/caac.21763. - DOI - PubMed
    1. Zeng X, Liu C, Yao J, Wan H, Wan G, Li Y, et al. Breast cancer stem cells, heterogeneity, targeting therapies and therapeutic implications. Pharmacol Res. 2021;163:105320. doi: 10.1016/j.phrs.2020.105320. - DOI - PubMed
    1. Anampa J, Makower D, Sparano JA. Progress in adjuvant chemotherapy for breast cancer: an overview. BMC Med. 2015;13:195. doi: 10.1186/s12916-015-0439-8. - DOI - PMC - PubMed
    1. Watson DK, Smyth FE, Thompson DM, Cheng JQ, Testa JR, Papas TS, et al. The ERGB/Fli-1 gene: isolation and characterization of a new member of the family of human ETS transcription factors. Cell Growth Differ Mol Biol J Am Assoc Cancer Res. 1992;3:705–713. - PubMed
    1. Ben-David Y, Giddens EB, Bernstein A. Identification and mapping of a common proviral integration site Fli-1 in erythroleukemia cells induced by Friend murine leukemia virus. Proc Natl Acad Sci U S A. 1990;87:1332–1336. doi: 10.1073/pnas.87.4.1332. - DOI - PMC - PubMed