

Electroacupuncture pretreatment mediates sympathetic nerves to alleviate myocardial ischemia-reperfusion injury via CRH neurons in the paraventricular nucleus of the hypothalamus
- PMID: 38448912
- PMCID: PMC10916233
- DOI: 10.1186/s13020-024-00916-y
Electroacupuncture pretreatment mediates sympathetic nerves to alleviate myocardial ischemia-reperfusion injury via CRH neurons in the paraventricular nucleus of the hypothalamus
Abstract
Background: Myocardial ischemia-reperfusion can further exacerbate myocardial injury and increase the risk of death. Our previous research found that the paraventricular nucleus (PVN) of the hypothalamus plays a crucial role in the improvement of myocardial ischemia-reperfusion injury (MIRI) by electroacupuncture (EA) pretreatment, but its mechanism of action is still unclear. CRH neurons exhibit periodic concentrated expression in PVN, but further research is needed to determine whether they are involved in the improvement of MIRI by EA pretreatment. Meanwhile, numerous studies have shown that changes in sympathetic nervous system innervation and activity are associated with many heart diseases. This study aims to investigate whether EA pretreatment improves MIRI through sympathetic nervous system mediated by PVNCRH neurons.
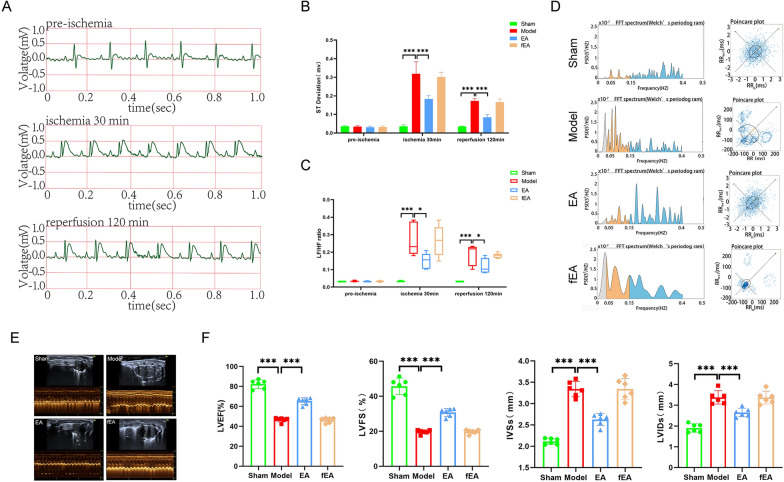
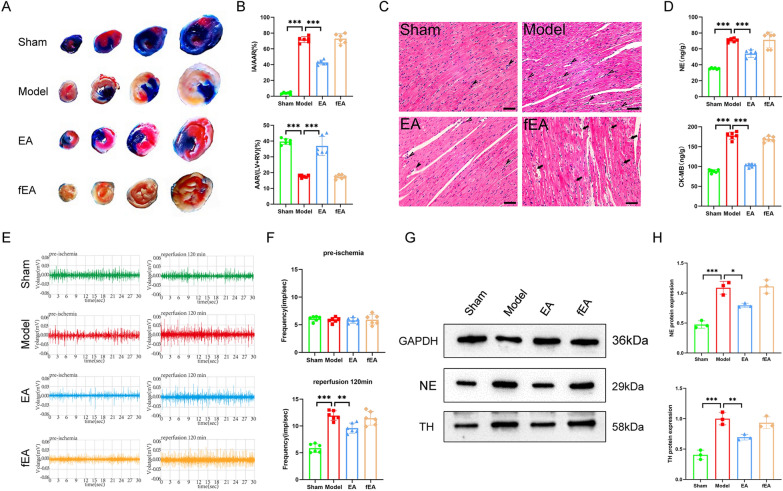
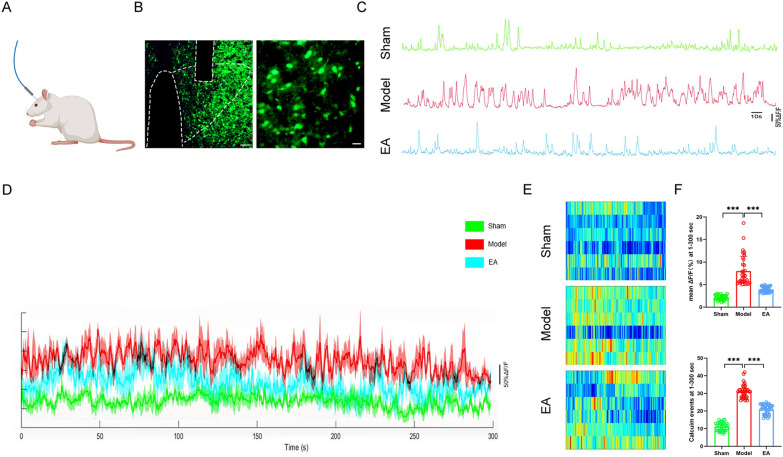
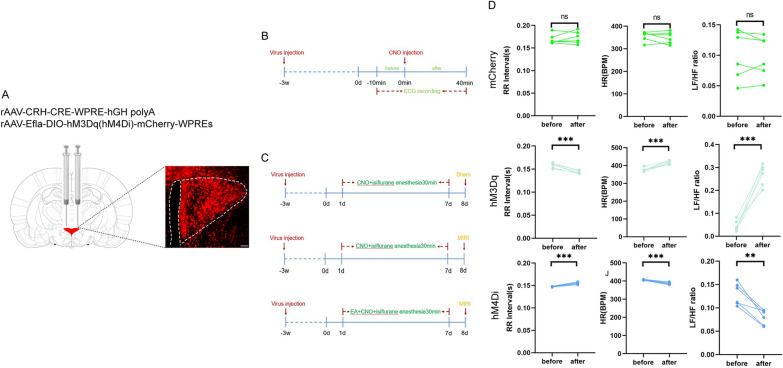
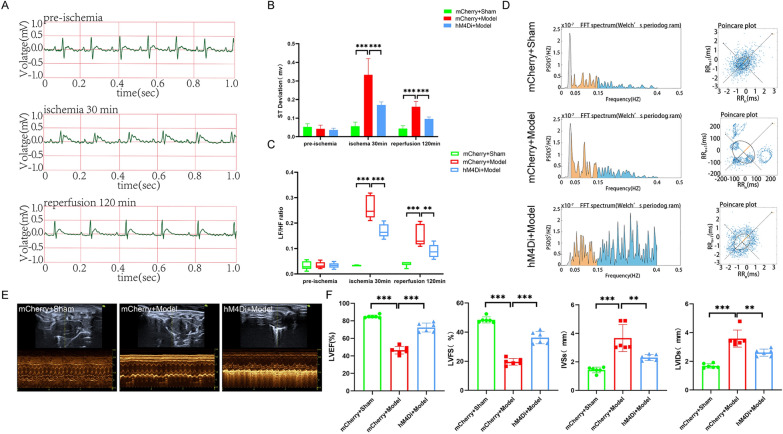
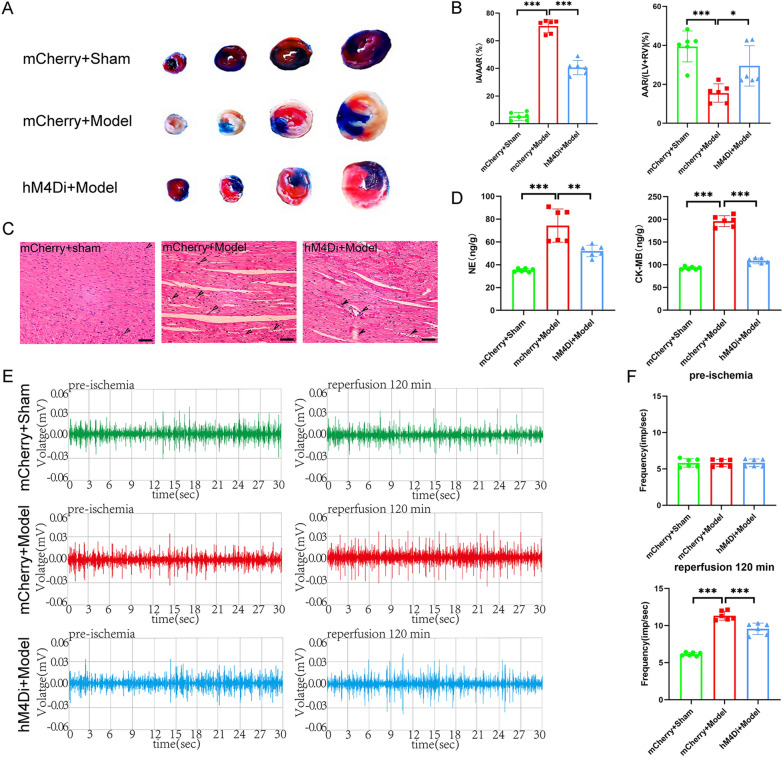
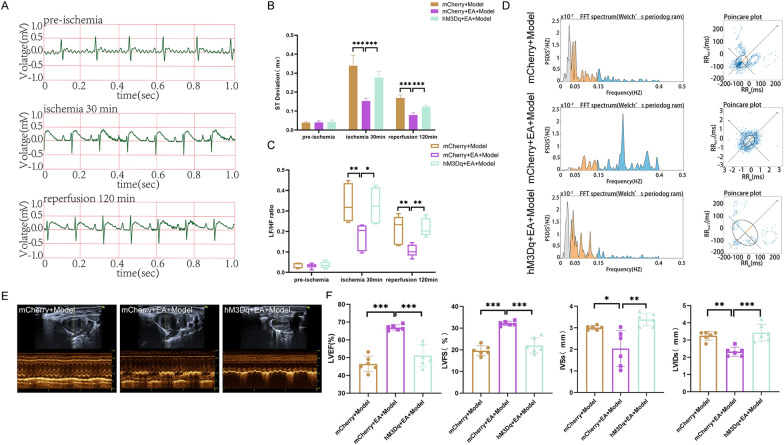
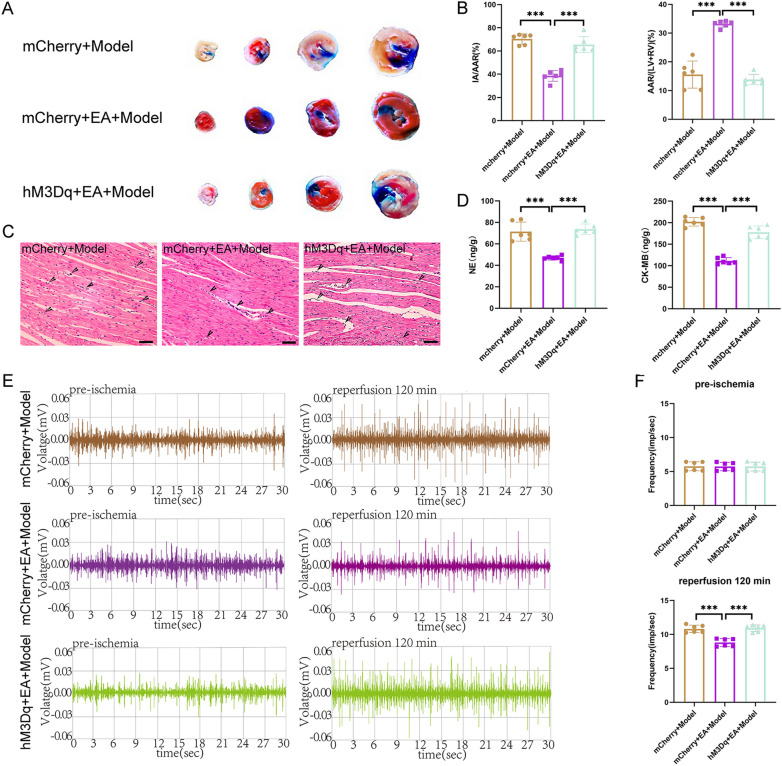
Methods: Integrated use of fiber-optic recording, chemical genetics and other methods to detect relevant indicators: ECG signals were acquired through Powerlab standard II leads, and LabChart 8 calculated heart rate, ST-segment offset, and heart rate variability (HRV); Left ventricular ejection fraction (LVEF), left ventricular short-axis shortening (LVFS), left ventricular end-systolic internal diameter (LVIDs) and interventricular septal thickness (IVSs) were measured by echocardiography; Myocardial infarct area (IA) and area at risk (AAR) were calculated by Evans-TTC staining. Pathological changes in cardiomyocytes were observed by HE staining; Changes in PVNCRH neuronal activity were recorded by fiber-optic photometry; Sympathetic nerve discharges were recorded for in vivo electrophysiology; NE and TH protein expression was assayed by Western blot.
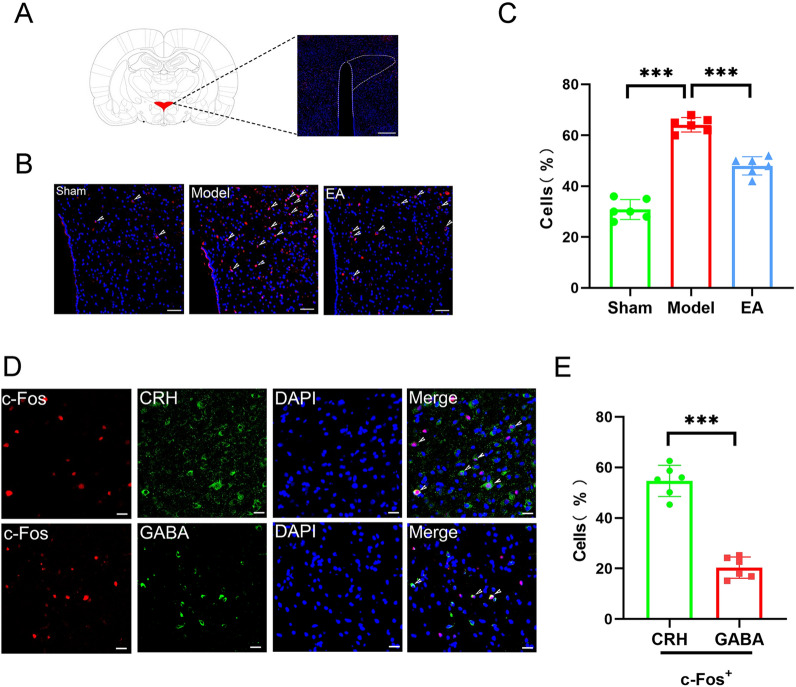
Results: Our data indicated that EA pretreatment can effectively alleviate MIRI. Meanwhile, we found that in the MIRI model, the number and activity of CRH neurons co labeled with c-Fos in the PVN area of the rat brain increased, and the frequency of sympathetic nerve discharge increased. EA pretreatment could reverse this change. In addition, the results of chemical genetics indicated that inhibiting PVNCRH neurons has a similar protective effect on MIRI as EA pretreatment, and the activation of PVNCRH neurons can counteract this protective effect.
Conclusion: EA pretreatment can inhibit PVNCRH neurons and improve MIRI by inhibiting sympathetic nerve, which offers fresh perspectives on the application of acupuncture in the management of cardiovascular disease.
Keywords: CRH neurons; Electroacupuncture pretreatment; Myocardial ischemia- reperfusion injury; Neural mechanism; Paraventricular nucleus of hypothalamus.
© 2024. The Author(s).
Conflict of interest statement
The authors declare no competing interests.
Figures
Similar articles
-
[Effects of electroacupuncture pretreatment on GABAA receptor of fastigial nucleus and sympathetic nerve activity in rats with myocardial ischemia reperfusion injury].Zhongguo Zhen Jiu. 2023 Jun 12;43(6):669-78. doi: 10.13703/j.0255-2930.20221203-k0003. Zhongguo Zhen Jiu. 2023. PMID: 37313561 Chinese.
-
A New Target of Electroacupuncture Pretreatment Mediated Sympathetic Nervous to Improve MIRI: Glutamatergic Neurons in Fastigial Nucleus of the Cerebellum.Neuroscience. 2023 Dec 15;535:124-141. doi: 10.1016/j.neuroscience.2023.10.012. Epub 2023 Nov 3. Neuroscience. 2023. PMID: 37923164
-
Electroacupuncture preconditioning alleviates myocardial ischemia-reperfusion injury through the hypothalamic paraventricular nucleus- interposed nucleus nerve pathway.J Tradit Chin Med. 2022 Jun;42(3):379-388. doi: 10.19852/j.cnki.jtcm.2022.03.005. J Tradit Chin Med. 2022. PMID: 35610007 Free PMC article.
-
The paraventricular nucleus and heart failure.Exp Physiol. 2014 Feb;99(2):332-9. doi: 10.1113/expphysiol.2013.072678. Epub 2013 Dec 6. Exp Physiol. 2014. PMID: 24317407 Review.
-
Myocardial Ischemia-Reperfusion Injury: Unraveling Pathophysiology, Clinical Manifestations, and Emerging Prevention Strategies.Biomedicines. 2024 Apr 4;12(4):802. doi: 10.3390/biomedicines12040802. Biomedicines. 2024. PMID: 38672157 Free PMC article. Review.
Cited by
-
[Mechanisms by Which Paraventricular Hypothalamic Nucleus Participates in the Acupuncture Treatment of Diseases].Sichuan Da Xue Xue Bao Yi Xue Ban. 2025 Jan 20;56(1):26-34. doi: 10.12182/20250160202. Sichuan Da Xue Xue Bao Yi Xue Ban. 2025. PMID: 40109474 Free PMC article. Review. Chinese.
-
Overview of mechanism of electroacupuncture pretreatment for prevention and treatment of cardiovascular and cerebrovascular diseases.CNS Neurosci Ther. 2024 Oct;30(10):e14920. doi: 10.1111/cns.14920. CNS Neurosci Ther. 2024. PMID: 39361504 Free PMC article. Review.
-
Key targets of signal transduction neural mechanisms in acupuncture treatment of cardiovascular diseases: Hypothalamus and autonomic nervous system.Heliyon. 2024 Sep 20;10(19):e38197. doi: 10.1016/j.heliyon.2024.e38197. eCollection 2024 Oct 15. Heliyon. 2024. PMID: 39386880 Free PMC article. Review.
-
Neurophysiological Basis of Electroacupuncture Stimulation in the Treatment of Cardiovascular-Related Diseases: Vagal Interoceptive Loops.Brain Behav. 2024 Oct;14(10):e70076. doi: 10.1002/brb3.70076. Brain Behav. 2024. PMID: 39344397 Free PMC article. Review.
-
Acupuncture attenuates myocardial ischemia/reperfusion injury-induced ferroptosis via the Nrf2/HO-1 pathway.Chin Med. 2025 May 9;20(1):61. doi: 10.1186/s13020-025-01114-0. Chin Med. 2025. PMID: 40346679 Free PMC article.
References
Grants and funding
- 82074536/National Natural Science Foundation of China
- 82104999/National Natural Science Foundation of China
- 2108085Y30/Natural Science Foundation of Anhui Province
- 2108085QH364/Natural Science Foundation of Anhui Province
- gxgwfx2019025/Anhui Province University Outstanding Top Talent Cultivation Funding Project
- gxgnfx2022014/Anhui Province Excellent Youth Backbone Talent Domestic Visit and Training Program
- 2022AH020043/Anhui Province University Scientific Research Project
- 2022AH030062/Anhui Province University Scientific Research Project
- 2023CXMMTCM019/Research Funds of Center for Xin'an Medicine and Modernization of Traditional Chinese Medicine of IHM
LinkOut - more resources
Full Text Sources
