. 2024 Mar 7;15(1):40.
doi: 10.1186/s40104-024-01001-y.

Reorganization of 3D genome architecture provides insights into pathogenesis of early fatty liver disease in laying hens

Affiliations

Reorganization of 3D genome architecture provides insights into pathogenesis of early fatty liver disease in laying hens

Yanli Liu et al. J Anim Sci Biotechnol. .

Abstract

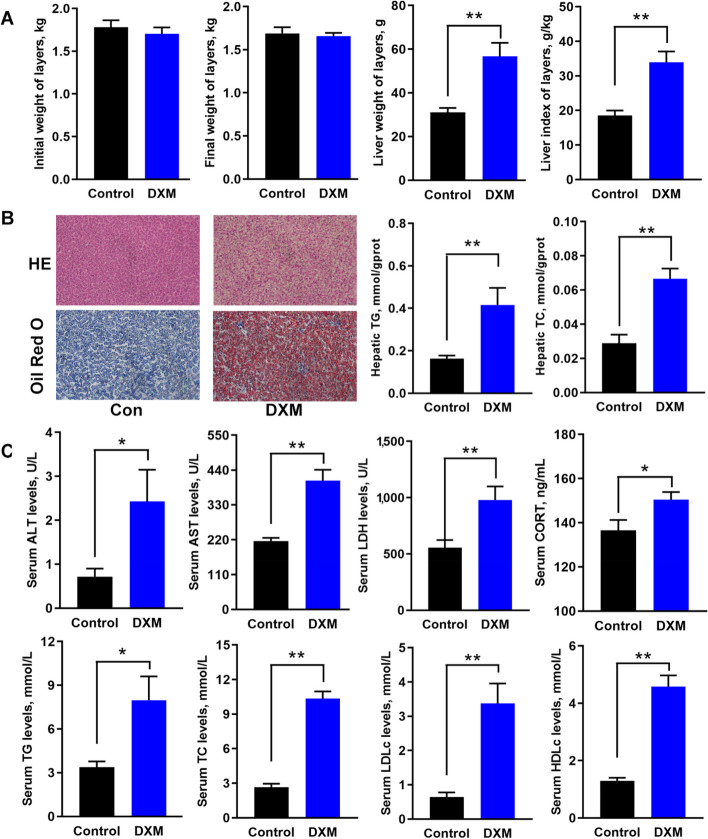
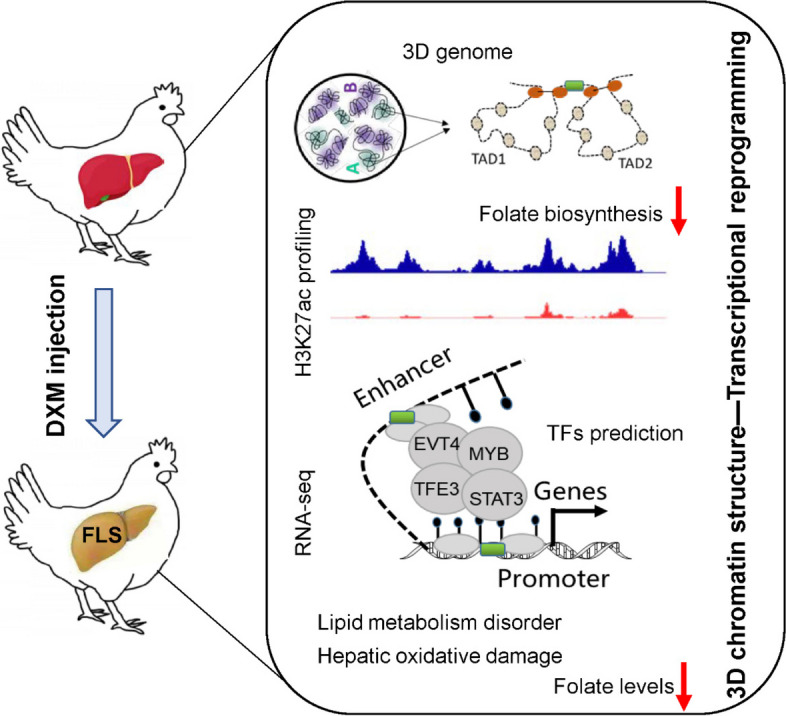
Background: Fatty liver disease causes huge economic losses in the poultry industry due to its high occurrence and lethality rate. Three-dimensional (3D) chromatin architecture takes part in disease processing by regulating transcriptional reprogramming. The study is carried out to investigate the alterations of hepatic 3D genome and H3K27ac profiling in early fatty liver (FLS) and reveal their effect on hepatic transcriptional reprogramming in laying hens.

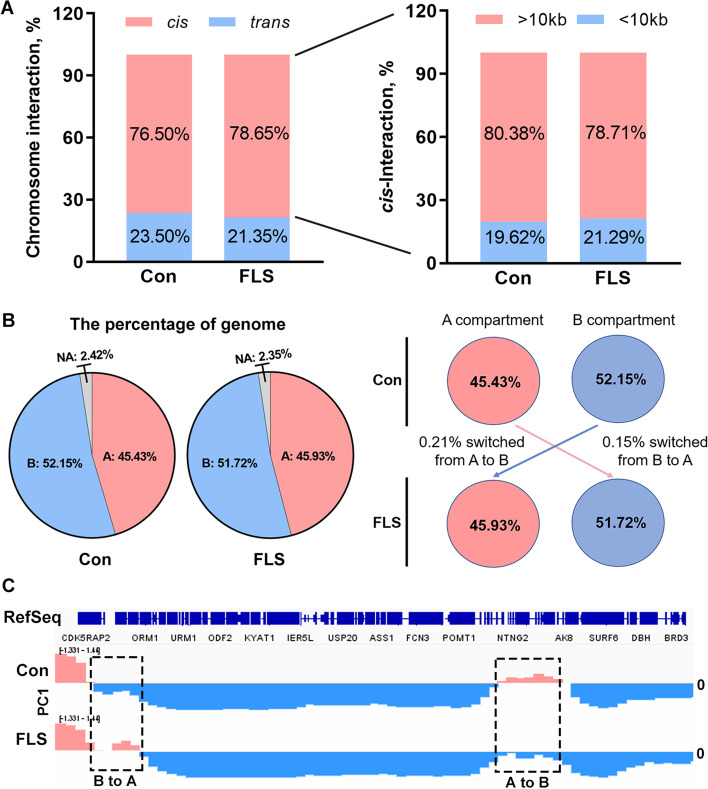
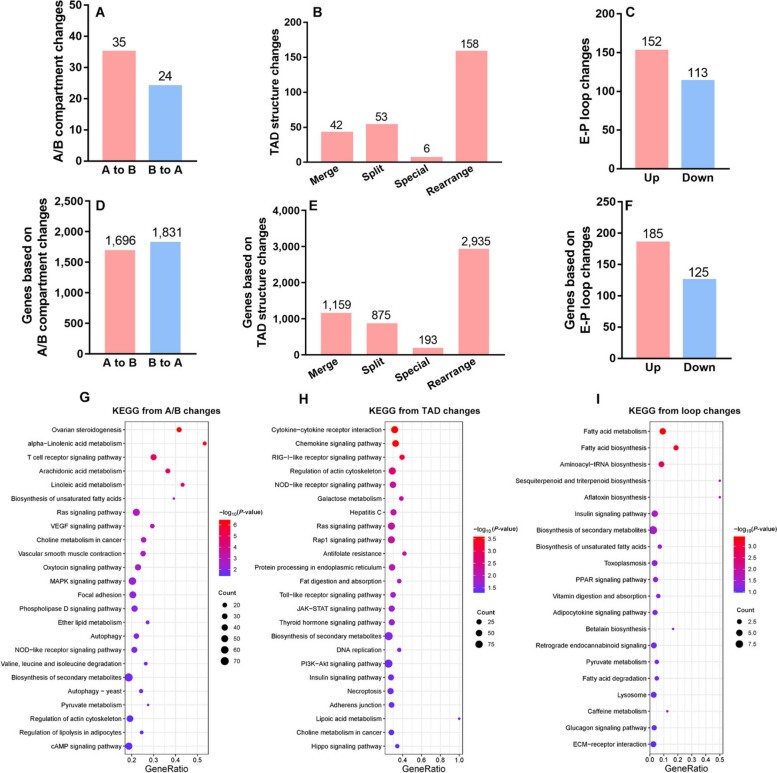
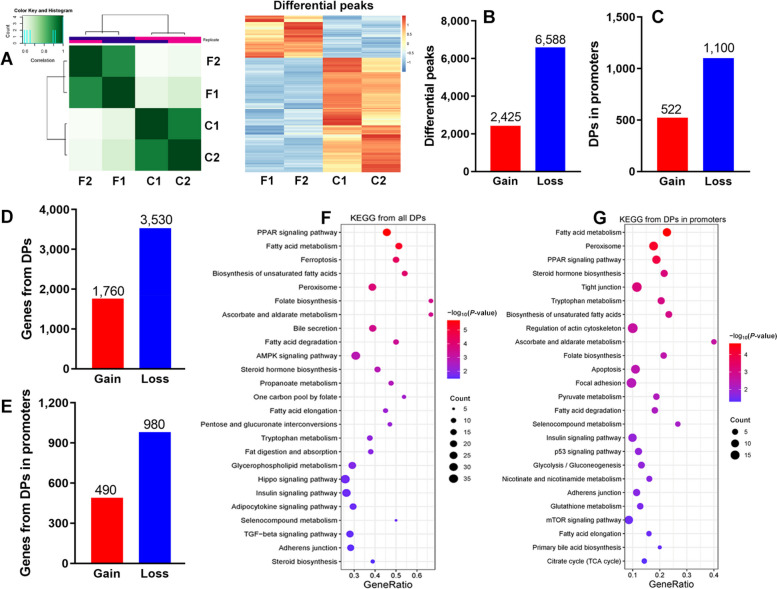
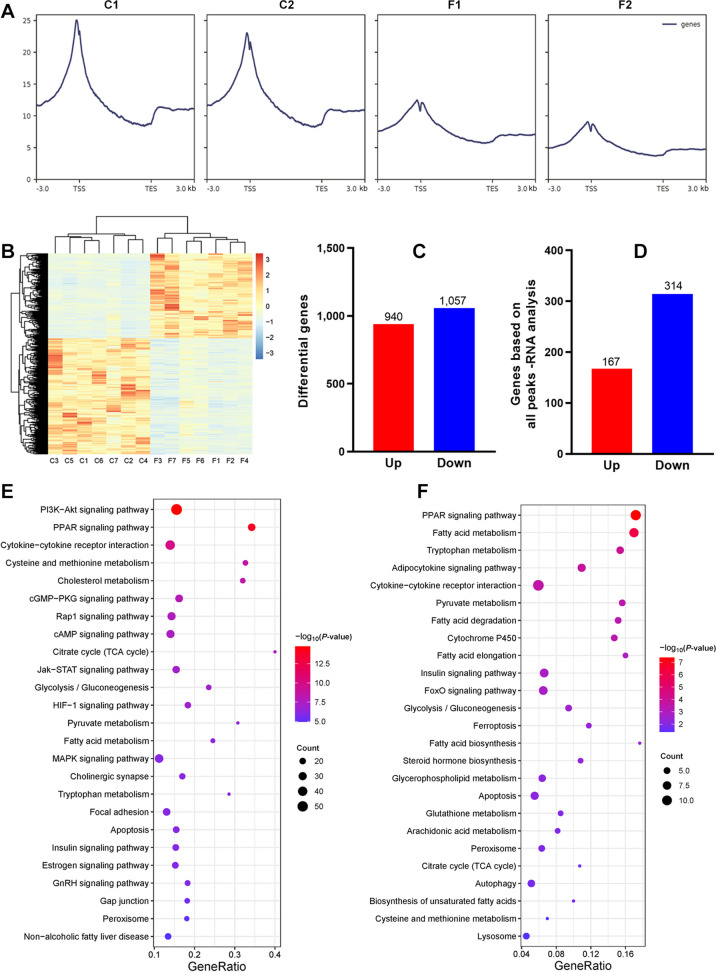
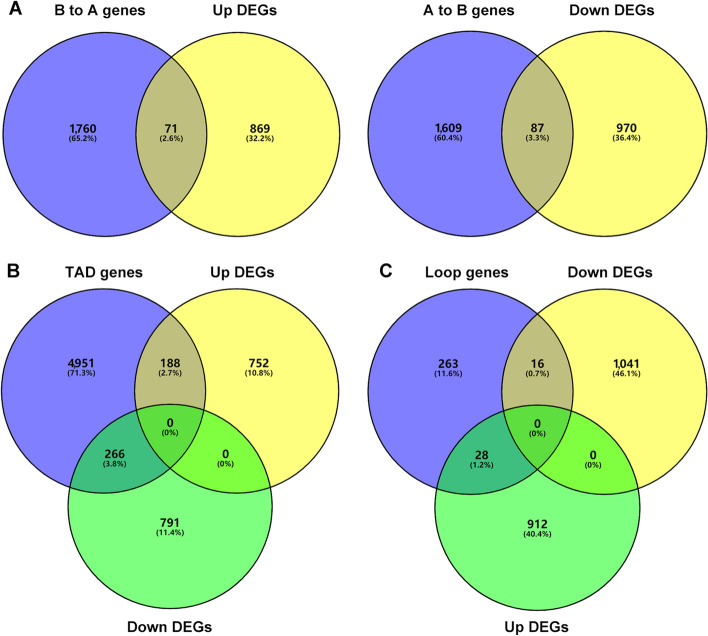
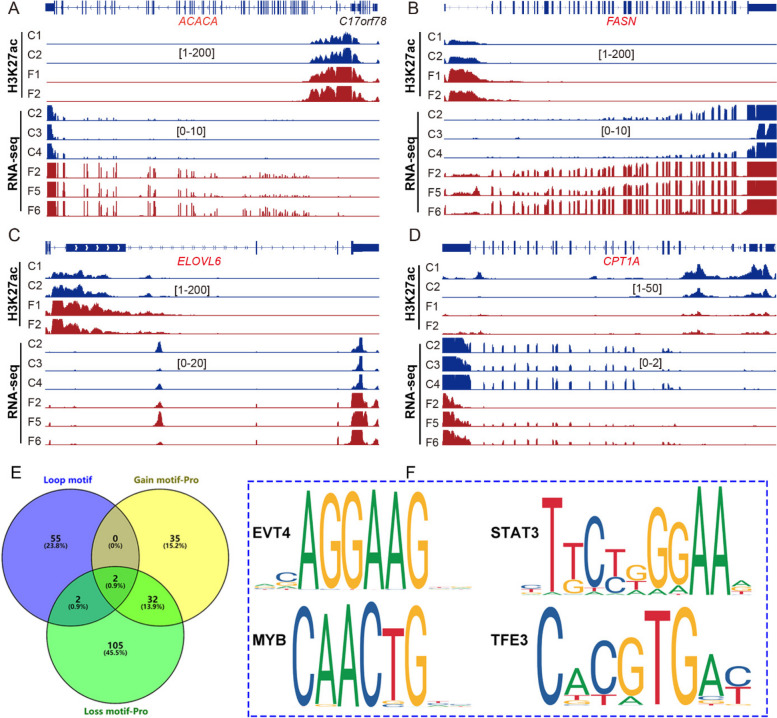
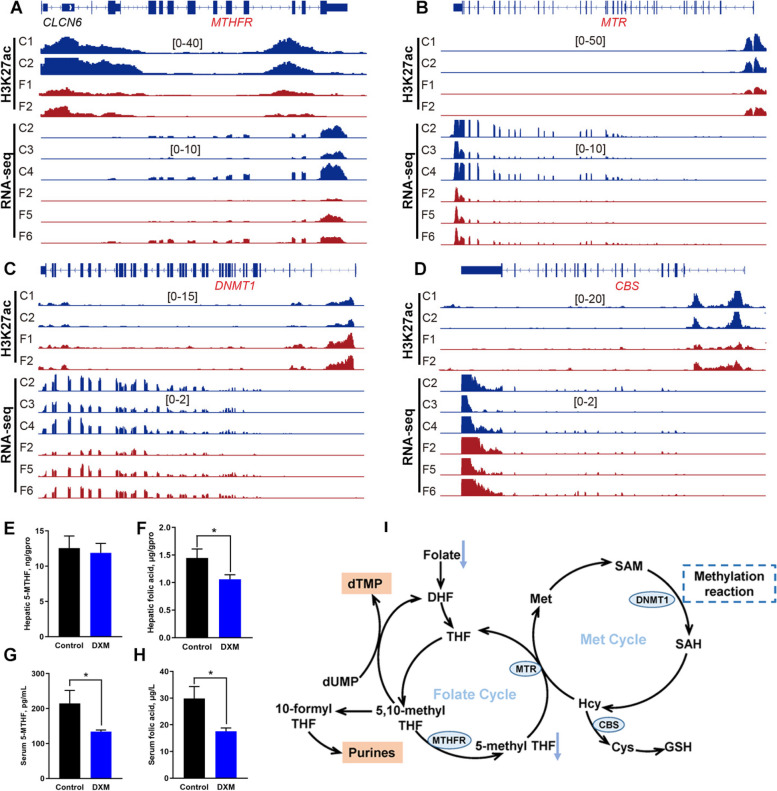
Results: Results show that FLS model is constructed with obvious phenotypes including hepatic visible lipid deposition as well as higher total triglyceride and cholesterol in serum. A/B compartment switching, topologically associating domain (TAD) and chromatin loop changes are identified by high-throughput/resolution chromosome conformation capture (HiC) technology. Targeted genes of these alternations in hepatic 3D genome organization significantly enrich pathways related to lipid metabolism and hepatic damage. H3K27ac differential peaks and differential expression genes (DEGs) identified through RNA-seq analysis are also enriched in these pathways. Notably, certain DEGs are found to correspond with changes in 3D chromatin structure and H3K27ac binding in their promoters. DNA motif analysis reveals that candidate transcription factors are implicated in regulating transcriptional reprogramming. Furthermore, disturbed folate metabolism is observed, as evidenced by lower folate levels and altered enzyme expression.

Conclusion: Our findings establish a link between transcriptional reprogramming changes and 3D chromatin structure variations during early FLS formation, which provides candidate transcription factors and folate as targets for FLS prevention or treatment.

Keywords: 3D chromatin architecture; Fatty liver disease; Folate; H3K27ac profiling; Transcription reprogramming.


Conflict of interest statement

The authors declare that they have no competing interests.

Figures

Fig. 1
Fig. 1
Phenotype observation of laying hens with FLS. A Body weight, liver weight and liver index of hens. B Hepatic morphological analysis as well as TG and TC detection (magnification:10 × 20). C Determinations of serum biochemical parameters. All data are expressed as mean ± SEM (n = 7). The asterisks on the bars are statistically significant (* means P < 0.05 and ** means P < 0.01)
Fig. 2
Fig. 2
The overview of chromosome interactions and A/B compartment switches in the liver of hens with FLS by HiC. A The proportions of interactions between chromosomes (trans) or within chromosomes (cis). B The proportions of A/B compartments and their switching in hepatic genome. C The PC1 scores of part genomic regions in Con and FLS groups. The pink parts represent A compartment where the value of PC1 is > 0; and the blue regions mean B compartment where the value of PC1 is < 0
Fig. 3
Fig. 3
The analysis for hepatic variances in A/B compartments, TADs and chromatin loops as well as their target genes in laying hens with FLS. A–C The number of changed A/B compartments, TADs and chromatin loops respectively. D–F The number of targeted genes for varied 3D chromatin structure. G–I KEGG pathways analysis enriched significantly based on targeted genes from varied 3D chromatin structure
Fig. 4
Fig. 4
H3K27ac differential peaks and their target genes in Con and FLS groups by CUT-tag analysis. A Heatmaps of correlation analysis among samples and H3K27ac differential peaks. B and C The number of differential peaks in the whole genome and promoters. D and E The targeted gene numbers of H3K27ac differential peaks. F and G KEGG pathways analysis enriched significantly based on targeted genes from H3K27ac differential peaks
Fig. 5
Fig. 5
Hepatic transcriptional reprogramming analysis in hens with FLS. A H3K27ac signals profiling during 3 kb regions upstream and downstream of the transcription start site in Con and FLS group. B and C The heatmaps and number of DEGs based on RNA-seq analysis. D Overlap analysis of between DEGs and targeted genes from H3K27ac differential peaks in the promoter regions. E and F KEGG pathways analysis enriched from DEGs and overlapped genes respectively
Fig. 6
Fig. 6
The Venn map of overlap analysis between GEGs and target genes from varied 3D chromatin structure. A Genes predicted from changed A/B compartment switching overlapped with the corresponding up or down DEGs. B Genes predicted from changed TAD overlapped with up or down DEGs. C Genes predicted from differential loops overlapped with up or down DEGs
Fig. 7
Fig. 7
Schematic diagram of H3K27ac differential peaks in the promoters and DNA motifs analysis. A–D H3K27ac signal enrichment in the promoter regions and genome tracks of RNA-seq for ACACA, FASN, ELOVL6 and CPT1 genes. E The Venn map of DNA motifs predicted from differential gene regions. F DNA sequences of overlapped DNA motifs for EVT4, MYB, STAT3 and TFE3
Fig. 8
Fig. 8
The relationship analysis of folic acid nutritional target for FLS. A–D H3K27ac signal enrichment in the promoter regions and genome tracks of RNA-seq for MTHFR, MTRR, DNMT1 and CBS. EH The detection of 5-MTHF and folic acid in the liver and serum. I Schematic diagram of folate/methionine cycles and their relationship with FLS. The enzyme expression framed with bule ellipses was down-regulated in hens with FLS
Fig. 9
Fig. 9
The study constructed early FLS model in laying hens and revealed the potential epigenetic mechanism of early FLS formation by integrating Hi-C, RNA-seq and H3K27ac labeled CUT-tag analysis. Our findings broaden the knowledge of FLS pathogenesis and provided candidate TFs and folate as targets for FLS prevention or treatment

Similar articles

Cited by

References

    1. Paternostro R, Trauner M. Current treatment of non-alcoholic fatty liver disease. J Intern Med. 2022;292:190–204. doi: 10.1111/joim.13531. - DOI - PMC - PubMed
    1. Zhang Y, Liu Z, Liu R, Wang J, Zheng M, Li Q, et al. Alteration of hepatic gene expression along with the inherited phenotype of acquired fatty liver in chicken. Genes. 2018;9:199. doi: 10.3390/genes9040199. - DOI - PMC - PubMed
    1. Guo L, Kuang J, Zhuang Y, Jiang J, Shi Y, Huang C, et al. Serum metabolomic profiling to reveal potential biomarkers for the diagnosis of fatty liver hemorrhagic syndrome in laying hens. Front Physiol. 2021;12:590638. doi: 10.3389/fphys.2021.590638. - DOI - PMC - PubMed
    1. Aron-Wisnewsky J, Warmbrunn MV, Nieuwdorp M, Clément K. Nonalcoholic fatty liver disease: modulating gut microbiota to improve severity? Gastroenterology. 2020;158:1881–1898. doi: 10.1053/j.gastro.2020.01.049. - DOI - PubMed
    1. Tsai MT, Chen YJ, Chen CY, Tsai MH, Han CL, Chen YJ, et al. Identification of potential plasma biomarkers for nonalcoholic fatty liver disease by integrating transcriptomics and proteomics in laying hens. J Nutr. 2017;147:293–303. doi: 10.3945/jn.116.240358. - DOI - PubMed

LinkOut - more resources