. 2024 Mar 6;22(1):165.
doi: 10.1186/s12964-024-01507-y.

Defects of mitochondria-lysosomes communication induce secretion of mitochondria-derived vesicles and drive chemoresistance in ovarian cancer cells

Affiliations

Defects of mitochondria-lysosomes communication induce secretion of mitochondria-derived vesicles and drive chemoresistance in ovarian cancer cells

Sinforosa Gagliardi et al. Cell Commun Signal. .

Abstract

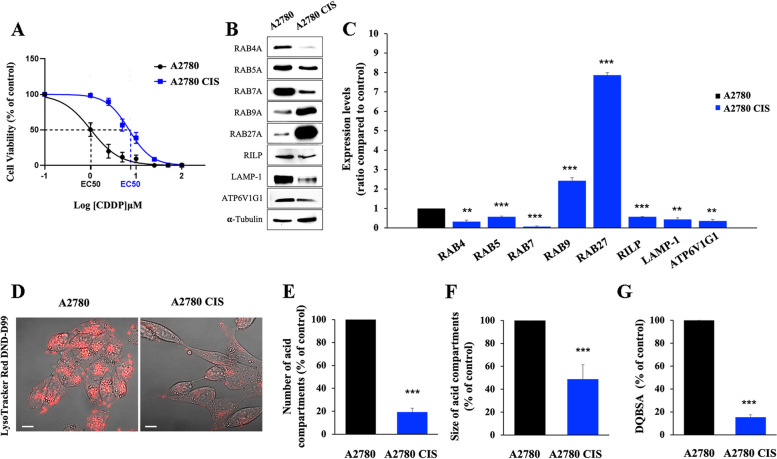
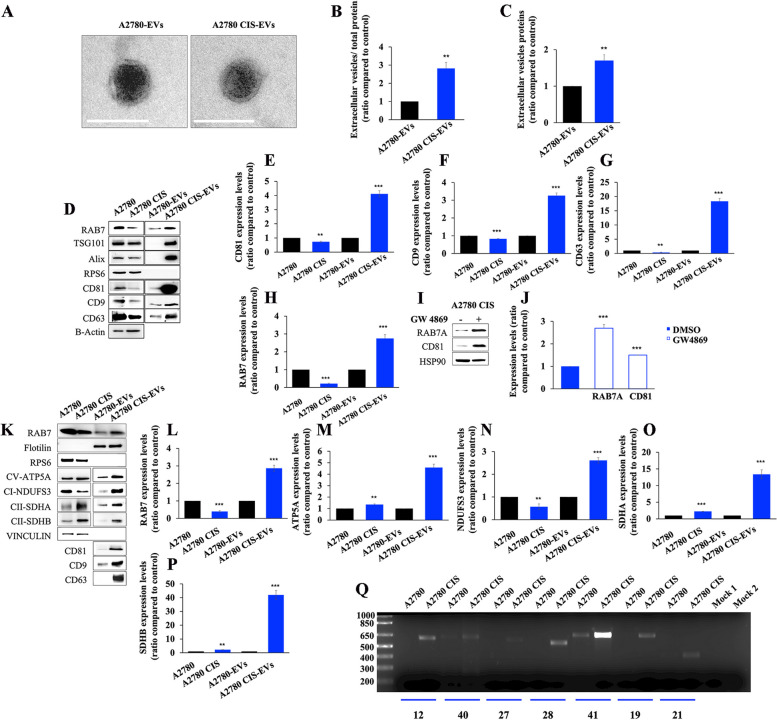
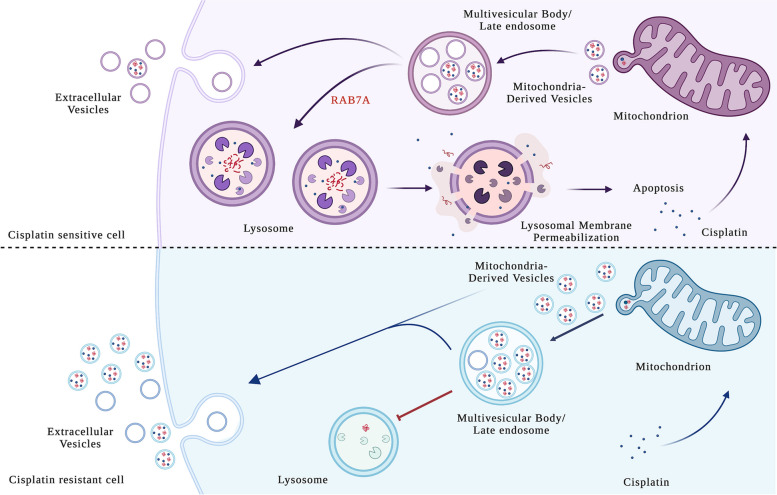
Background: Among the mechanisms of mitochondrial quality control (MQC), generation of mitochondria-derived vesicles (MDVs) is a process to avoid complete failure of mitochondria determining lysosomal degradation of mitochondrial damaged proteins. In this context, RAB7, a late endocytic small GTPase, controls delivery of MDVs to late endosomes for subsequent lysosomal degradation. We previously demonstrated that RAB7 has a pivotal role in response to cisplatin (CDDP) regulating resistance to the drug by extracellular vesicle (EVs) secretion.

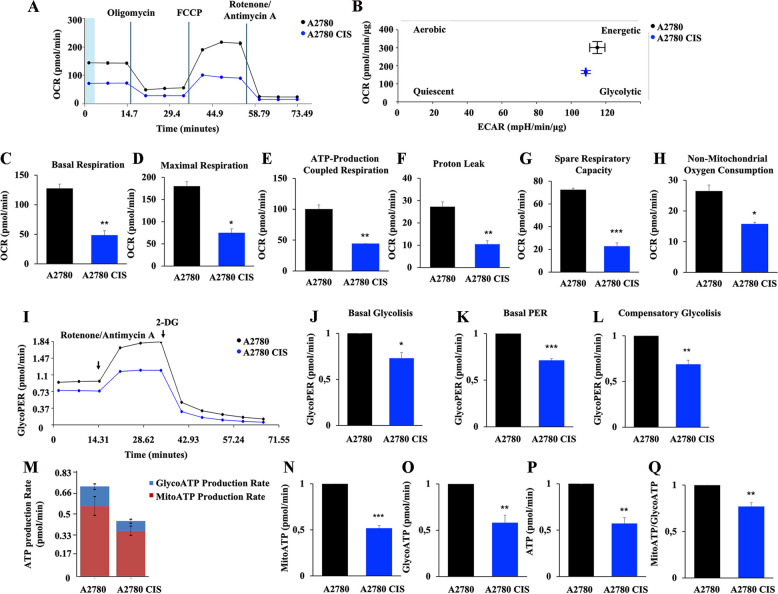
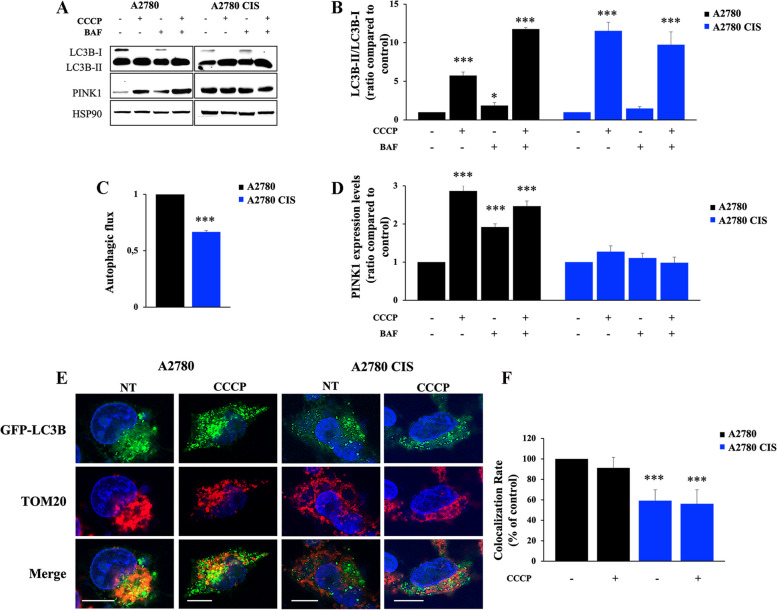
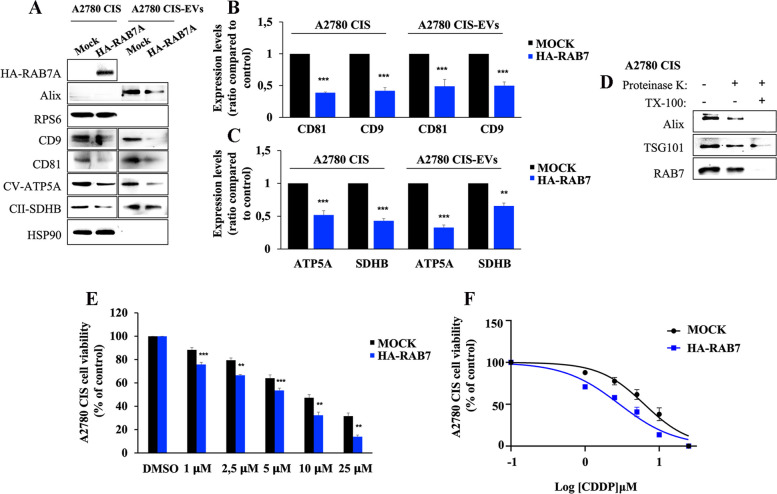
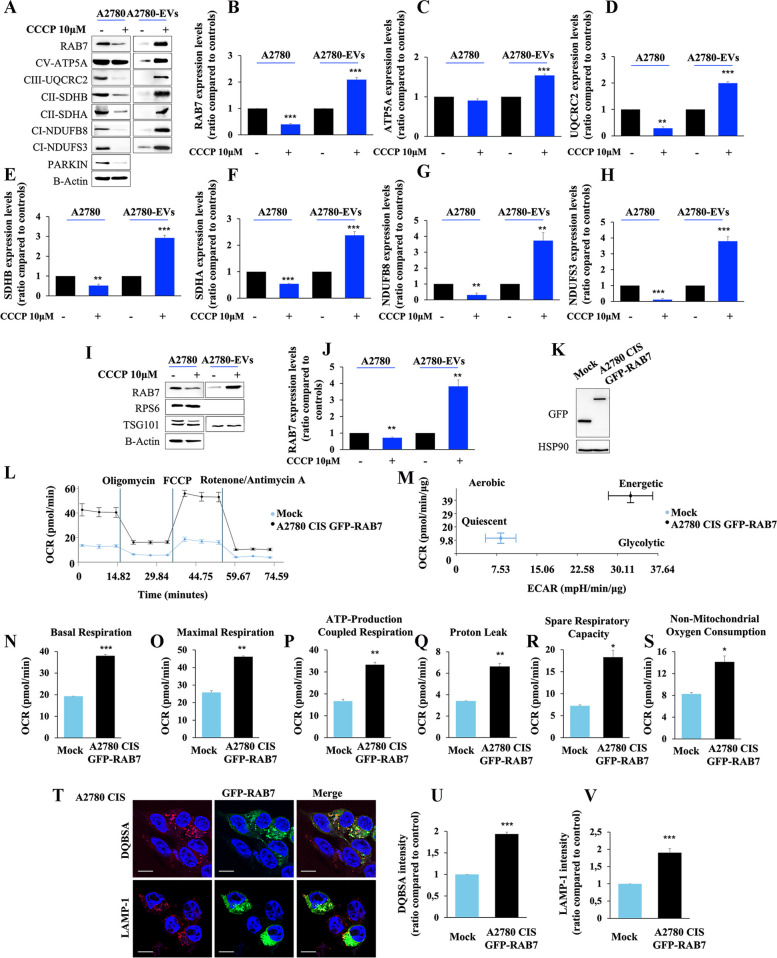
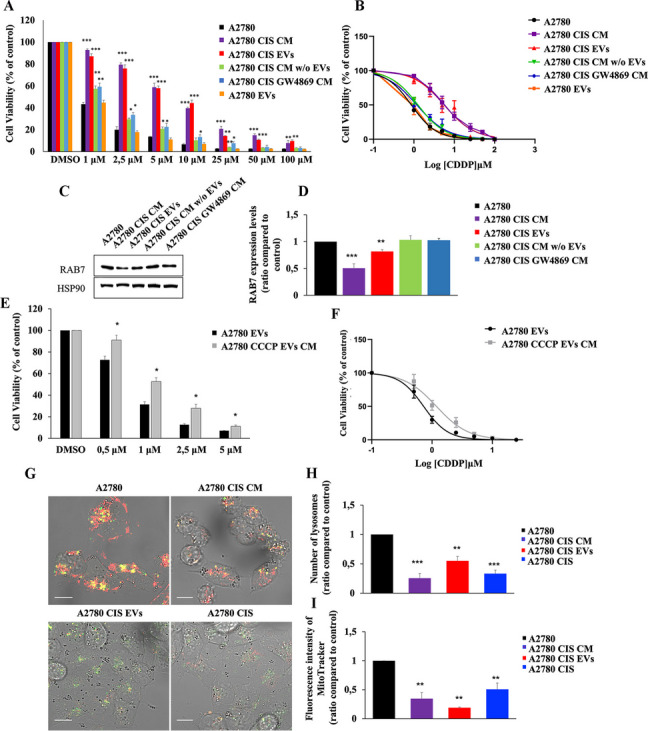
Methods: Western blot and immunofluorescence analysis were used to analyze structure and function of endosomes and lysosomes in CDDP chemosensitive and chemoresistant ovarian cancer cell lines. EVs were purified from chemosensitive and chemoresistant cells by ultracentrifugation or immunoisolation to analyze their mitochondrial DNA and protein content. Treatment with cyanide m-chlorophenylhydrazone (CCCP) and RAB7 modulation were used, respectively, to understand the role of mitochondrial and late endosomal/lysosomal alterations on MDV secretion. Using conditioned media from chemoresistant cells the effect of MDVs on the viability after CDDP treatment was determined. Seahorse assays and immunofluorescence analysis were used to study the biochemical role of MDVs and the uptake and intracellular localization of MDVs, respectively.

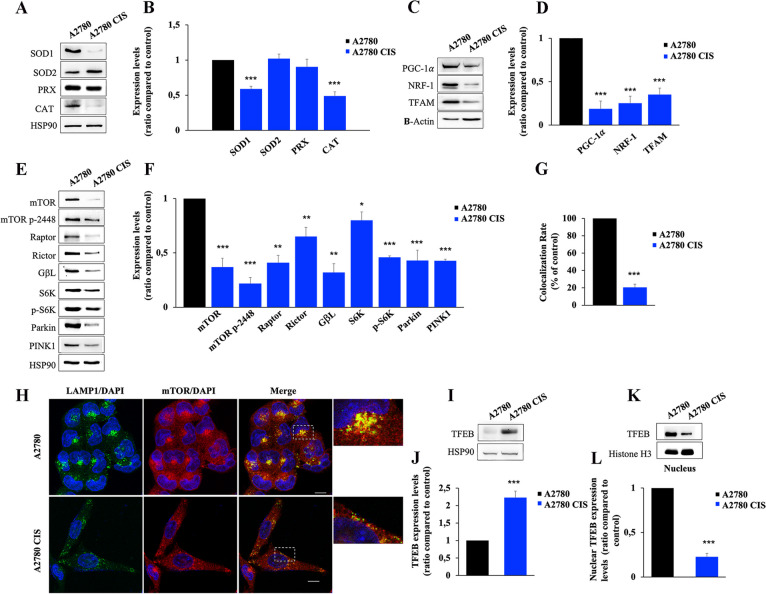
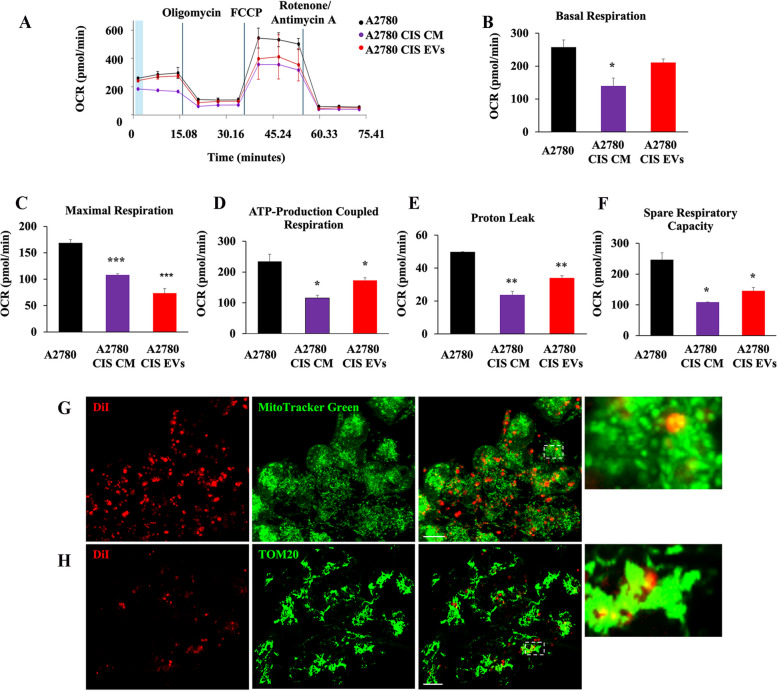
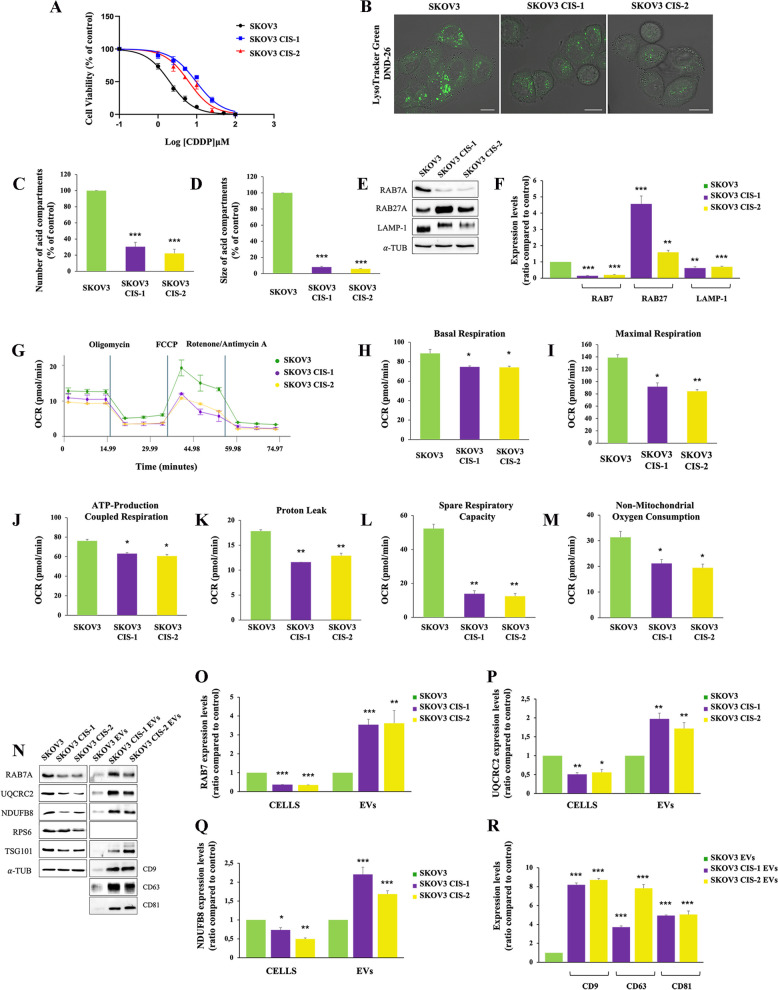
Results: We observed that CDDP-chemoresistant cells are characterized by increased MDV secretion, impairment of late endocytic traffic, RAB7 downregulation, an increase of RAB7 in EVs, compared to chemosensitive cells, and downregulation of the TFEB-mTOR pathway overseeing lysosomal and mitochondrial biogenesis and turnover. We established that MDVs can be secreted rather than delivered to lysosomes and are able to deliver CDDP outside the cells. We showed increased secretion of MDVs by chemoresistant cells ultimately caused by the extrusion of RAB7 in EVs, resulting in a dramatic drop in its intracellular content, as a novel mechanism to regulate RAB7 levels. We demonstrated that MDVs purified from chemoresistant cells induce chemoresistance in RAB7-modulated process, and, after uptake from recipient cells, MDVs localize to mitochondria and slow down mitochondrial activity.

Conclusions: Dysfunctional MQC in chemoresistant cells determines a block in lysosomal degradation of MDVs and their consequent secretion, suggesting that MQC is not able to eliminate damaged mitochondria whose components are secreted becoming effectors and potential markers of chemoresistance.

Keywords: Cisplatin chemoresistance; Extracellular vesicles; Mitochondria-derived vesicles; Ovarian cancer; RAB7.


Conflict of interest statement

The authors declare no competing interests.

Figures

Fig. 1
Fig. 1
Impairment of the endocytic pathway in chemoresistant cells. A EC50 was determined in A2780 and in A2780 CIS cells after 72 h of treatment with CDDP using the MTT(3-(4,5-dimethylthiazol-2-yl)-2,5-diphenol tetrazolium bromide) assay. B, C Relative protein abundance of RAB4, RAB5A, RAB7, RAB9, RAB27, RILP, LAMP-1, and ATP6V1G1 was assessed by Western blot analysis and quantified by densitometry normalizing against α-Tubulin. D Late endocytic acid compartments were live stained with LysoTracker DND-99 dye and images were acquired with confocal microscopy. E, F The number and size of LysoTracker-positive organelles were determined by ImageJ software. G Quantification of Green DQBSA puncta per cell was determined by ImageJ software. Data represent the mean ± SEM of at least three independent experiments. * p < 0.05; ** p < 0.01; ***p < 0.001
Fig. 2
Fig. 2
Defective mitochondrial phenotype in chemoresistant cells. A Oxygen rate consumption (OCR) was determined in A2780 and A2780 CIS cells with Seahorse Mito stress kit assay. B OCR and Extracellular Acidification Rate (ECAR) obtained with Seahorse instruments allowed to determine the energetic map of A2780 and A2780 CIS cell lines. C-H Basal respiration, maximal respiration, ATP-production coupled respiration, proton leak, spare respiration capacity and non-mitochondrial oxygen consumption were determined by Seahorse data elaboration. I Glycolytic Proton Efflux Rate (GlycoPER) was determined with the Seahorse Glycolytic Rate Assay kit. J-L Basal Glycolysis, Basal PER, and Compensatory Glycolysis were determined by Seahorse data elaboration. M ATP production Rate was measured with Seahorse instrument and N-Q subsequent elaboration data have allowed determining ATP produced by mitochondria (MitoATP), by the glycolysis route (GlycoATP), total ATP and MitoATP/GlycoATP ratio. Data represent the mean ± SEM of at least three independent experiments. * p < 0.05; ** p < 0.01; ***p < 0.001
Fig. 3
Fig. 3
Alterations of mitochondrial and lysosomal biogenesis regulators characterize chemoresistant cells. A, B Relative protein abundance of SOD1, SOD2, PRX, and CAT was assessed by Western blot analysis and quantified by densitometry normalizing against HSP90. C, D Relative protein abundance of PGC-1α, NRF-1, and TFAM was assessed by western blot analysis and quantified by densitometry normalizing against β-Actin. E, F Relative protein abundance of mTOR, mTOR p-2448, Raptor, Rictor, GβL, S6K, p-S6K, Parkin, and PINK1 was assessed by Western blot analysis and quantified by densitometry normalizing against HSP90. G, H Colocalization rates were determined for A2780 and A2780 CIS cells immunostained with anti-mTOR (red) and anti-LAMP-1 (green) antibodies. Nuclei were stained with DAPI (blue). White boxes indicated zoomed areas on the right. Scale bar = 10 μm. I, J The total TFEB abundance was determined by Western Blot analysis and quantified by densitometry normalizing against HSP90 using Image Lab software (Bio-Rad). K, L Relative protein abundance of the nuclear fraction of A2780 and A2780 CIS subjected to Western blotting using anti-TFEB, and anti-Histone H3, used as the loading control, was determined. For densitometry Image Lab software (Bio-Rad) was used. Data represent the mean ± SEM of at least three independent experiments. * p < 0.05; ** p < 0.01; ***p < 0.001
Fig. 4
Fig. 4
Analysis of mitophagy in A2780 and A2780 CIS cell lines. A A2780 and A2780 CIS cells were incubated in full medium, with 10 µM CCCP for 18 h and/or with 400 nM Bafilomycin A1 (BAF) for 3 h. Western blot analysis was performed on cellular lysates using antibodies against LC3B and PINK1. HSP90 was used as a loading control. Densitometric analysis of immunoblot shown in (B) and (D) was performed using Image Lab software (Bio-Rad). C The autophagic flux was calculated as the ratio of normalized LC3BII between BAF and untreated cells of the same sample. E A2780 and A2780 CIS expressing GFP-LC3 (green) were treated with CCCP and subjected to immunofluorescence analysis using an antibody against TOM20 (red). Nuclei were stained with DAPI (blue). Scale bar = 10 μm. F The colocalization rates of mitochondria (TOM20, red) and autophagosomes (GFP-LC3, green) were determined with ZEN Black Edition 2011 acquisition software (Zeiss, Germany). Data represent the mean ± SEM of at least three independent experiments. * p < 0.05; ** p < 0.01; ***p < 0.001
Fig. 5
Fig. 5
Analysis of EV content. A EV morphology was determined by Transmission Electron Microscopy (TEM). Scale bar = 100 nm. B, C The total amount of extracellular proteins released by A2780 and A2780 CIS cells normalized on total cell proteins and without normalization. D EVs were purified by ultracentrifugation and RAB7 content in cell lysates and EVs were evaluated by Western blot analysis. The purity of EVs was ascertained according to the ISEV guidelines by looking at different negative and positive markers as indicated. E-H Expression levels of CD81, CD9, CD63, AND RAB7 were determined in cellular lysates and in EVs by densitometry normalizing against β-Actin. I-J A2780 CIS were treated with GW4869 EV secretion inhibitor and intracellular levels of RAB7 and CD81 (as a positive control of inhibition) were measured by western blotting analysis normalizing against HSP90. K-P EVs were purified by immunoisolation. Positive and negative controls were used to verify the purity of EVs. Mitochondrial protein expression was evaluated in EVs by Western blot and the relative abundance of RAB7, ATP5A, NDUFS3, SDHA, and SDHB was determined through densitometric analysis normalizing against vinculin. Q Total DNA was extracted from A2780 cells and A2780 CIS EVs. MitoALL resequencing kit was used to analyze mitochondrial DNA (mtDNA) contained in EVs. Mock 1 and Mock 2 represent two conditions of PCR purity control in which PCR mix with amplicon 19 and 21 primers were used as controls. Data in graphs represent the mean ± SEM of at least three independent experiments. * p < 0.05; ** p < 0.01; ***p < 0.001
Fig. 6
Fig. 6
Analysis of EVs after RAB7 overexpression in A2780 CIS cells. A A2780 CIS cells were transfected with empty vector (Mock) and with HA-RAB7, and EVs were purified by immunoisolation. Expression levels of CD9, CD81, ATP5A, and SDHB were evaluated by Western blot in transfected cells, and in EVs purified from these cells. B, C Protein relative abundance was determined through densitometric analysis normalizing against HSP90 protein. D EVs from A2780 CIS were incubated with proteinase K where indicated in the presence or absence of Triton-X100 and then were subjected to immunoblot analysis using antibodies against Alix, TSG101 (as controls), and RAB7. E A2780 CIS cells transfected with empty vector (Mock) and with HA-RAB7 plasmid were treated with CDDP. Subsequently, an MTT assay was performed and cell viability of HA-RAB7-transfected A2780 CIS cells was determined using the matched mock for each concentration as control. F EC50 was determined in A2780 CIS cells treated as indicated after 48 h of incubation with CDDP using the MTT assay and calculated with GraphPad Prism. Data represent the mean ± SEM of at least three independent experiments. * p < 0.05; ** p < 0.01; ***p < 0.001
Fig. 7
Fig. 7
Treatment with carbonyl cyanide m-chlorophenylhydrazone (CCCP) and analysis of EV content. A A2780 cells were treated with CCCP (10 μm) and EVs were purified by immunoisolation. Mitochondrial protein expression was evaluated in EVs by Western blot analysis and B-H the relative abundance of RAB7, ATP5A, UQCRC2, SDHA, SDHB, NDUFS3, and NDUFB8 was determined through densitometric analysis normalizing against β-Actin. Parkin protein was used as control of CCCP treatment. I, J A2780 cells were treated with CCCP (10 μm) and EVs were purified by ultracentrifugation. RAB7 levels were determined, and their relative abundance was measured with densitometry normalizing against β-Actin. K A2780 CIS cells were transfected with empty vector (Mock) and with GFP-RAB7, and L OCR was determined with Seahorse Mito stress kit assay. M OCR and Extracellular Acidification Rate (ECAR) obtained with Seahorse instruments allowed to determine the energetic map. N-S Basal respiration, maximal respiration, ATP-production coupled respiration, proton leak, spare respiration capacity, and non-mitochondrial oxygen consumption were determined by Seahorse data elaboration. T-V A2780 CIS cells were transfected with GFP-RAB7, and DQBSA assay and LAMP-1 immunostaining were performed and analyzed by confocal microscopy. Data represent the mean ± SEM of at least three independent experiments. * p < 0.05; ** p < 0.01; ***p < 0.001
Fig. 8
Fig. 8
Mitochondria-Derived Vesicles influence chemotherapy response. A A2780 cells were incubated with media or conditioned media (CM) as indicated (A2780 CIS CM, A2780 CIS EVs, A2780 CIS CM w/o EVs, A2780 CIS GW4869 CM, and A2780 EVs), and were treated with stepwise concentrations of CDDP. Then, cell viability was measured with the MTT assay. B EC50 was determined in A2780 cells treated as indicated after 72 h of incubation with CDDP using the MTT assay and calculated with GraphPad Prism. C Lysates from A2780 cells incubated with media or conditioned media (CM) as indicated (A2780 CIS CM, A2780 CIS EVs, A2780 CIS CM w/o EVs, and A2780 CIS GW4869 CM) were analyzed by immunoblotting using antibodies against RAB7 and HSP90, as the loading control. D Densitometric analysis was performed by Image Lab software (Bio-Rad). E A2780 cells were incubated with media or conditioned media (CM) as indicated (A2780 EVs and A2780 CCCP EVs CM) and were treated with stepwise concentrations of CDDP. Then cell viability was measured with the MTT assay. F EC50 was determined in A2780 cells treated as indicated after 72 h of incubation with CDDP using the MTT assay and calculated with GraphPad Prism. G Live imaging assay using LysoTracker DND-26 and MitoTracker Red CM-H2XRos on A2780 cells incubated with A2780 CIS CM and A2780 CIS EVs and on A2780 CIS cells used as control. H-I Number of lysosomes for cells and intensity of MitoTracker Red CM-H2XRos were determined by ImageJ software. Data represent the mean ± SEM of at least three independent experiments. * p < 0.05; ** p < 0.01; ***p < 0.001. Scale bar = 10 μm
Fig. 9
Fig. 9
Mitochondria-derived vesicles induce mitochondrial bioenergetic deficit in recipient chemosensitive cells. A Oxygen rate consumption (OCR) was determined in A2780 and A2780 treated with A2780 CIS CM and A2780 CIS EVs with Seahorse Mito stress kit assay. B-F Basal respiration, maximal respiration, ATP-production coupled respiration, proton leak, and spare respiration capacity were determined by Seahorse data elaboration. G-H DiI-stained EVs were detected co-localizing with mitochondria in A2780 recipient cells by live-cell imaging assay using MitoTracker Green and immunofluorescence using anti-TOM20 antibody. Data represent the mean ± SEM of at least three independent experiments. * p < 0.05; ** p < 0.01; ***p < 0.001. Scale bar = 10 μm
Fig. 10
Fig. 10
Analysis of mitochondrial and lysosomal deficit and EVs in SKOV-3 sensitive and resistant cells. A EC50 was determined in SKOV-3, SKOV-3 CIS-1, and SKOV-3 CIS-2 after 72 h of treatment with CDDP using the MTT(3-(4,5-dimethylthiazol-2-yl)-2,5-diphenol tetrazolium bromide) assay. B Late endocytic acid compartments were live stained with LysoTracker DND-26 dye and images were acquired with confocal microscopy. C, D The number and size of LysoTracker-positive organelles were determined by ImageJ software. E, F Relative protein abundance of RAB7, RAB27, and LAMP-1 was assessed by Western blot analysis and quantified by densitometry normalizing against α-Tubulin. G Oxygen rate consumption (OCR) was determined in SKOV-3 and in SKOV-3 CIS-1 and CI-2 with Seahorse Mito stress kit assay. H-M Basal respiration, maximal respiration, ATP-production coupled respiration, proton leak, and spare respiration capacity were determined by Seahorse data elaboration. N-R EVs were purified by immunoisolation. Positive and negative controls were used to verify the purity of EVs. Mitochondrial protein expression was evaluated in EVs by Western blot and the relative abundance of RAB7, UQCRC2, NDUFB8, and three tetraspanins (CD9, CD63, and CD81) was determined through densitometric analysis normalizing against α-Tubulin.* p < 0.05; ** p < 0.01; ***p < 0.001. Scale bar = 10 μm
Fig. 11
Fig. 11
Proposed mechanism of chemoresistance MDV-mediated. In chemosensitive cells, cisplatin uptake induces mitochondrial damage and generation of MDVs which are destined to MVBs and then degraded in lysosomes, or, alternatively, to a limited extent secreted. Under these conditions, cisplatin determines lysosomal membrane permeabilization (LMP) and cell death by apoptosis. In chemoresistant cells, mitochondria are dysfunctional and the cell responds to cisplatin increasing the number of MDVs. This cell is also characterized by a lysosomal deficit, and this condition determines massive secretion of MDVs outside the cells to propagate chemoresistance in the cancer microenvironment

Similar articles

Cited by

References

    1. Picca A, Guerra F, Calvani R, Romano R, Coelho-Junior HJ, Damiano FP, et al. Circulating mitochondrial DNA and Inter-organelle Contact Sites in Aging and Associated conditions. Cells. 2022;11(4):675. doi: 10.3390/cells11040675. - DOI - PMC - PubMed
    1. Pinti M, Cevenini E, Nasi M, De Biasi S, Salvioli S, Monti D, et al. Circulating mitochondrial DNA increases with age and is a familiar trait: implications for inflamm-aging. Eur J Immunol. 2014;44(5):1552–62. doi: 10.1002/eji.201343921. - DOI - PubMed
    1. Picca A, Guerra F, Calvani R, Coelho-Junior HJ, Bucci C, Marzetti E. Circulating extracellular vesicles: friends and foes in neurodegeneration. Neural Regen Res. 2022;17(3):534–42. doi: 10.4103/1673-5374.320972. - DOI - PMC - PubMed
    1. Picca A, Guerra F, Calvani R, Coelho-Junior HE, Bossola M, Landi F, et al. Generation and release of mitochondrial-derived vesicles in Health, Aging and Disease. J Clin Med. 2020;9(5):1440. doi: 10.3390/jcm9051440. - DOI - PMC - PubMed
    1. Sugiura A, McLelland G-L, Fon EA, McBride HM. A new pathway for mitochondrial quality control: mitochondrial-derived vesicles. EMBO J. 2014;33:2142–56. doi: 10.15252/embj.201488104. - DOI - PMC - PubMed

Publication types